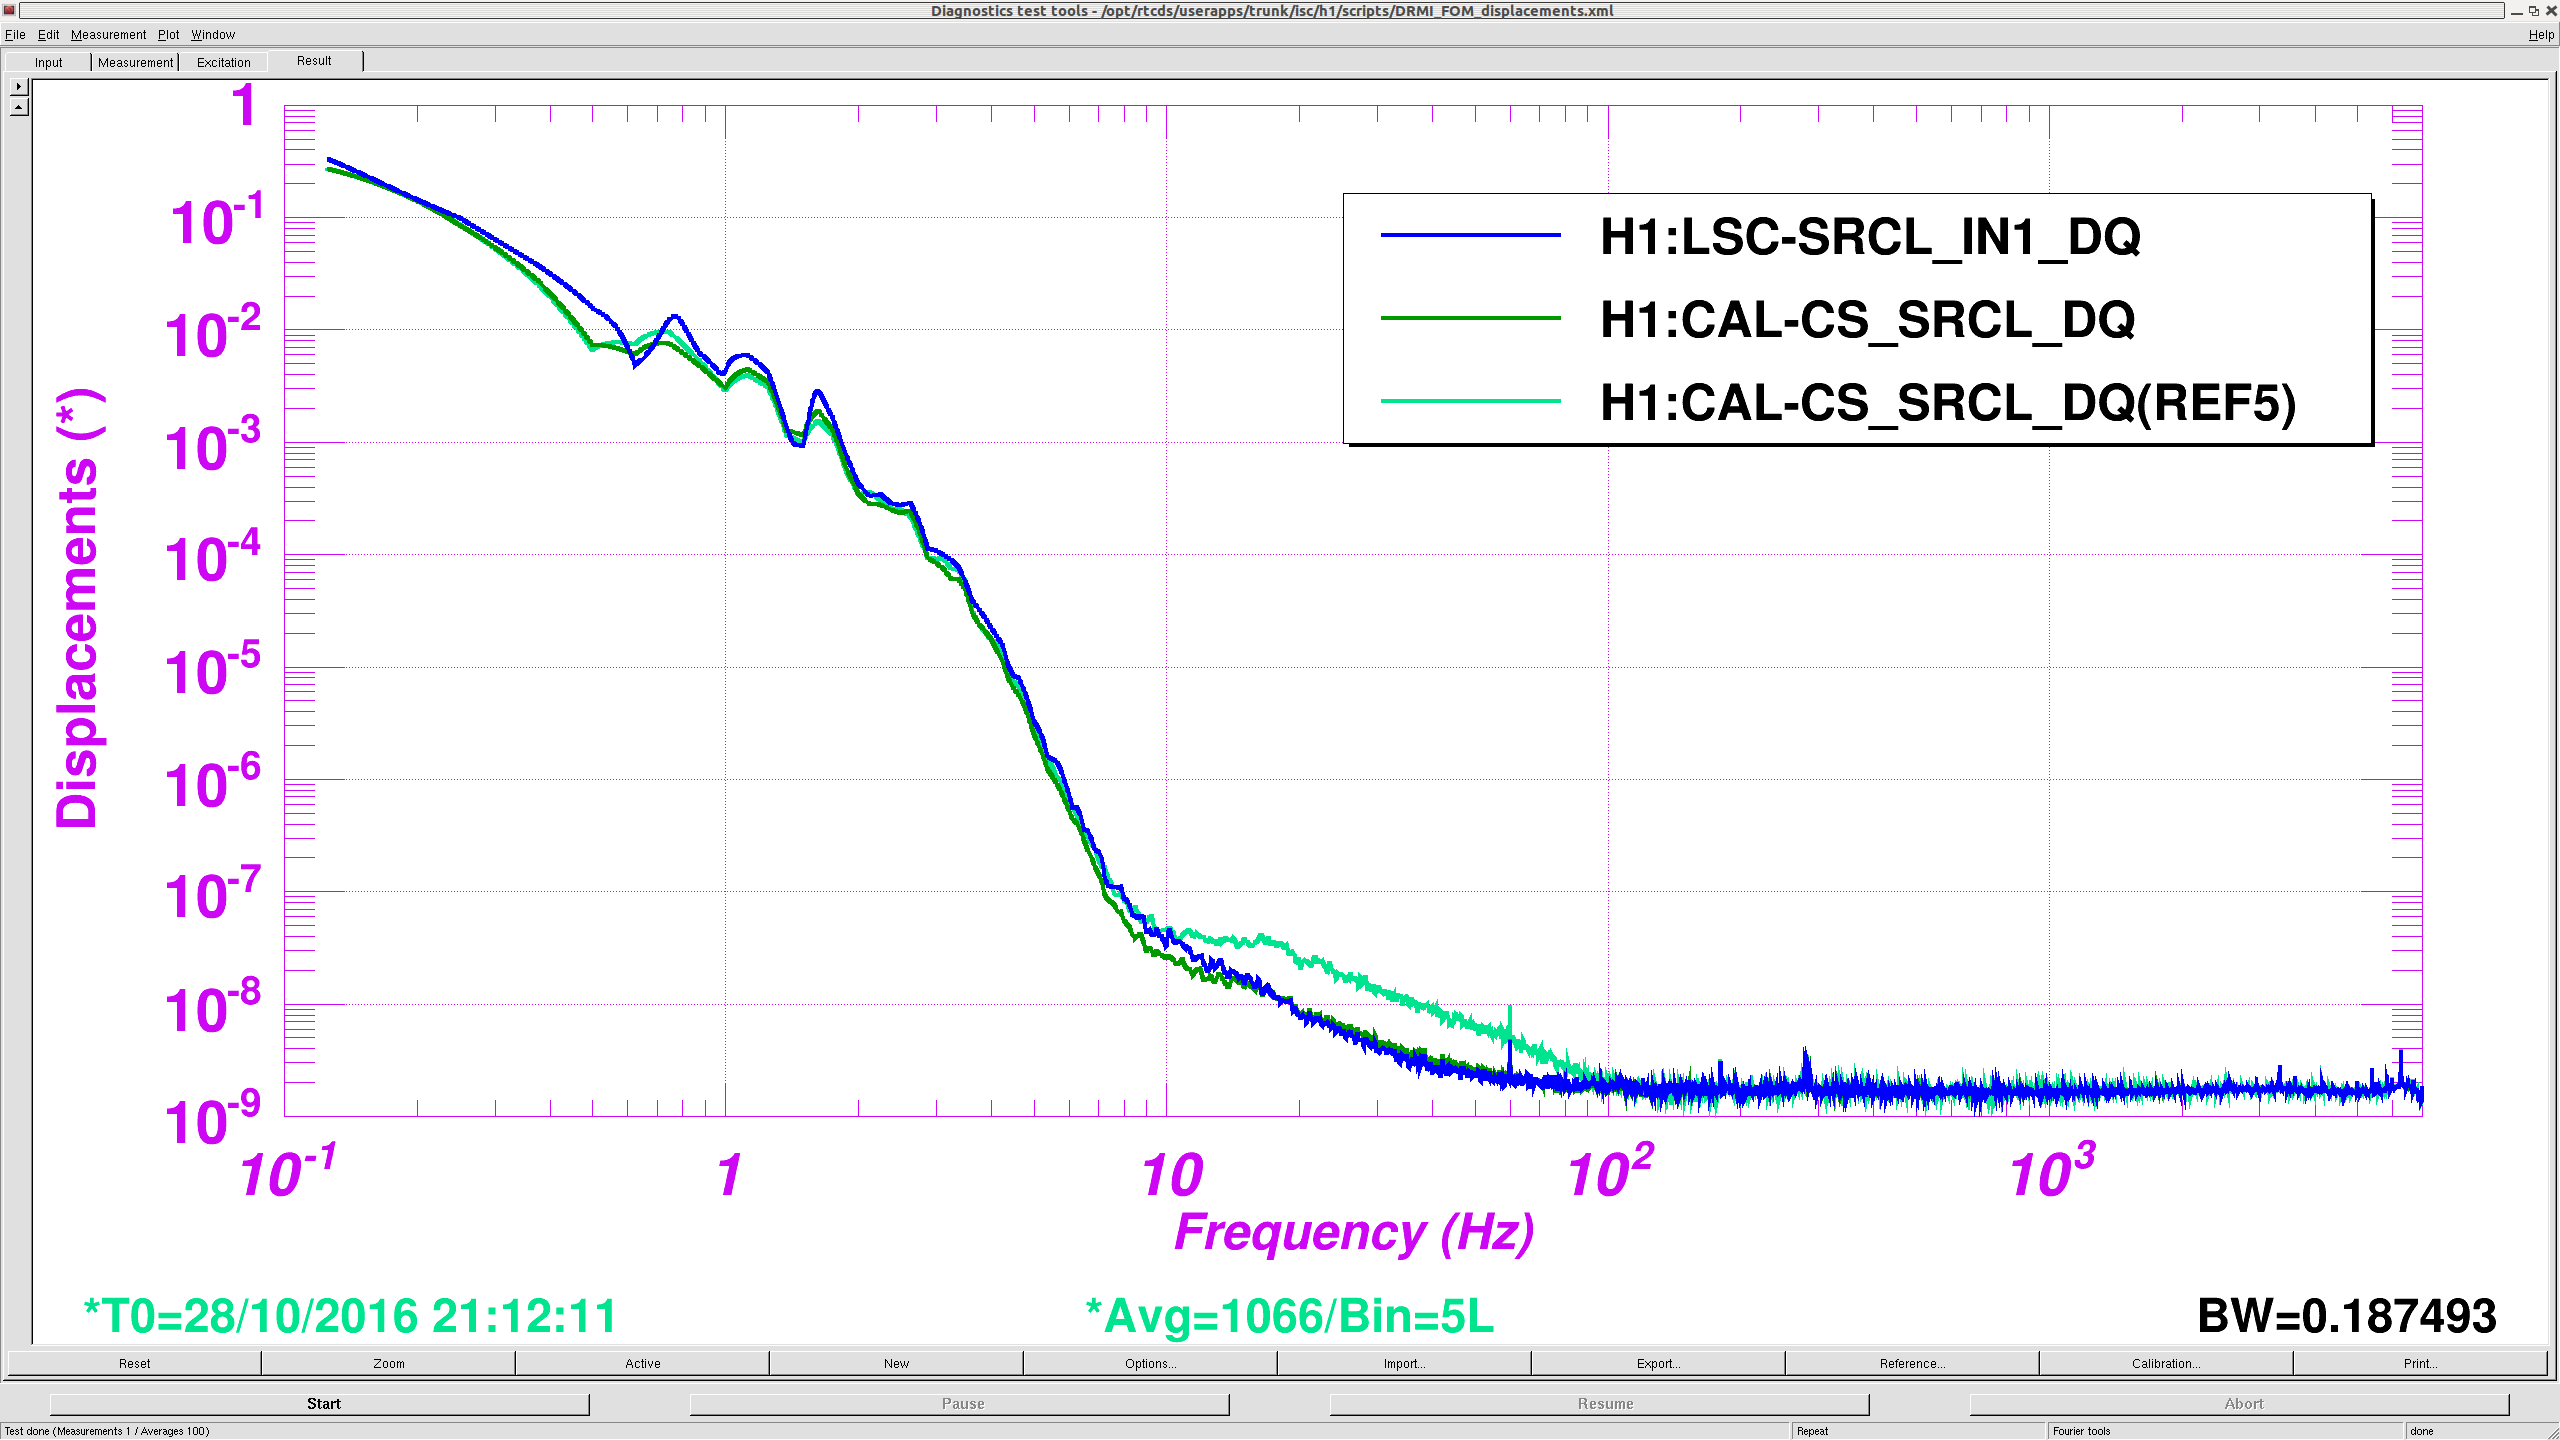
Similar to LLO a-log 26196 here we compare the broadband injections done using Pcal and Craig's time varying calibration model (26889). The attached plot show the comparison for the broadband injection done during January 2016 (a-log 24784). Except at known lines, such as 60 Hz harmonics, the measurement and model agree within their uncertainties. The code used to make this plot is added to calibration svn at aligocalibration/trunk/Runs/O1/H1/Scripts/PCAL/PcalGDSBroadbandComparison.m .
Last week, TJ created some guardian node to manage the configuration of the endstation ISI's, alog 27141. The intention is for these to be the primary interface for commissioners and operators in changing the Seismic configuration, depending on environment. I'm providing some guidance on when the different states should be used here.
The guardian code is still being worked on, configurations still need to be tested. Thats why there are fields with options, or without a full description of the state. The wind speeds are pretty much guesses, but the 10% and 90% microseism are indicated on with dashed lines on the .1 - .3 hz BLRMS on the seismic foms.
Wind speed | 0-10 mph | 10-25 mph | 25-35+ mph |
Microseism | |||
10% | Quite_90 No SC |
Quite_90 No SC
|
Some windy configuration |
10-90% |
Quite_90 No SC, or Quite 90 useism depending on microseism |
Quite90 useism Quite_90 BRS |
Quite_90 BRS Some windy config |
90% + |
45 No SC, 45 Useism 45 BRS SC depending on microseism |
Quite 90 BRS | There be dragons here. |
For your viewing pleasure, I translate between the states indicated by Jim in his table above and the actual name of the states in the Guardian Configuration nodes created by TJ (as Jim cites, see LHO aLOG 27141), and other Jargon that we'cve been tossing around in the SEI group: State Name Jim's Table Name Sensor Correction Description BLEND_Quite_90_SC_BRS Quite_90 BRS BRS-corrected STS GNDX to ST1X (or GNDY to ST1Y), "broad"-band filter (0.08 - 0.5 Hz) BLEND_Quite_90_SC_useim Quite 90 useism STS Alone, using "narrow"-band focused at the microseism (0.1-0.3 Hz) BLEND_Quite_90_SC_None Quite_90 No SC BLEND_45mHz_SC_BRS 45 BRS SC BLEND_45mHz_SC_useim 45 Useism Runs in the corner station (but there's no node) BLEND_45mHz_SC_None 45 No SC Before BRSs existed, this was the nominal configuration for the End Stations Note that I put "narrow" and "broad" band in quotes, because there's about 10 sensor correction filter options and none of them are really truly narrow or broad in their modelled / expected performance, and any real performance depends heavily on the ground motion. E.g. while one might expect to get great performance out of a broad-band sensor correction filter, if it's windy, that ideal performance may be completely washed out by other noise.
Per work permit 5885, we started pulling in the field cables for the Newtonian Noise Array. This involved work over HAM4 and north side of BSC2. Cables runs are as follows:
CER TCS-C1 Rack to SUS-R6 Rack
CER TCS-C1 Rack to TCS-R1
Remaing cables that need to be pulled-in are the ITM ESD cables.
Optical Lever trends for the last 7 days for Pitch, Yaw, and Sums.
FAMIS#: 4676
P. King, J. Bartlett, J. Oberling
Due to the high number of PSL chiller trips lately, this morning we swapped the in-service PSL chiller assembly (aka Gromit) for the the backup (aka Wallace). Both crystal and diode chillers are currently up and running so that air can bleed from the system. the laser is not on at this time, we will bring it back up this afternoon after enough time has passed for the air to bleed out. Hopefully this solves the chiller trips we've been having recently. Will continue to monitor.
Huge thanks to Jeff Bartlett for coming in on the first day of his vacation to help with the swap.
TITLE: 05/19 Day Shift: 15:00-23:00 UTC (08:00-16:00 PST), all times posted in UTC
STATE of H1: Lock Aquisition
OUTGOING OPERATOR: None
CURRENT ENVIRONMENT:
Wind: 27mph Gusts, 19mph 5min avg
Primary useism: 0.08 μm/s
Secondary useism: 0.17 μm/s
QUICK SUMMARY: Wind is starting to pick up a bit, let's see what else today has in store for us!
Transition Summary: Title: 05/18/2016, Evening Shift 23:00 – 07:00 (16:00 – 00:00) All times in UTC (PT) State of H1: IFO locked at DC_READOUT with 2.1w of power. The wind and seismic are a bit rung up but do not seem to be effecting the lock. Commissioning: Several commissioners working on IFO. Outgoing Operator: Ed Activity Log: All Times in UTC (PT) 23:00 (16:00) Start of shift 23:00 (16:00) Gerardo – Back from filling CP3 23:47 (16:47) Sheila & Haocun – Going to ICST1 23:50 (16:50) PSL – Down Flow Sensor error 1 – Notified Peter 00:18 (15:18) Sheila & Haocun – Out of the LVEA 00:40 (15:42) Sheila & Jeff B. – Into LVEA to reset the NPRO Noise Eater 01:30 (18:30) PSL – Down again due to same sensor flow error – Notified PSL team End of Shift Summary: Title: 05/18/2016, Evening Shift 23:00 – 07:00 (16:00 – 00:00) All times in UTC (PT) Support: Jenne, Sheila, Haocun, Evan, Craig, Ross Incoming Operator: N/A Shift Detail Summary: High winds at the site (up to 36mph), having trouble getting past LOCKING_ALS. Hugh & Jeff B. working with the BRS blends. At 23:50 (16:50) PSL down due to flow sensor error on PSL Crystal Chiller. Peter working on recovery. PSL ran until ~01:30 (18:30) when it took another flow sensor error. Spoke to Jason and Peter. Going to leave the PSL down tonight. The backup chiller (Wallace) has been prepped for installation. The plan is to swap out the primary chiller (Gromit) with the backup chiller tomorrow morning.
C. Cahillane I have looked at the actuation strengths to check the covariance between the actuation stages for each of the four measurements. The four measurements are the three calibration week actuation measurements on August 26, 28, and 29, and the Post O1 January 7 measurement. The covariance was calculated by taking the residuals of the fitted actuation strengths and comparing points between L1 and L2, L1 and L3, and L2 and L3 at the same frequency for each day's measurement. The different dots in the covariance plots correspond to frequency. The dark blue is low frequency, and the light orange is high frequency. The covariance is on the same order as the overall variance for each actuation stage. Worse still, it is positively correlated, meaning we may have underestimated uncertainty by ignoring these terms. My results also indicate the measurements may be inconsistent between days. The August 28 measurement inexplicably displays no covariance between actuation stages, while all of the other measurements do. Jeff has tried looking at the optical gain fluctuations during each day's measurements, but this doesn't appear to be the cause.
J. Kissel, C. Cahillane, K. Izumi Some more details on this. For context about why the discovery of this ~1-2%-level, positive sqrt(covariance) matters, check out G1601084. In this aLOG, we're discussing scenario (4)(c), where because we use the same PCAL to DARM transfer function to provide the absolute calibration for each ith Stage EXC to DARM transfer function, there may potentially be covariance between the ith and jth stage's absolute calibration result. We would expect this to happen if the PCAL2DARM transfer function has some very-low-frequency, statistical-in-nature fluctuation over the course of the entire ~30 minute measurement that is larger than any similar fluctuation in the ithStage2DARM transfer function. Craig's results above show that for 3 out the 4 days, the above scenario must be true -- that there is some slow stochastic process that is influencing the PCAL2DARM transfer function that's larger than whatever process (either the same or different) in the ith Stage EXC 2 DARM transfer function, so there is covariance between our estimate of the statistical uncertainty in the ith and jith stage. In the right 4 columns of the 3x5 array of subplots, which show this covariance between the i and jth stage, and the 4 columns are the four measurement days. We can see by the color-coding of each frequency point [as Craig says, blue to orange is denoting low to high frequency] that it's *not* that, say, the low frequency points are more covariant than the high frequency points, or vice versa. What's most intriguing is that the covariance seems to be a function of measurement day, and the *least* covariant day is the 2015-08-28 measurement. *A* theory for why the covariance may vary from day to day is the optical gain of the IFO (i.e. the DARM part of the PCAL2DARM TF) is slowly fluctuating by different amplitudes from day to day based on the seismic environment. As a test of this theory, I've gathered the times of all of the measurements used to compose these data sets, and plotted the optical gain (as measured by the intra-cavity arm power, as reported by the average of the TRANSMON QPD SUM). From this time-series, I assume that the optical gain is fluctuating stochastically over the entire ~15 minute excitation period, take a histogram and report the standard deviation as a single-number, quantitative estimate of the amplitude of said fluctuation. This way, I can compare the amplitudes during the 4 measurement times. Sadly, though we do see a change in amplitude of optical gain fluctuations between measurement days -- as large as a factor of two between the best and worst -- the pattern of optical gain fluctuation amplitude does not match the covariance amplitude pattern from measurement day to measurement day. The covariance is comparable on days 1, 3, and 4, the optical gain fluctuations are smallest during the first day of measurements, and steadily get worse in time. Further, the amplitude of optical gain fluctuation is comparable between a given measurement day's PCAL2DARM transfer function and each ith stage of EXC2DARM transfer function. -------------- Details: The last page of the attachment shows my attempt to use several versions of the TRANSMON QPDs in order to arrive at the intra-cavity arm power. I'm quite sad that the different methods of calibration don't agree, so I've chose to use the one the bast agrees with about what we think the intra-cavity power should be. The channels I've used are H1:LSC-TR_X_NORM_OUT16 H1:LSC-TR_Y_NORM_OUT16 H1:ASC-X_TR_A_NSUM_OUT16 H1:ASC-X_TR_B_NSUM_OUT16 H1:ASC-Y_TR_A_NSUM_OUT16 H1:ASC-Y_TR_B_NSUM_OUT16 where I've used the EPICS channels sampled at 16 Hz, because I'm looking for minute-time-scale fluctuations (and there aren't so many versions stored as fast channels). All signals are normalized to the input power. For the LSC versions, at the advice of Jenne, I've taken the average of the two channels, and scaled the raw counts by the input power, PRM transmission, and arm-cavity gain, accounting for the beam splitter, Circulating Arm Cavity Power [ct] = 0.5 * (H1:LSC-TR_X_NORM_OUT16 + H1:LSC-TR_Y_NORM_OUT16) Circulating Arm Cavity Power [W] = (Circulating Arm Cavity Power [ct]) * 22.5 [W] * 0.03 [W/W] * 280 [W/W] * 0.5 [W/W] where I've trended the PSL input power to find the power into PRM, and 0.03 and 280 are well-known numbers. For the ASC version of the signals, I'd tried following the prescription from Dan's LHO aLOG (15431), for which Sheila suggest should be the same for all four QPDs: Circulating Arm Cavity Power [W] = H1:ASC-X_TR_A_NSUM_OUT16 [ct] * 1/3.98 [V/V] % QPD Whitening Gain * 1/2621440 [W_atQPDs / ct] % Electronics Chain Calibration (sans whitening gain) * 1/0.025 [W_afterETMS / W_atQPDs] % Amount of light exiting the ETM than gets to QPDs * 1/3.6e-6 [W_inArm / W_afterETMs] % ETM transmission where I've trended the whitening gain to see that it was no longer the 18 [dB(V/V)] = 7.9 [V/V] quoted in Dan's aLOG, but 12 [dB(V/V)] = 3.98 [V/V] at the time of the first three measurements. Since getting a consistent calibration for the intra-cavity power was not the point of this study, I moved on sticking with the metric that gave the answer closest to what was expected, as mentioned above. Script to produce these results: /ligo/svncommon/CalSVN/aligocalibration/trunk/Runs/O1/H1/Scripts/Uncertainty/showopticalgainfluctuation_during_actuationfunctionmeasts_O1.m
After Peter recovered the PSL, it ran until ~01:30 (18:30) when it took another flow sensor error. Spoke to Jason and Peter. I am going to prep Wallace tonight and will swap out the chillers tomorrow.
Wallace is ready to be installed.
Sheila, Haocun We tried with the POP X path with 36MHz to control PR3, and phased each quadrant it to minimize the Q signal, as shown below. We used -1 in the matrix for Pitch. This is fine for Pitch, but in Yaw, there is an offset between the new signal and the REFL signal. So in the afternoon, we changed to use 45MHz demodulation and changed the dark offsets. Then the laser broke down.
Since May 18 4:49 UTC (Tuesday 9:49 PM local time), POPX whitening gain has been "even" (i.e. gain step = dB/3 = even), which is known not to work (alog 26307). You need to use "odd" gain for the moment.
Was it before or after Tuesday 9:49 local time when you observed an offset in 36MHz YAW signal?
Update: According to Haocun the offset was observed on Wednesday local time. The measurement needs to be repeated with odd gain step.
In trying to determine whether or not there was a water leak with the laser, the humidity sensor in the high power oscillator was looked at. In doing so, a interesting coincidence was noticed - the reason for which is not obvious to me (anyway). WaterTrip1.png shows the humidity sensor output from last night when Jeff reported that the laser tripped. WaterTrip2.png shows the same signal from when the laser tripped a few moments ago. Both plots show a small oscillation-like variation in the humidity. The same behaviour shows up in the temperature sensors mounted to the laser base plate. Cave flow sensors for heads 3 and 4.
Because PSL power fluctuation impacts the maximum IMC input power (the amplitude variable for the angle-power calculator), one thing we could do is to keep an eye on H1:IMC-PWR_EOM_OUT16 chanel. The difference between the EOM channel and the actual max power output from the RS is roughly 1W (as of yesterday with PWR_EOM gain of 0.916. I assume this can change). So replacing "Power in (W)" variable in the calculator with (PWR_EOM_OUT_16) - 1 should do the trick (I did the calculation and it seems to work out. Again, watch out for the PWR_EOM gain). First attachment is the maximum IMC input power compared to the EOM power when I ran the RS script yesterday. Second attachment shows increase in EOM _OUT16 today and corrected IMC input power towards the end of the plot (2W instead of 2.15W). Third attachment is the PWR_EOM filter as of today. It would be nice if EOM power agrees with the maximum IMC input power unless we really lose 1 W somewhere on the table (I see that there's another beam dump after the RS in the PSL layout).
23:50 (16:50) PSL down due to flow sensor error on PSL Crystal Chiller. Peter is working on recovery.
1/2 open LLCV bypass valve, and the exhaust bypass valve fully open.
Flow was noted after 82 seconds, closed LLCV valve, and 3 minutes later the exhaust bypass valve was closed.
[Sheila, Jenne]
These are numbers pulled from our dP/dTheta measurements from last night (mentioned in alog 27235). I have gotten the numbers into RIN/theta, since we want to know how much the power fluctuates for a given angular motion of an optic. The short summary is that the Yarm optics affect the power fluctuation much more significantly than the Xarm optics do, and that the ETMs affect the power more than the ITMs.
Sum up of 2W results:
RIN_POP / theta_ITMX | 0.79 e4 |
RIN_POP / theta_ITMY | 2.9 e4 |
RIN_POP / theta_ETMX | 2.4 e4 |
RIN_POP / theta_ETMY | 4.25 e4 |
We'd like to remeasure these values at different powers - hopefully they're constant. Of course, these are relative power fluctuations versus angle, so the overall force on the optics will be increasing as we increase the power.
The following table with more detailed results has a crazy-town amount of information, some of which I'm not totally sure what to do with yet. The difficulty is that since we have ASC loops running, when we dither one test mass, all 4 test masses move. So. Here's the gory detail. All dithers were at 0.51 Hz in pitch to the L2 stage of the test masses. Start times are UTC of 17 May 2016. The values in the table below are at our 0.51 Hz dither freq. The numbers in the summary table above are the RIN of POP_A_LF versus the angular motion of the optic we were driving at the time.
drive optic | start time | drive amplitude [cts] | ITMX oplev [urad] | ITMY oplev [urad] | ETMX oplev [urad] | ETMY oplev [urad] | TRX RIN | TRY RIN | POP_A_LF RIN | RIN_POP / theta_driveOptic | drive optic |
ITMY | 05:21:54 | 500 | 0.03 | 0.23 | 0.03 | 0.13 | 7.1 e-3 | 1.3 e-2 | 6.7 e-3 | 2.9 e4 | ITMY |
ITMX | 05:27:53 | 500 | 0.24 | 0.01 | 0.14 | 0.02 | 4.4 e-3 | 8.0 e-3 | 1.9 e-3 | 0.79 e4 | ITMX |
ETMX | 05:33:54 | 300 | 0.12 | 0.01 | 0.11 | 0.02 | 5.5 e-3 | 1.2 e-2 | 2.7 e-3 | 2.4 e4 | ETMX |
ETMY | 05:38:13 | 300 | 0.01 | 0.1 | 0.03 | 0.08 | 2.4 e-3 | 1.2 e-2 | 3.4 e-3 | 4.25 e4 | ETMY |
These numbers already seem very large to me. Did you happen to measure the phase relation as well? Also is this measurement with a maximum power recycling gain (i.e. >40)?
Jenne provided me with the phase measurement data and diaggui templates. Here are a summary of the phase of the transfer functions between various optics to various channels. All the quantities are in unit of [deg].
to ITMX oplev |
to ITMY oplev |
to ETMX oplev |
to ETMY oplev |
to TRX B |
to TRY B |
to POP A |
|
from ITMX oplev | N/A | -56 | -7.3 | -7.8 | 52 | 175 | 88 |
from ITMY oplev | -60 | N/A | -25 | -9.9 | -49 | 2.3 | -70 |
from ETMX oplev | -19 | 127 | N/A | -154 | -125 | 20 | -71 |
from ETMY oplev | -92 | -20 | -147 | N/A | 90 | -153 | 144 |
I need some time to digest this result.
In addition, the power recycling seems to have been suboptimal. According to POP A, the recycling gain was estimated to be 34 while an average of the TR signals tell that it was 37. For the record, the highest recycling gain we achieved was about 41.