jeffrey.kissel@LIGO.ORG - posted 16:54, Wednesday 07 December 2016 - last comment - 17:35, Wednesday 07 December 2016(32328)
SR3 Glitch Lockloss: The Investigation Continues
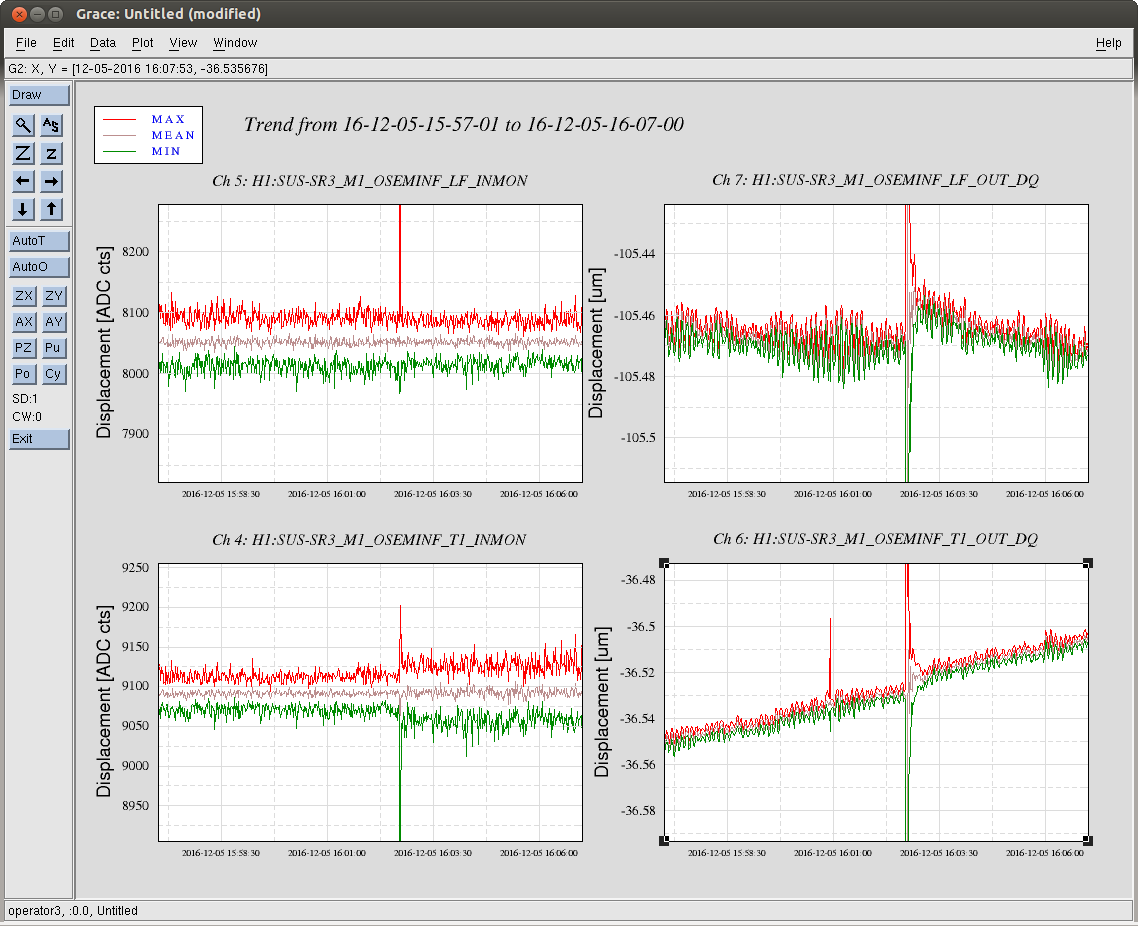
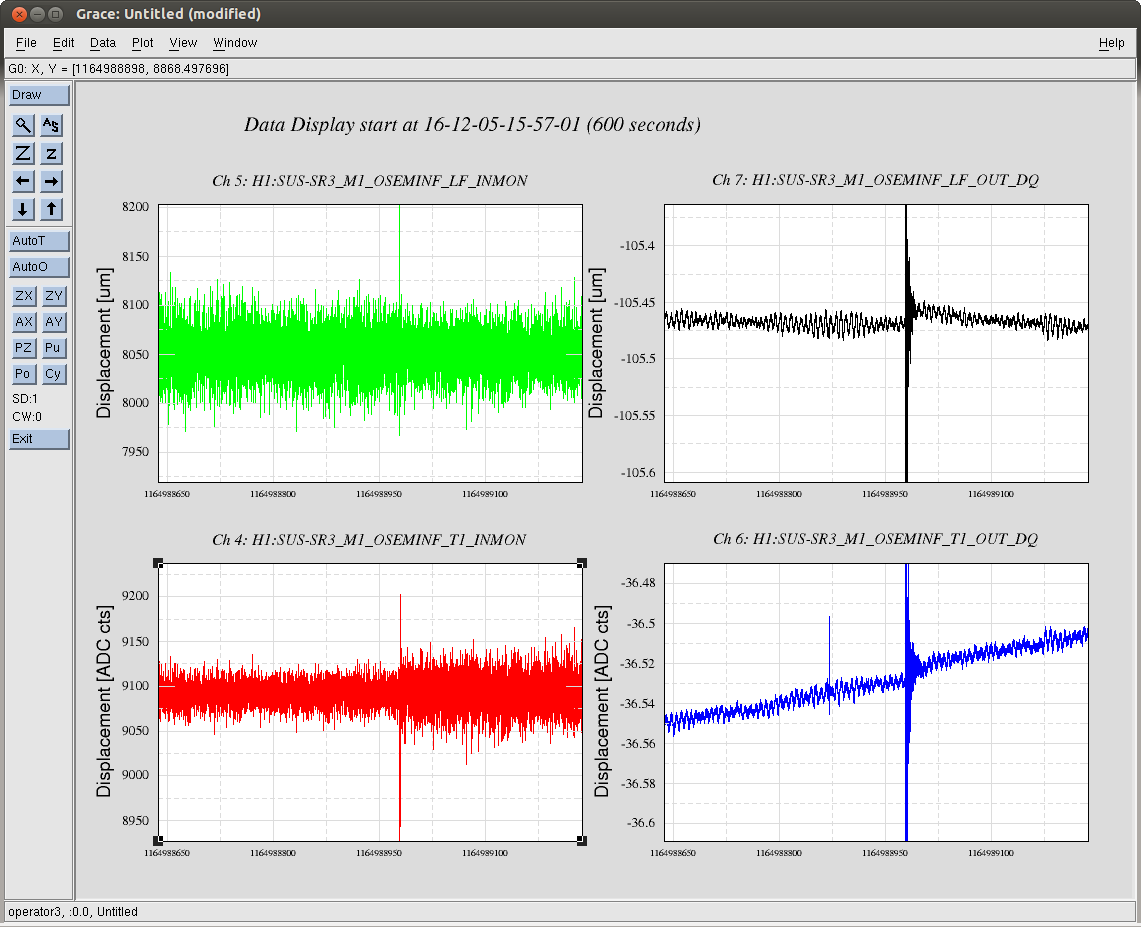
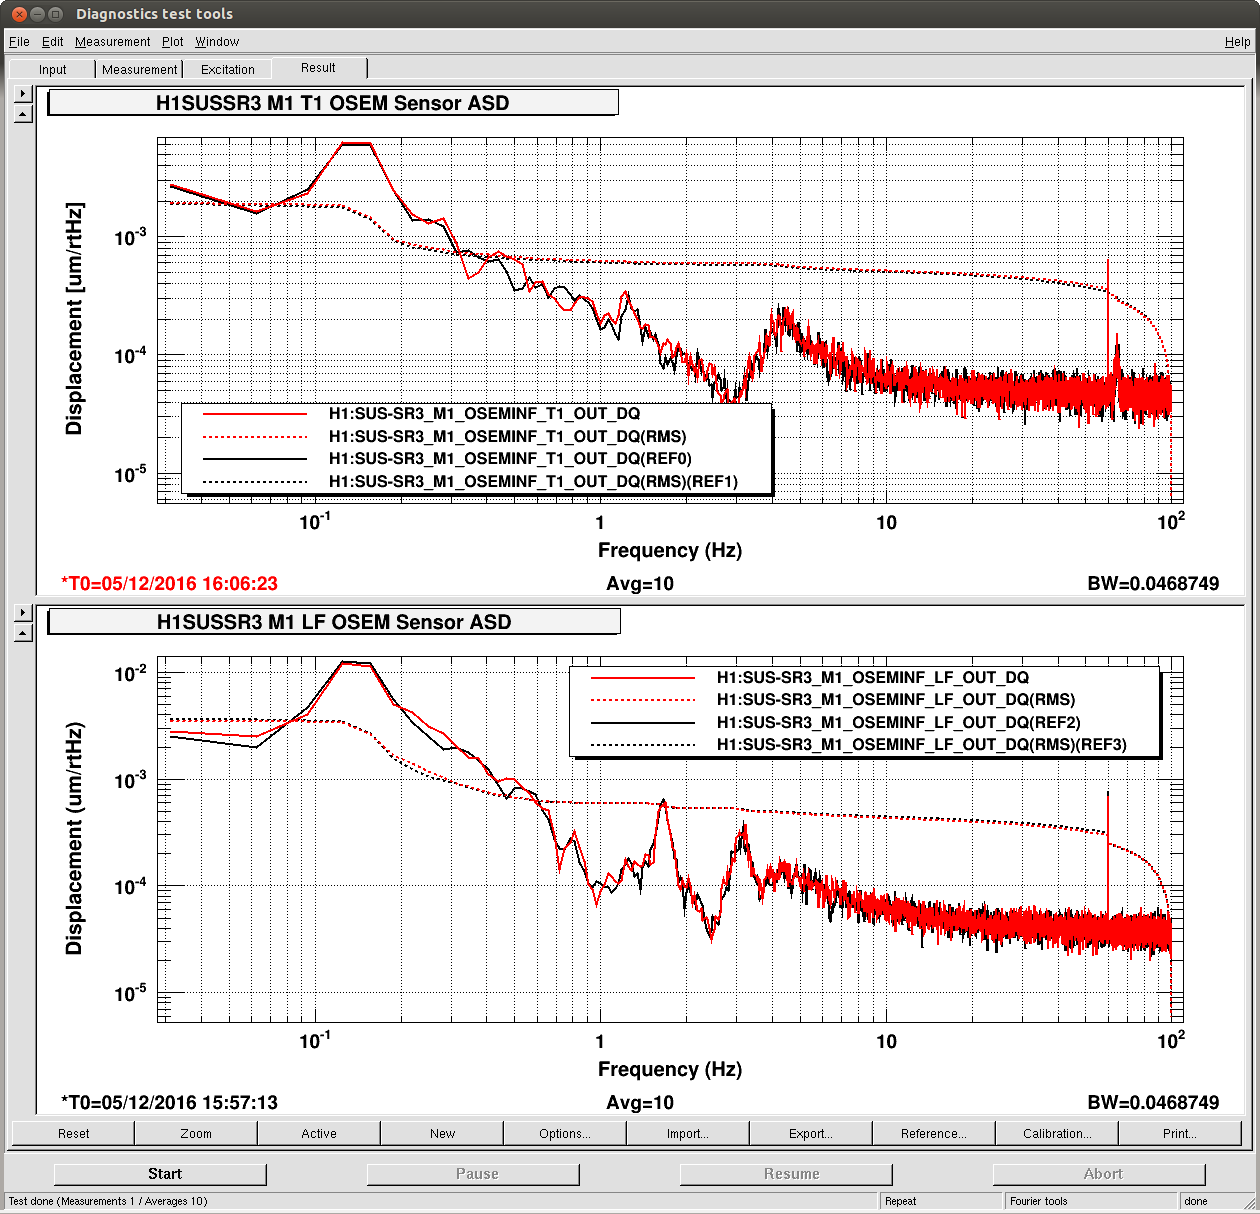
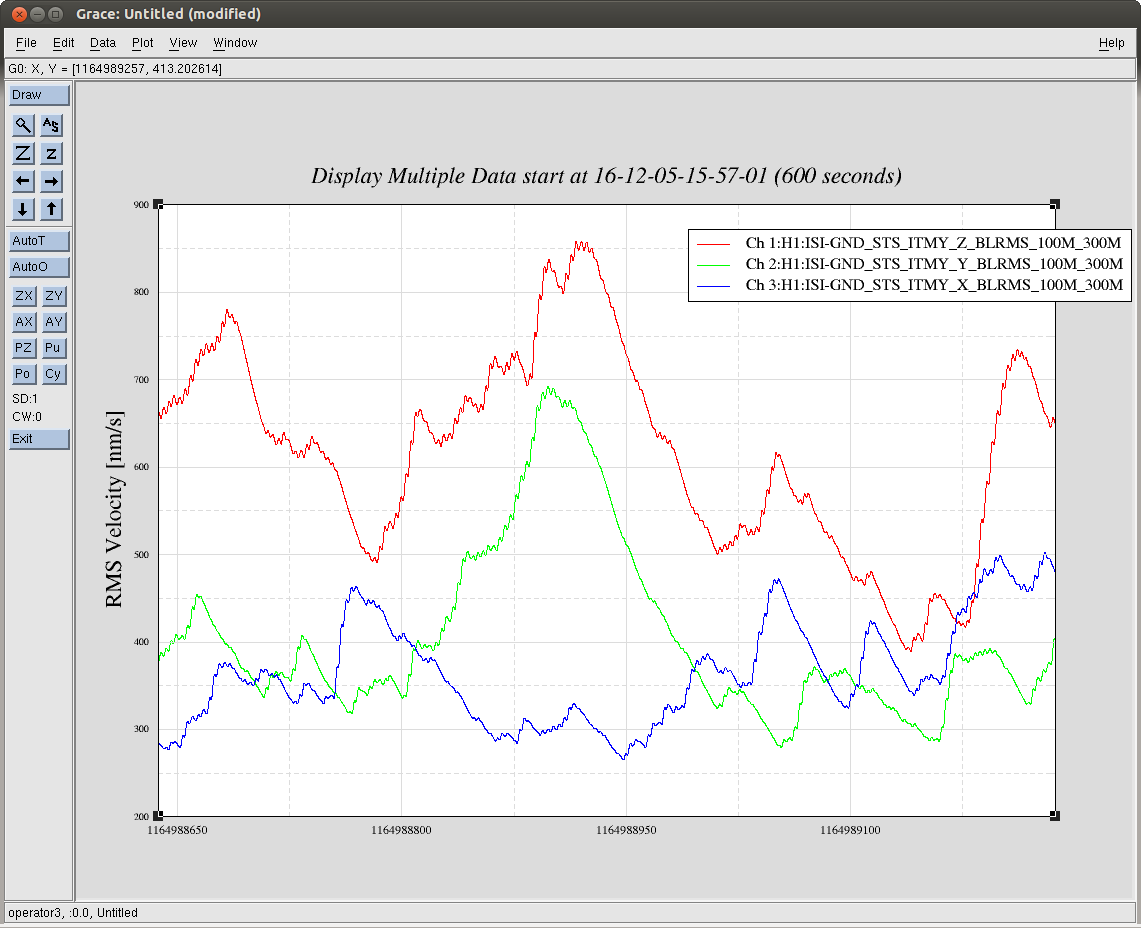
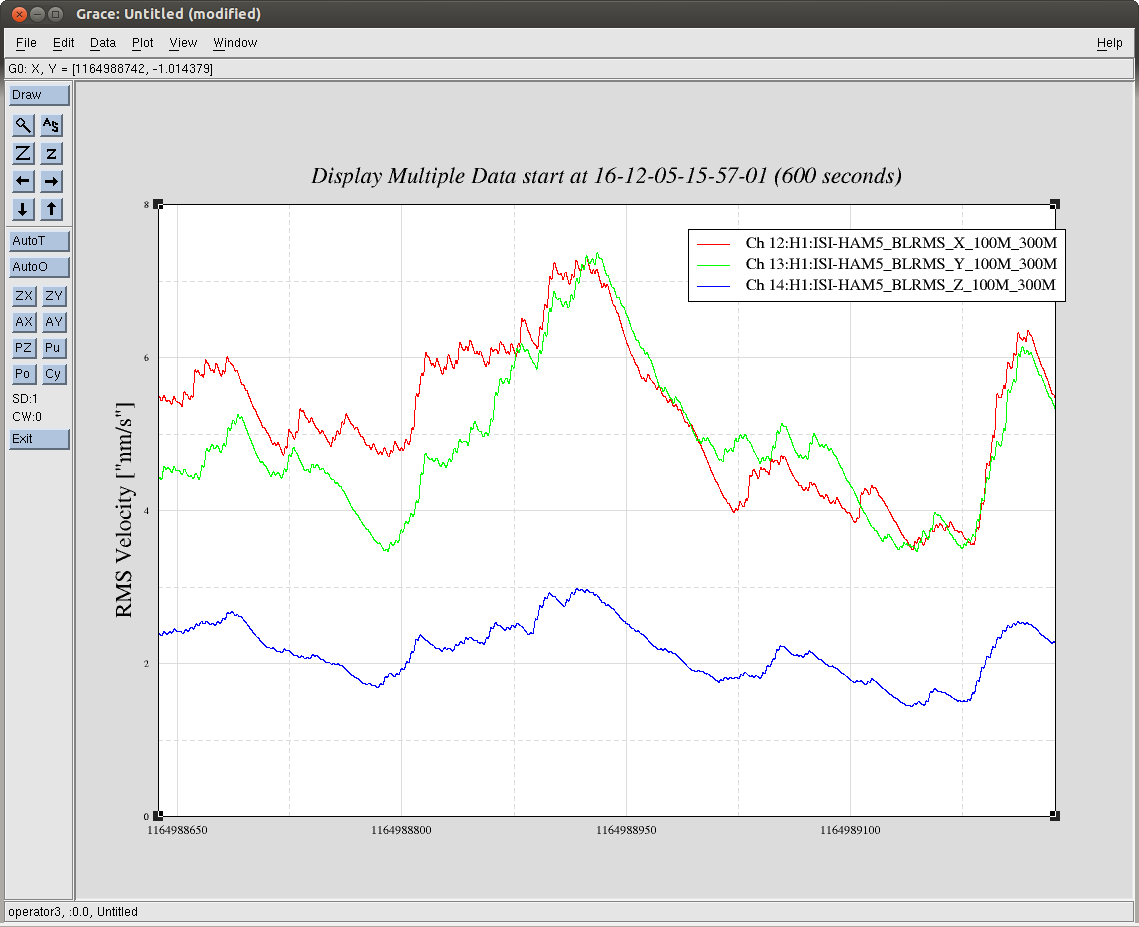
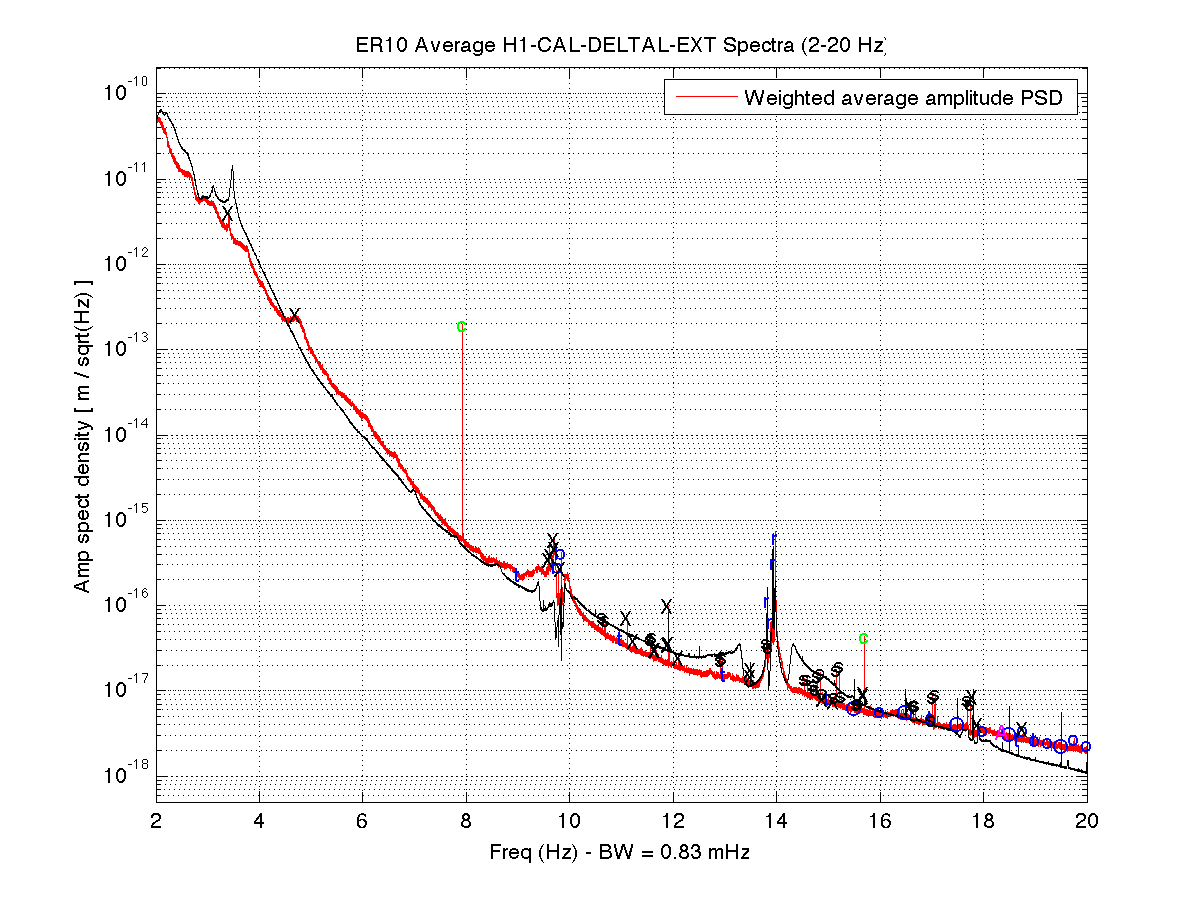
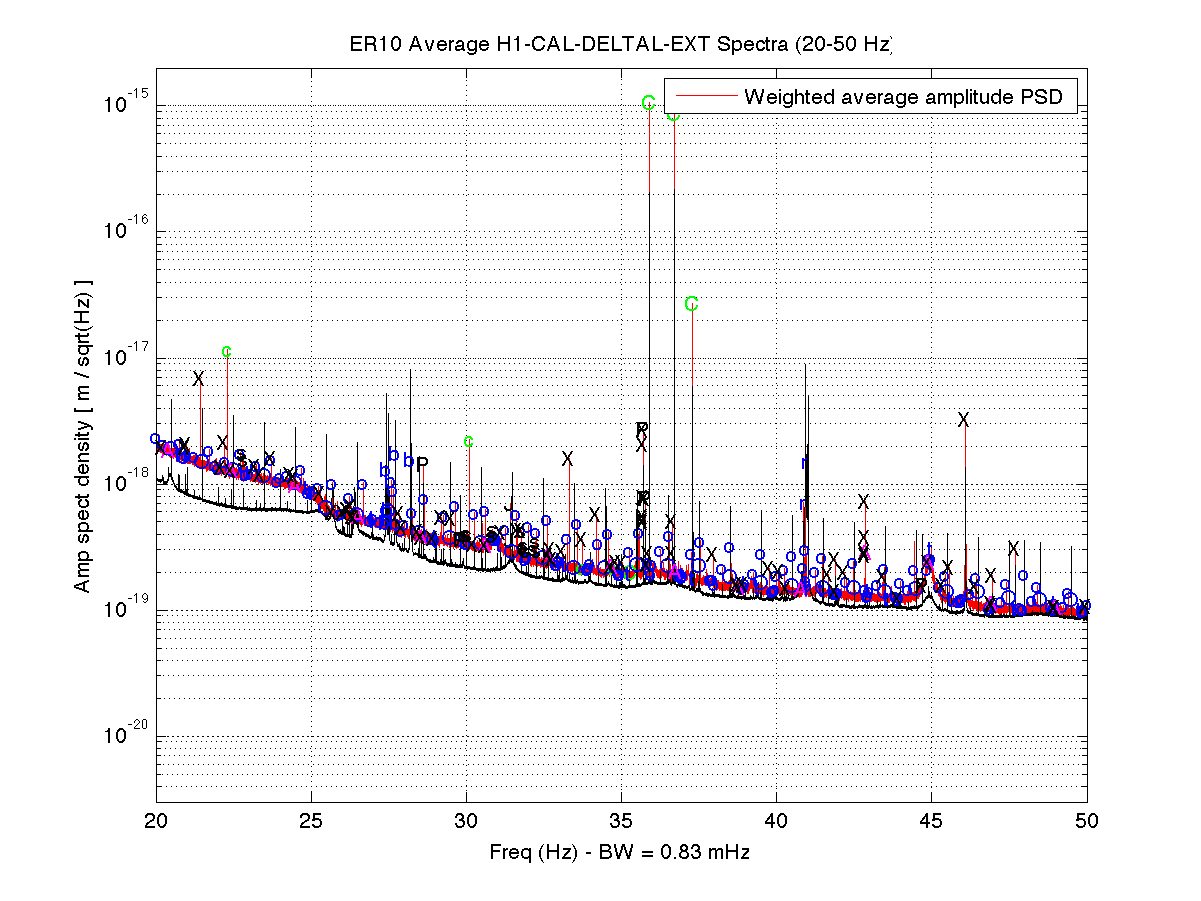
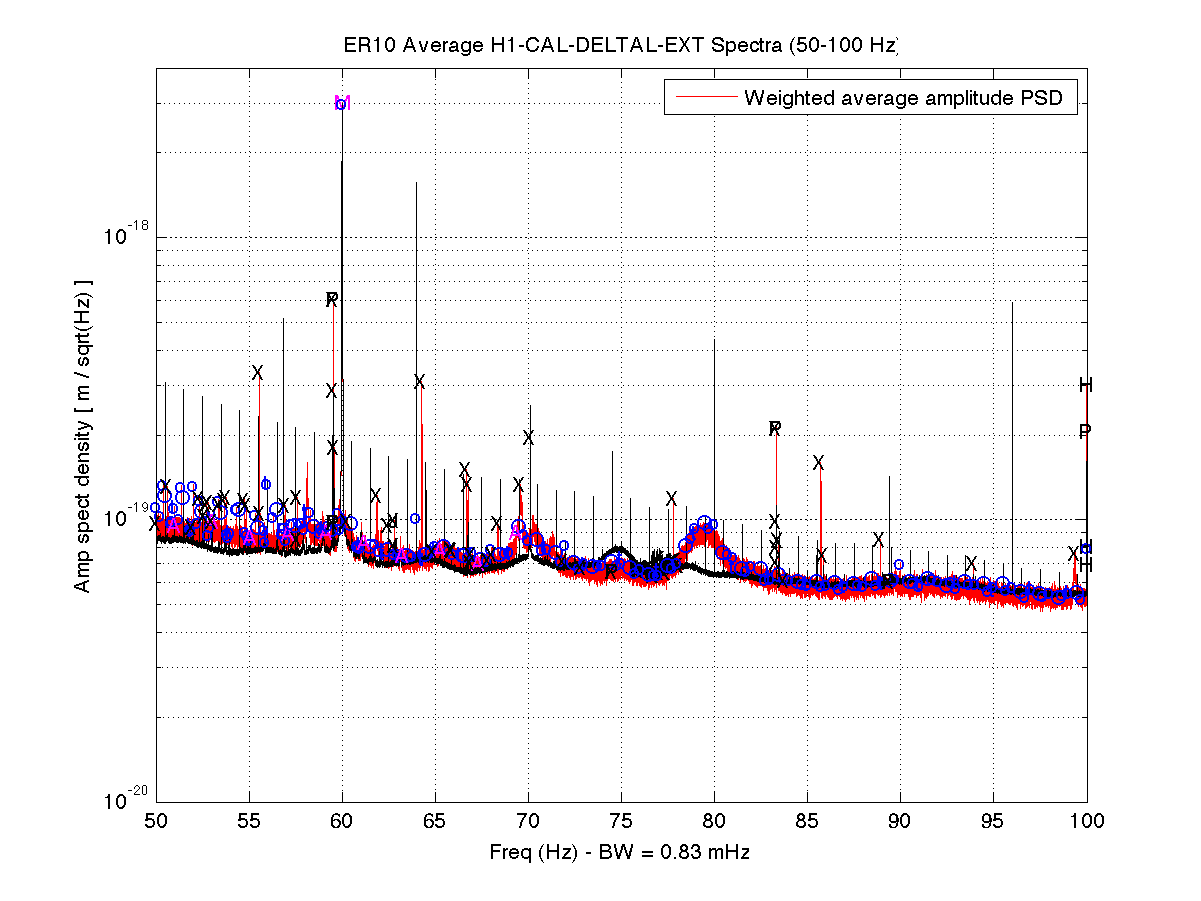
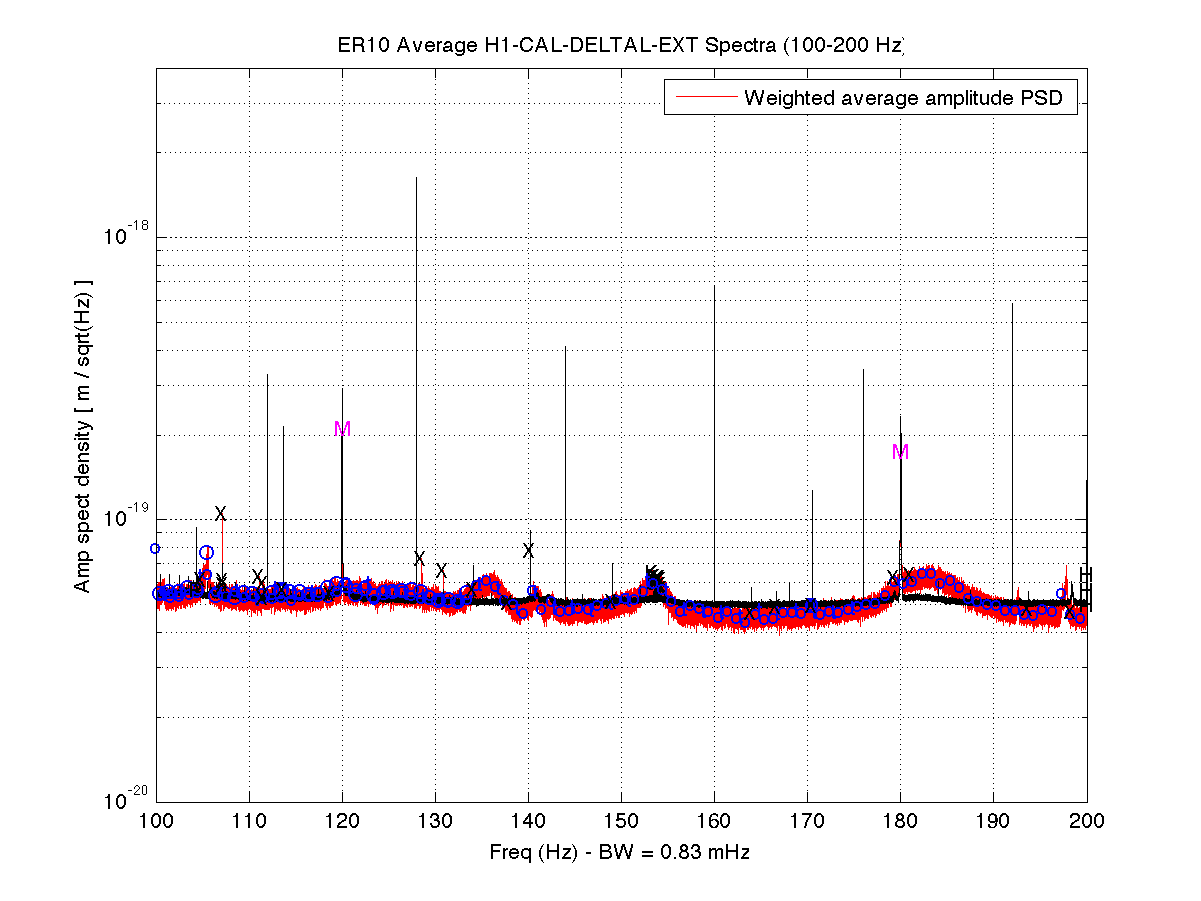
J. Kissel (B. Weaver, S. Dwyer)
FRS Ticket 6852

It was recently identified that a Dec 05 lock loss looked suspiciously cpoincident with a glitch in the H1 SUS SR3 M1 T1 and LF OSEMs (see LHO aLOG 32220). The same OSEMs were suspected in a subsequent Dec 06 lock loss (LHO aLOG 32251), and thus an FRS ticket was filed (FRS Ticket 6852), but was later deemed too confusing to draw conclusions (see brief mention of it in LHO aLOG 32279).

Betsy then went back to find the minute trends of the SR3 OSEM noise appeared suddenly louder after the Dec 05 glitch/lock loss in a 5 day trend surrounding the glitch (split into LHO aLOGs 32280 and 32281).

In this aLOG, I investigate further by zooming into 10 minutes surrounding the Dec 05 glitch. I attach three plots:
- A 10 minute trend of second trends for the suspect channels, both in terms of uncalibrated EPICs records (the same that Betsy chose to use in her aLOG) and in calibrated fast channels (stored at 256 Hz). The EPICs records show a similar sudden increase in amplitude of max and min trends, but the calibrated fast channels do not. T1 shows a much larger increase in max/min noise than LF.
- A full-data time-series of the same to channels in the same two formats. Same thing here regarding the sudden increase in noise in T1 INMON, but only a brief glitch in LF's INMON. Again, no such obvious change in behavior on the fast channels. Interestingly, it looks like there's smaller glitch in T1's fast channel 107 [sec] earlier.
- An amplitude spectral density of the calibrated fast channel before and after the glitch happens (15:57 UTC vs 16:06 UTC, 0.04 Hz BW ASD). There's no obvious difference between these spectra. This points to either the excess noise showing up in the INMONs is at higher than ~100 Hz, or the EPICs records are just reporting bogus information. Because I'm suspicious of the apparently incredibly low microseism, I also attach BLRMS of the microseism on the ground and on the ISI around this time. Indeed, the GS13s seem to confirm that the RMS velocity is somewhere around 5 [nm/s], which is roughly equivalent to ~5 [nm] at 0.15 Hz, which in the right ballpark of what the OSEMs report of 2-4 e-3 [um] or 2-4 [nm] or 2-4 [nm/s].

In conclusion -- still no evidence for anything more than a one-time glitch, and there is now little-to-no evidence for permanently different noise behavior after the glitch. We need to wait for more occurances of this issue with obvious evidence before we go for making any change to the instrument.
Images attached to this report
Comments related to this report
This is something that I think has definitely happened twice:
In the example from Dec 5th, it is clear that there is a glitch in T1 and LF, on Dec 6th it is not clear which osem to blame, but it is clear that SR3 moves before the lockloss (see this plot). We don't send any ISC feedback to SR3, and I already checked that the cage servo isn't glitching in either case, so this is most likely a problem that comes from the top mass damping.


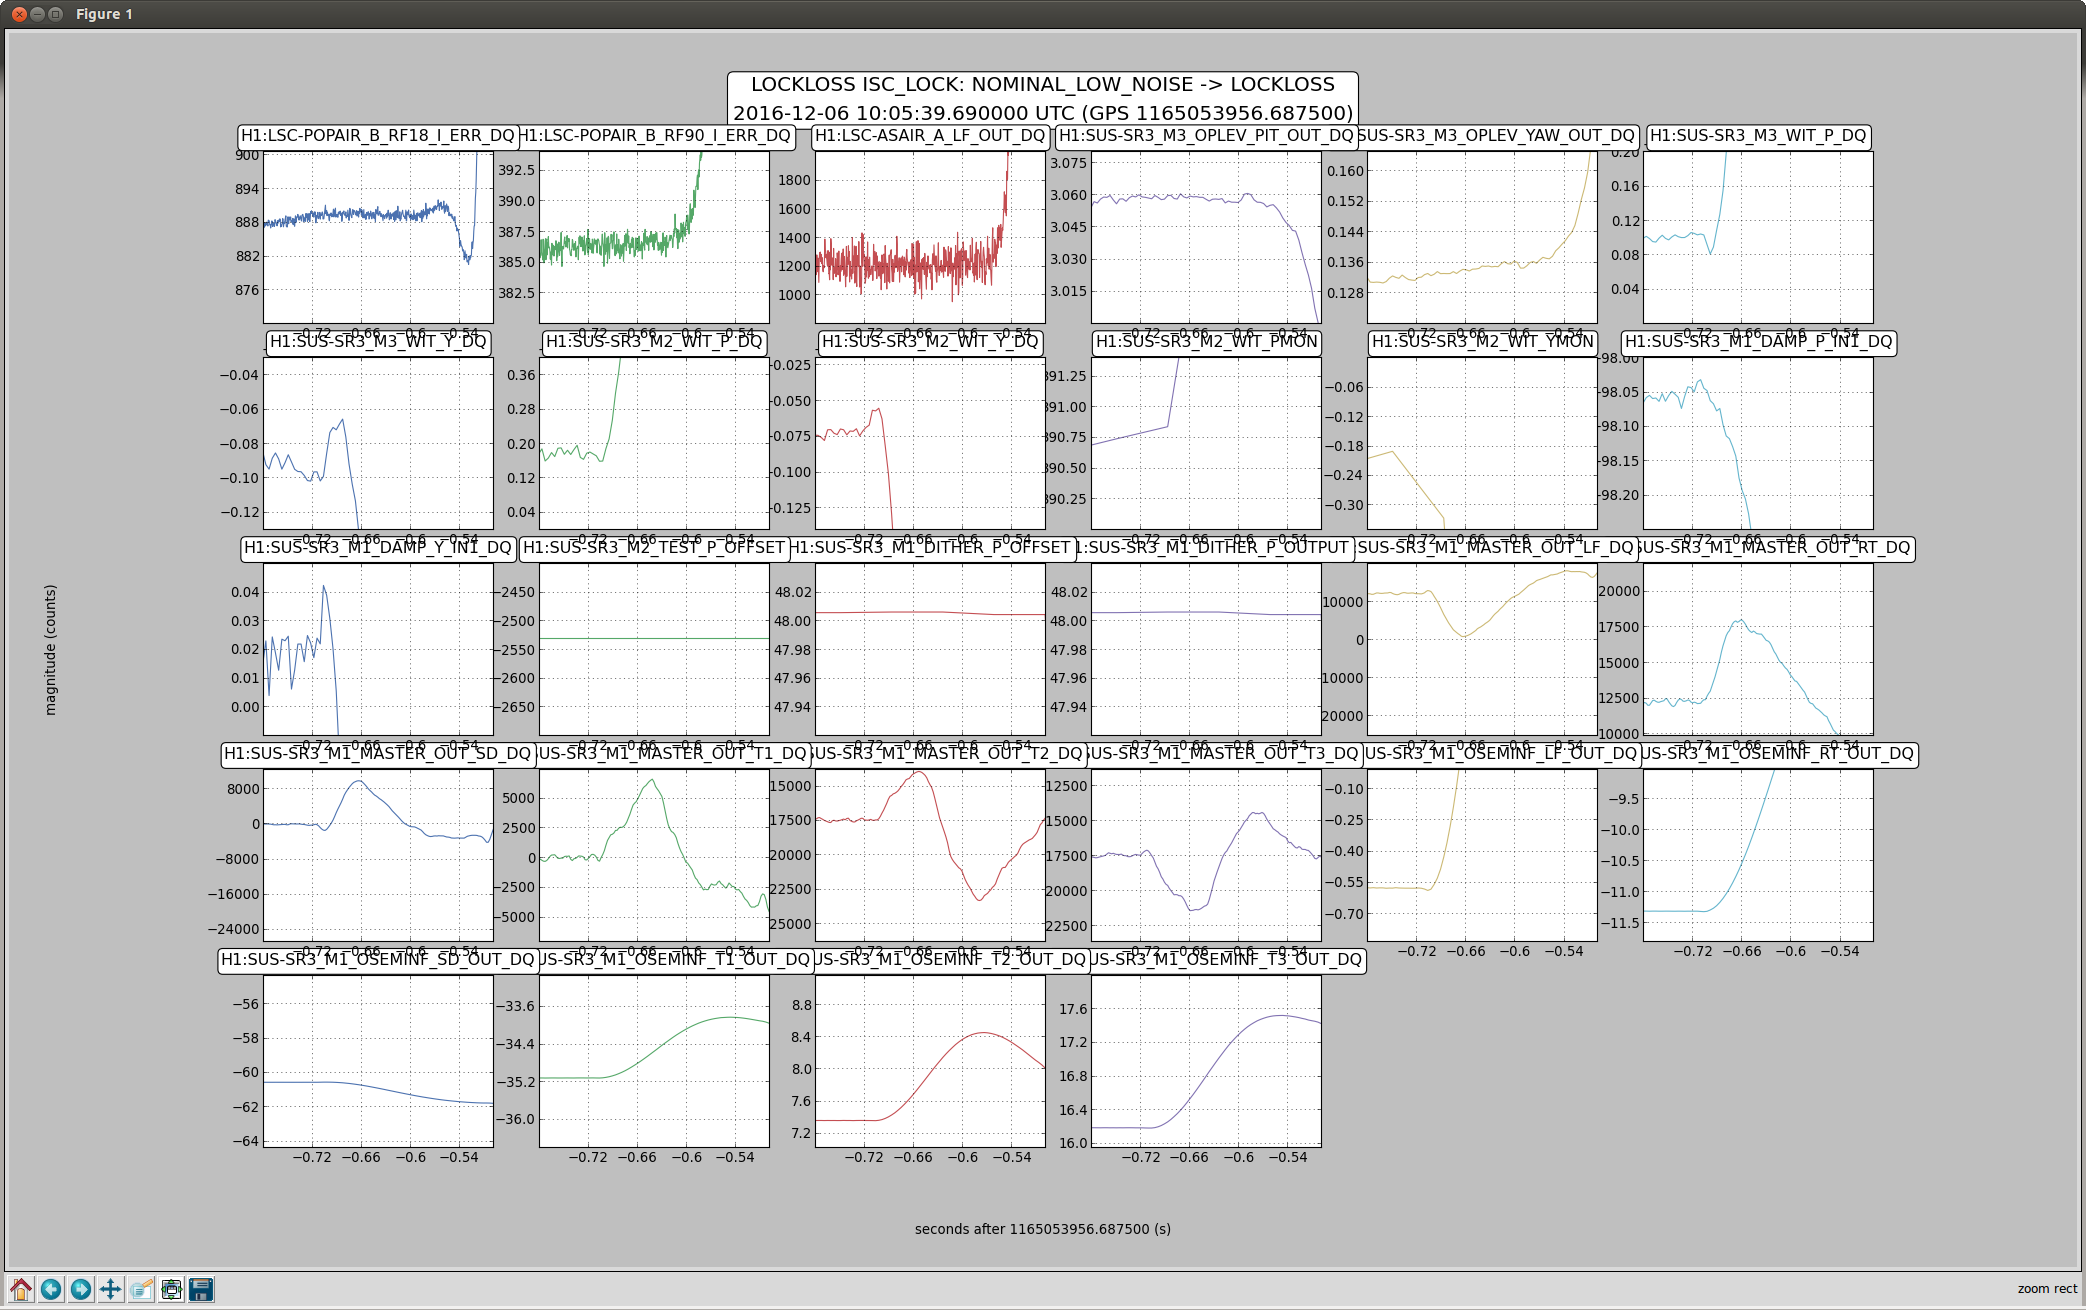