We did a final CO2 exploration at an input laser power of 25 W today. This was to fine-tune the CO2 settings that the operators have explored in the past weeks (31048, 30974).
-
Increasing the CO2X power improves 350 Hz and 610 Hz peaks while it makes noise worse at almost all other frequencies in 100-1000 Hz.
In the end I set the CO2X power back to 0.3 W (which was recently set 31246) which gave us the highest BNS range. Not sure if the addition of the IMC WFS offset (31246) changes the story here.
[The test]
The TCS test started at around 19:14 UTC today. The interferometer has been locked for more than 10 hours at that point with an input laser power of 25 W. The CO2 settings before the test was [CO2X, CO2Y] = [300 mW, 0 W]. This is something Sheila set during the weekend (31246). Here is an imcomplete list of time lines.
-
19:14 UTC (CO2X; 300 mW -> 600 mW) [REF0]
-
19:38 UTC (CO2X; 600mW -> 800 mW)
-
19:50 UTC [REF1]
-
20:20 UTC [REF2]
-
20:50 UTC [CO2X; 800 mW -> 500 mW]
-
20:56 UTC [CO2X; 500 mW -> 0]
-
21:10 UTC [REF3]
-
21:52 UTC (CO2X; 0 -> 300 mW)
-
22:00 [REF4 or live]
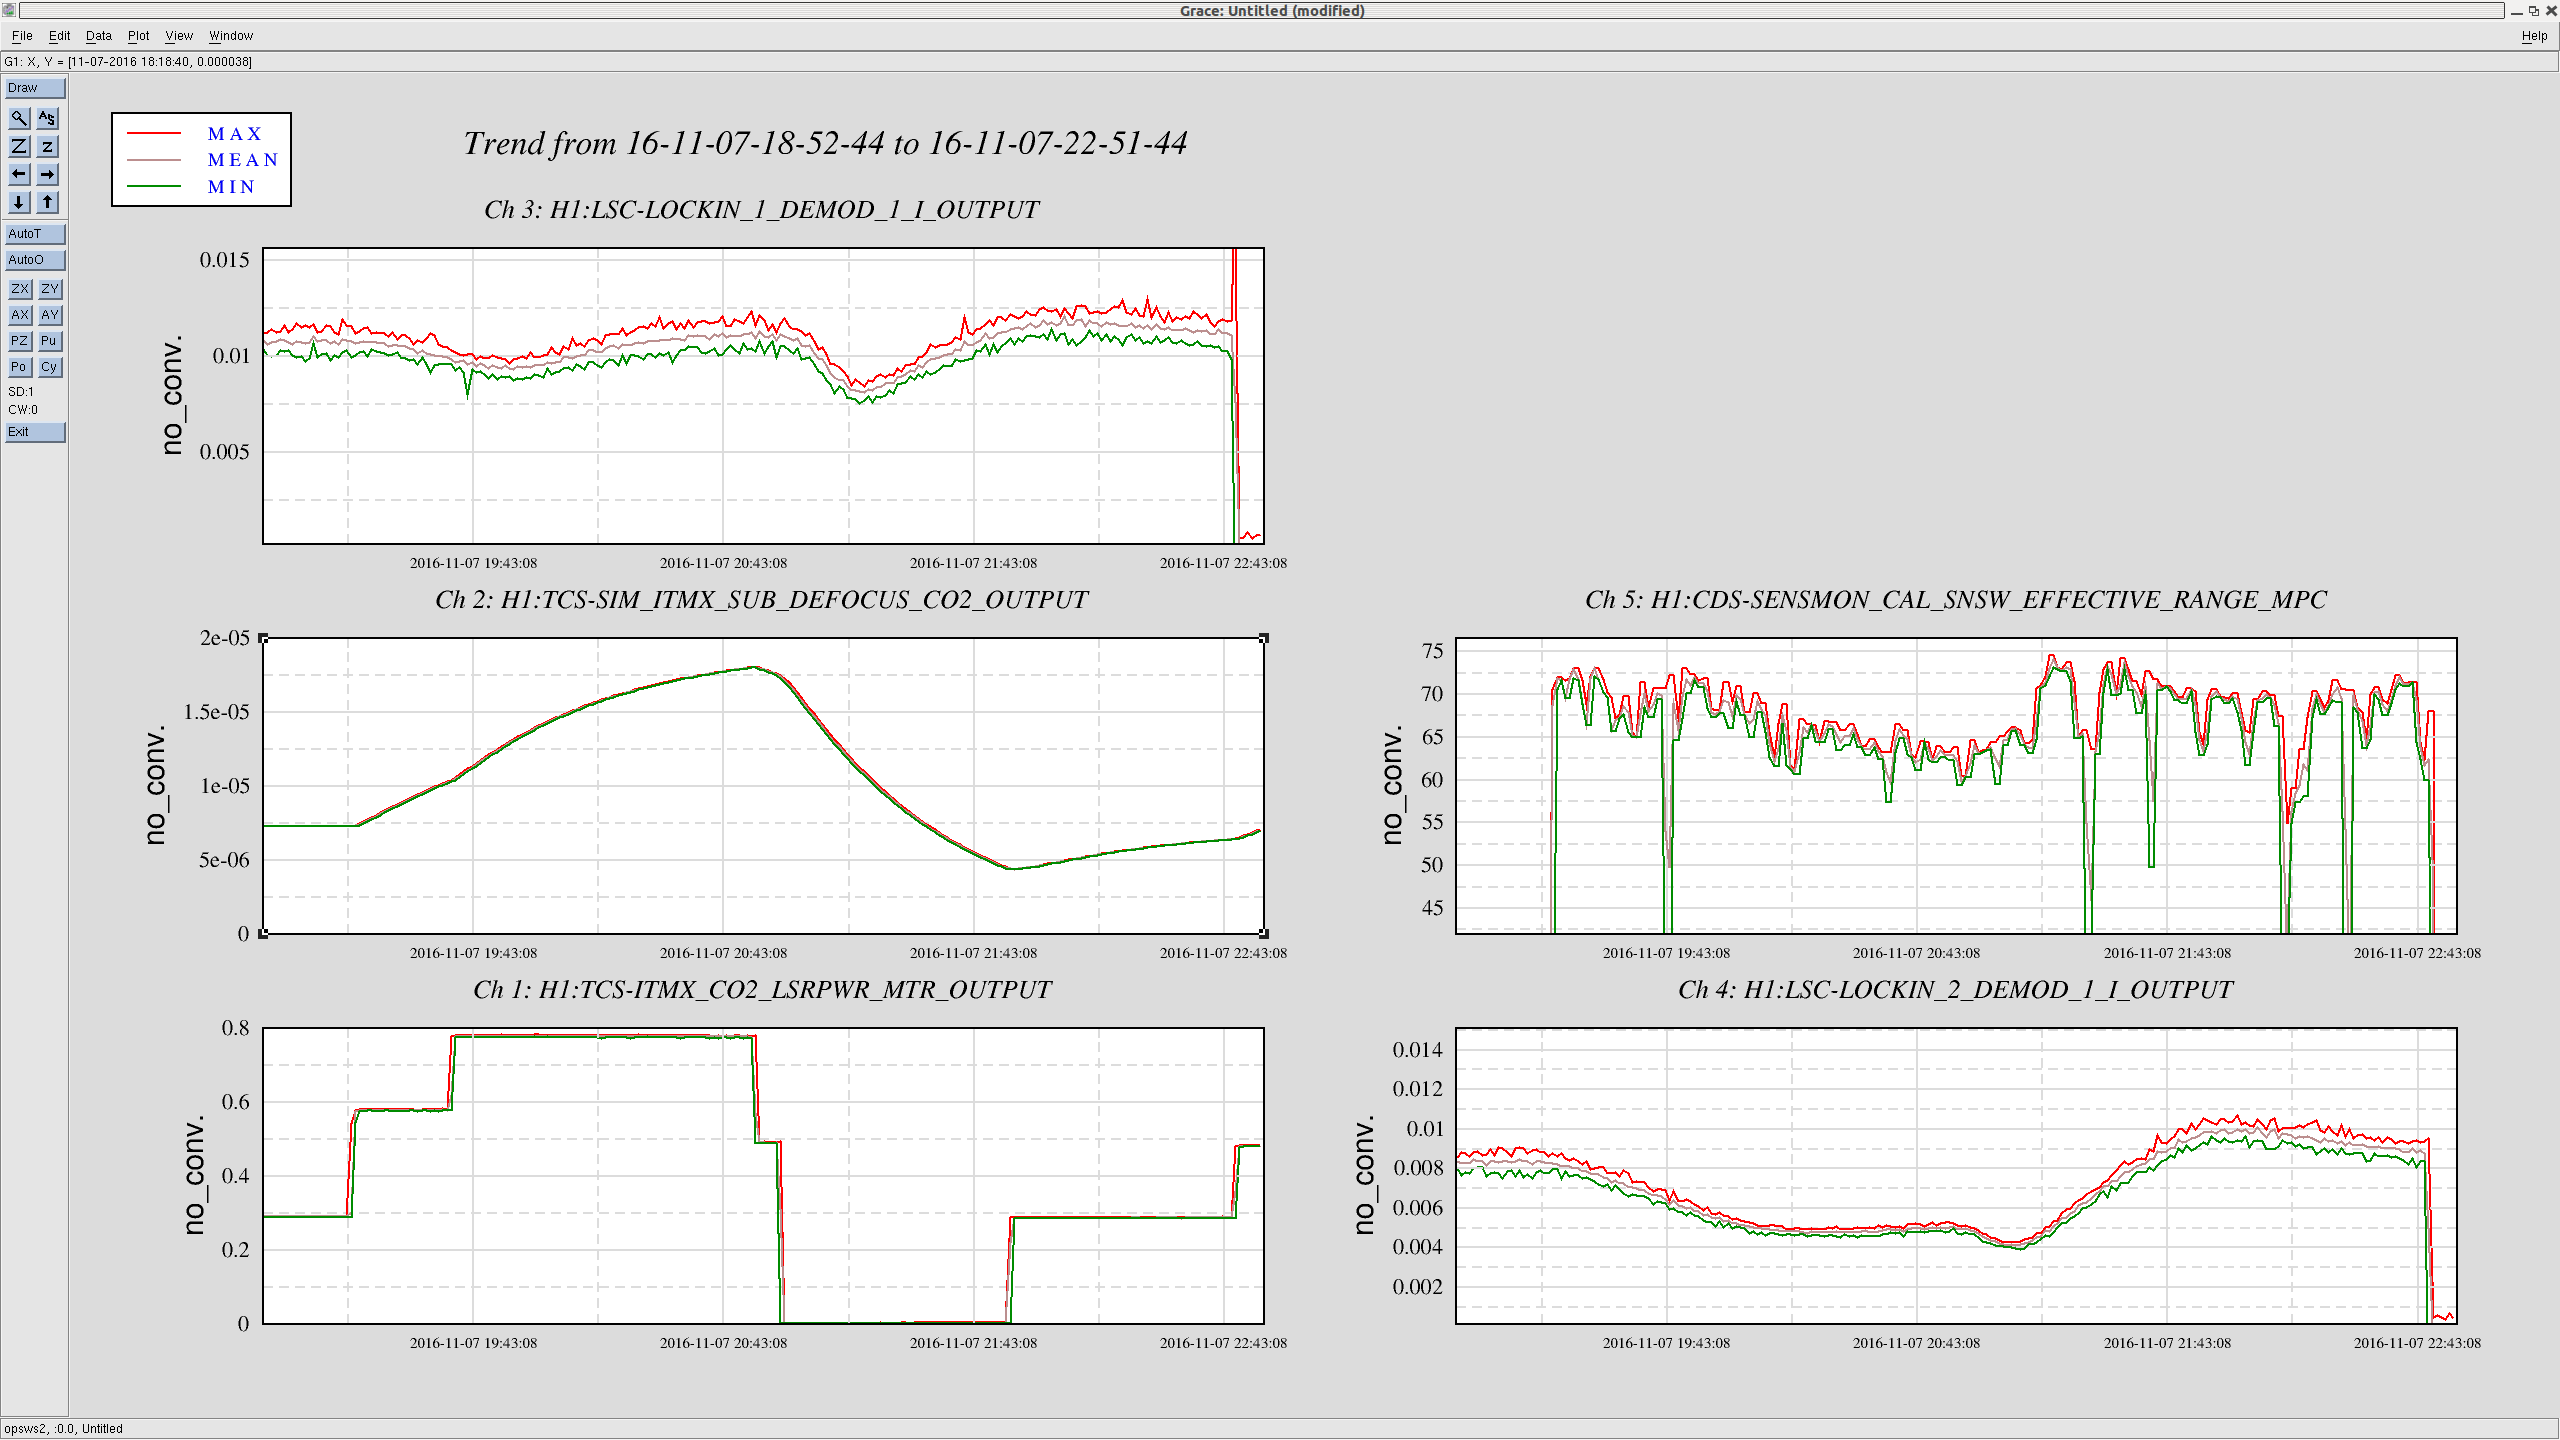
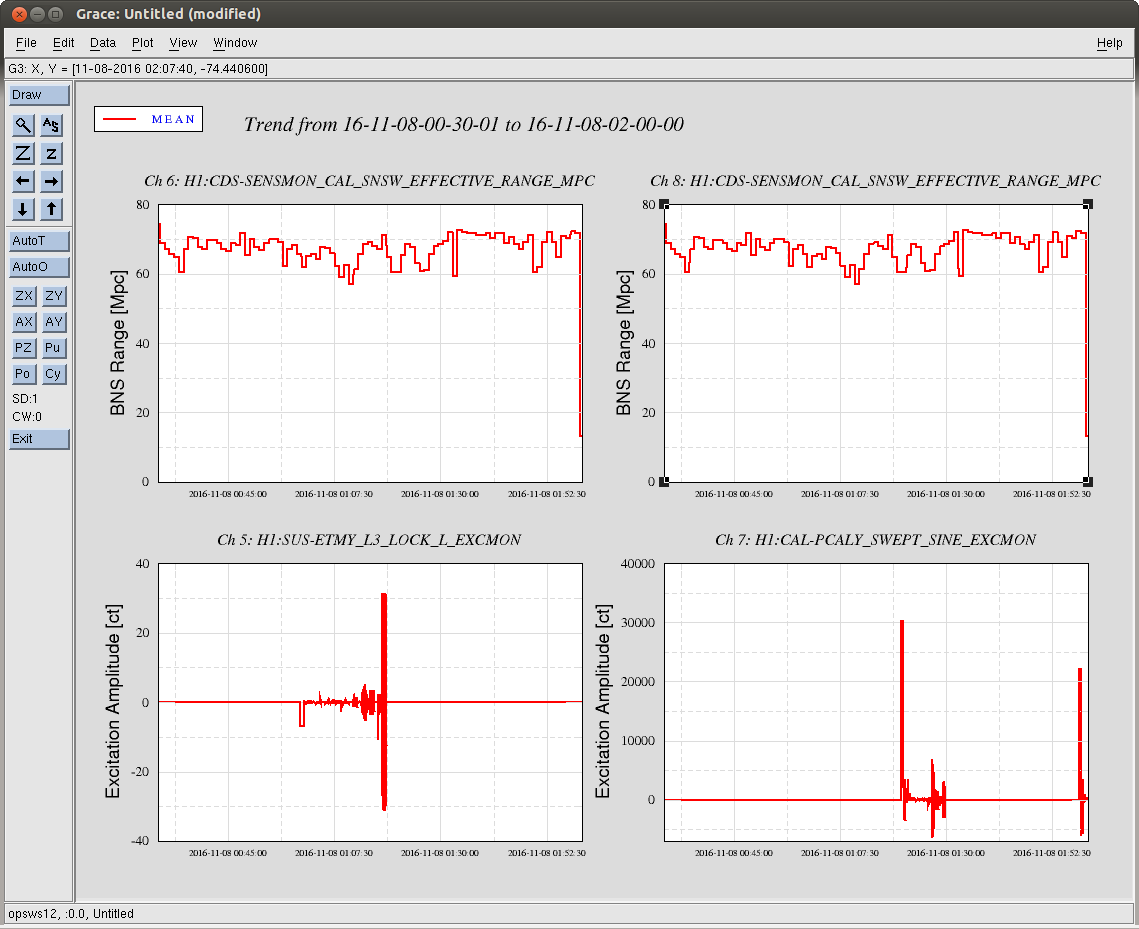
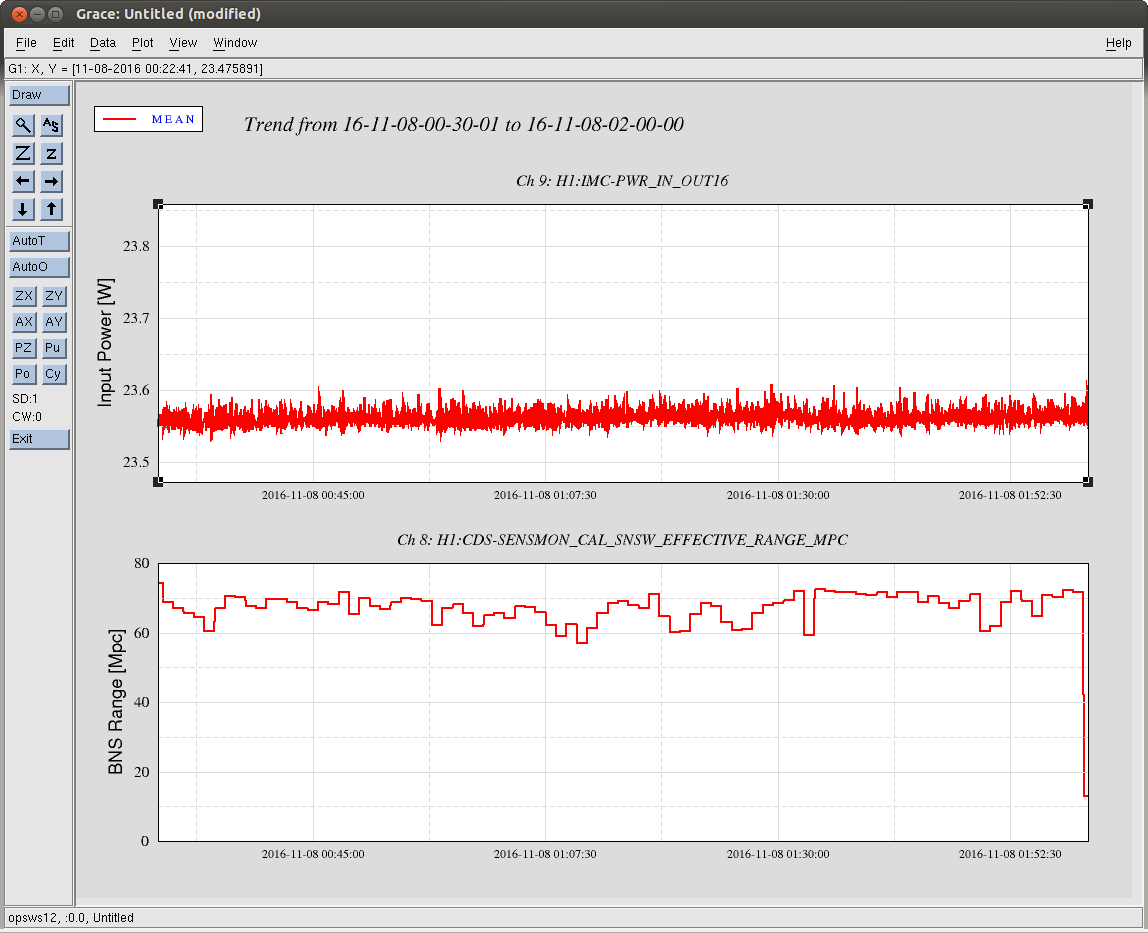
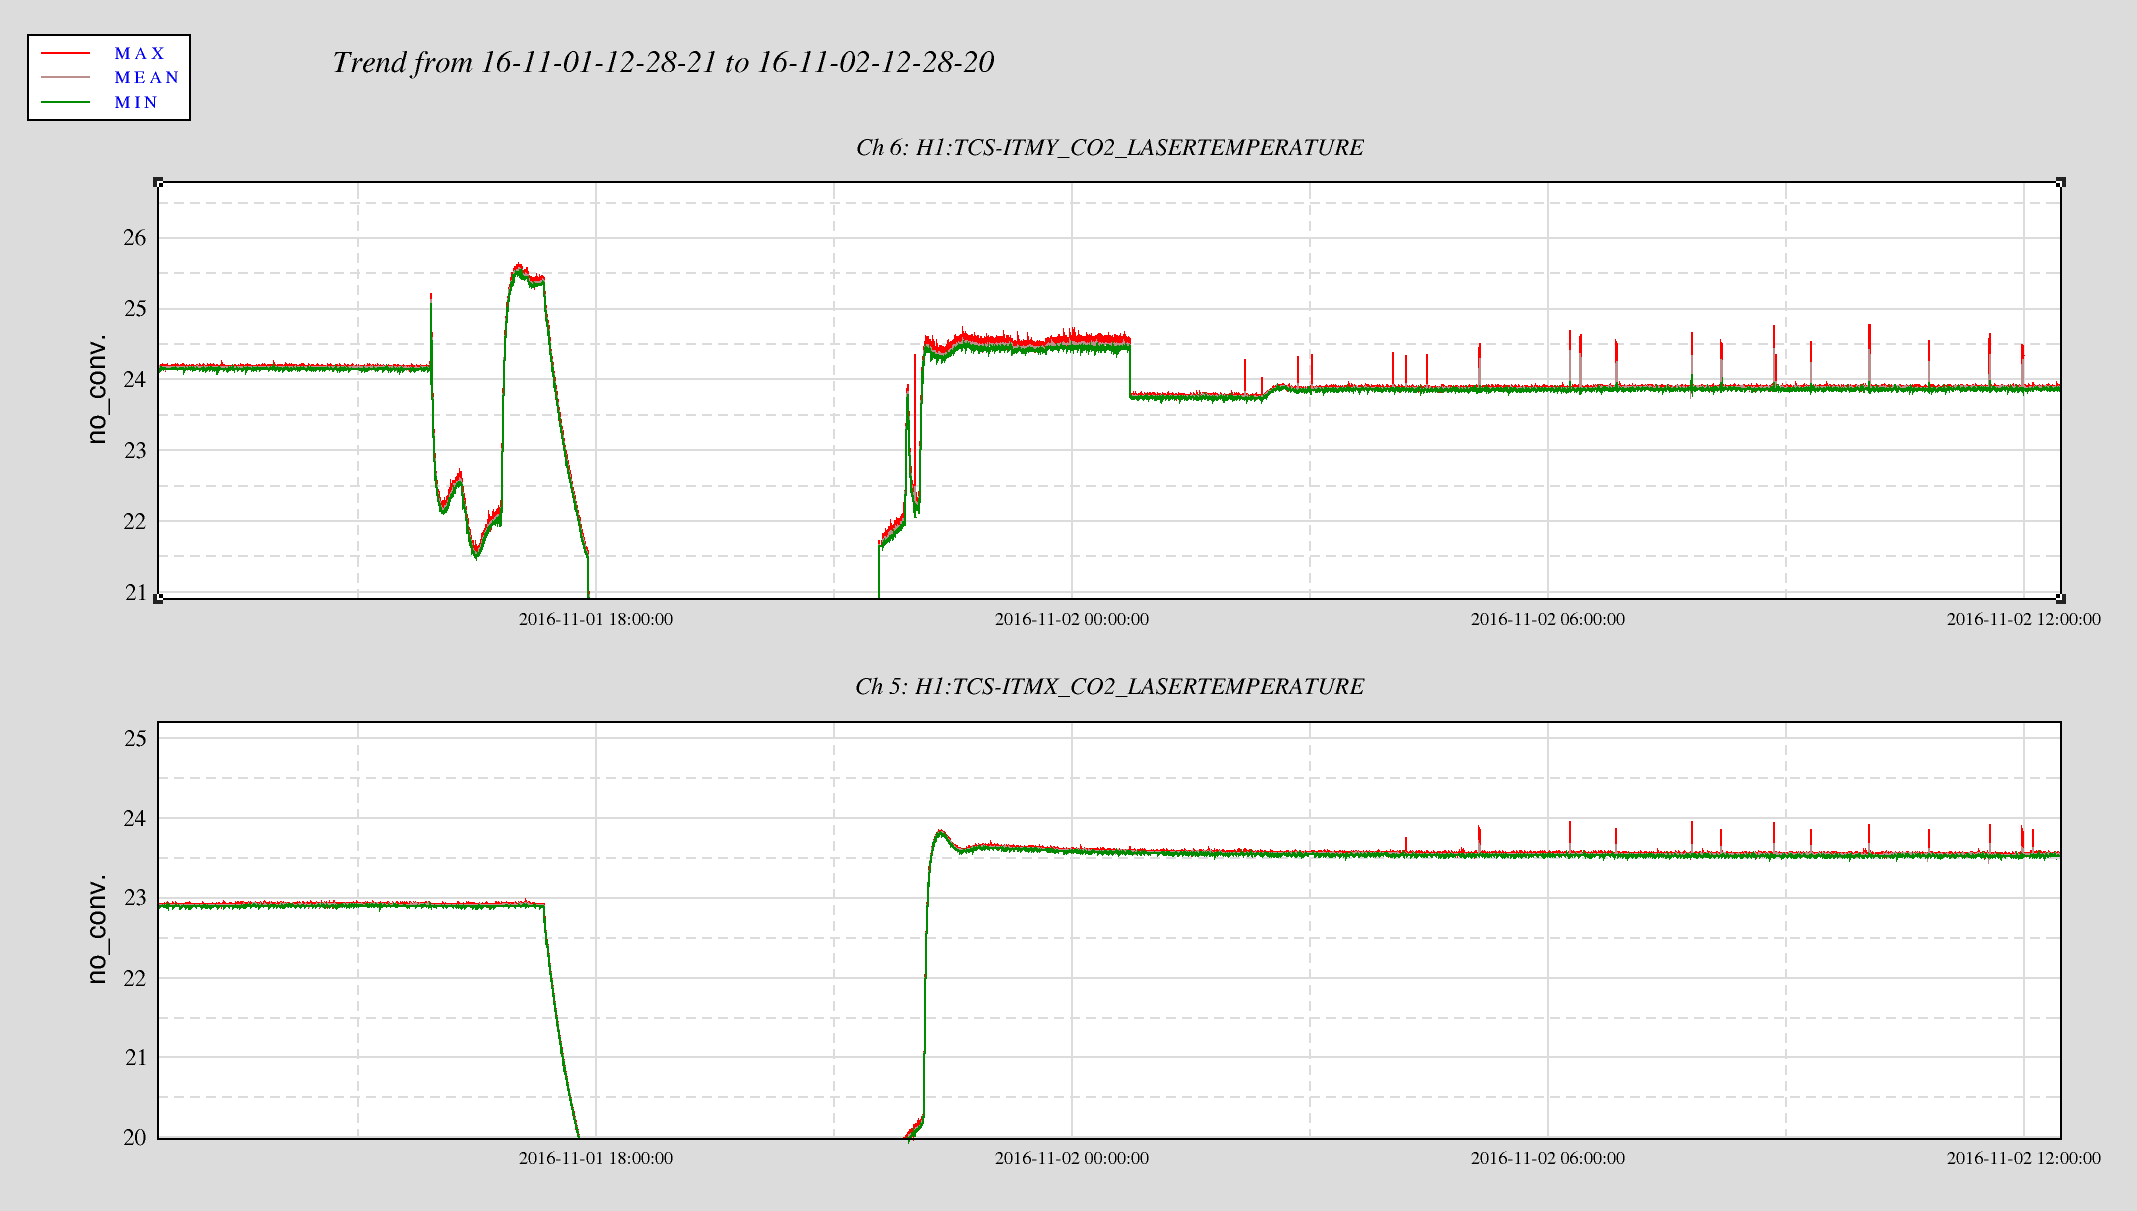
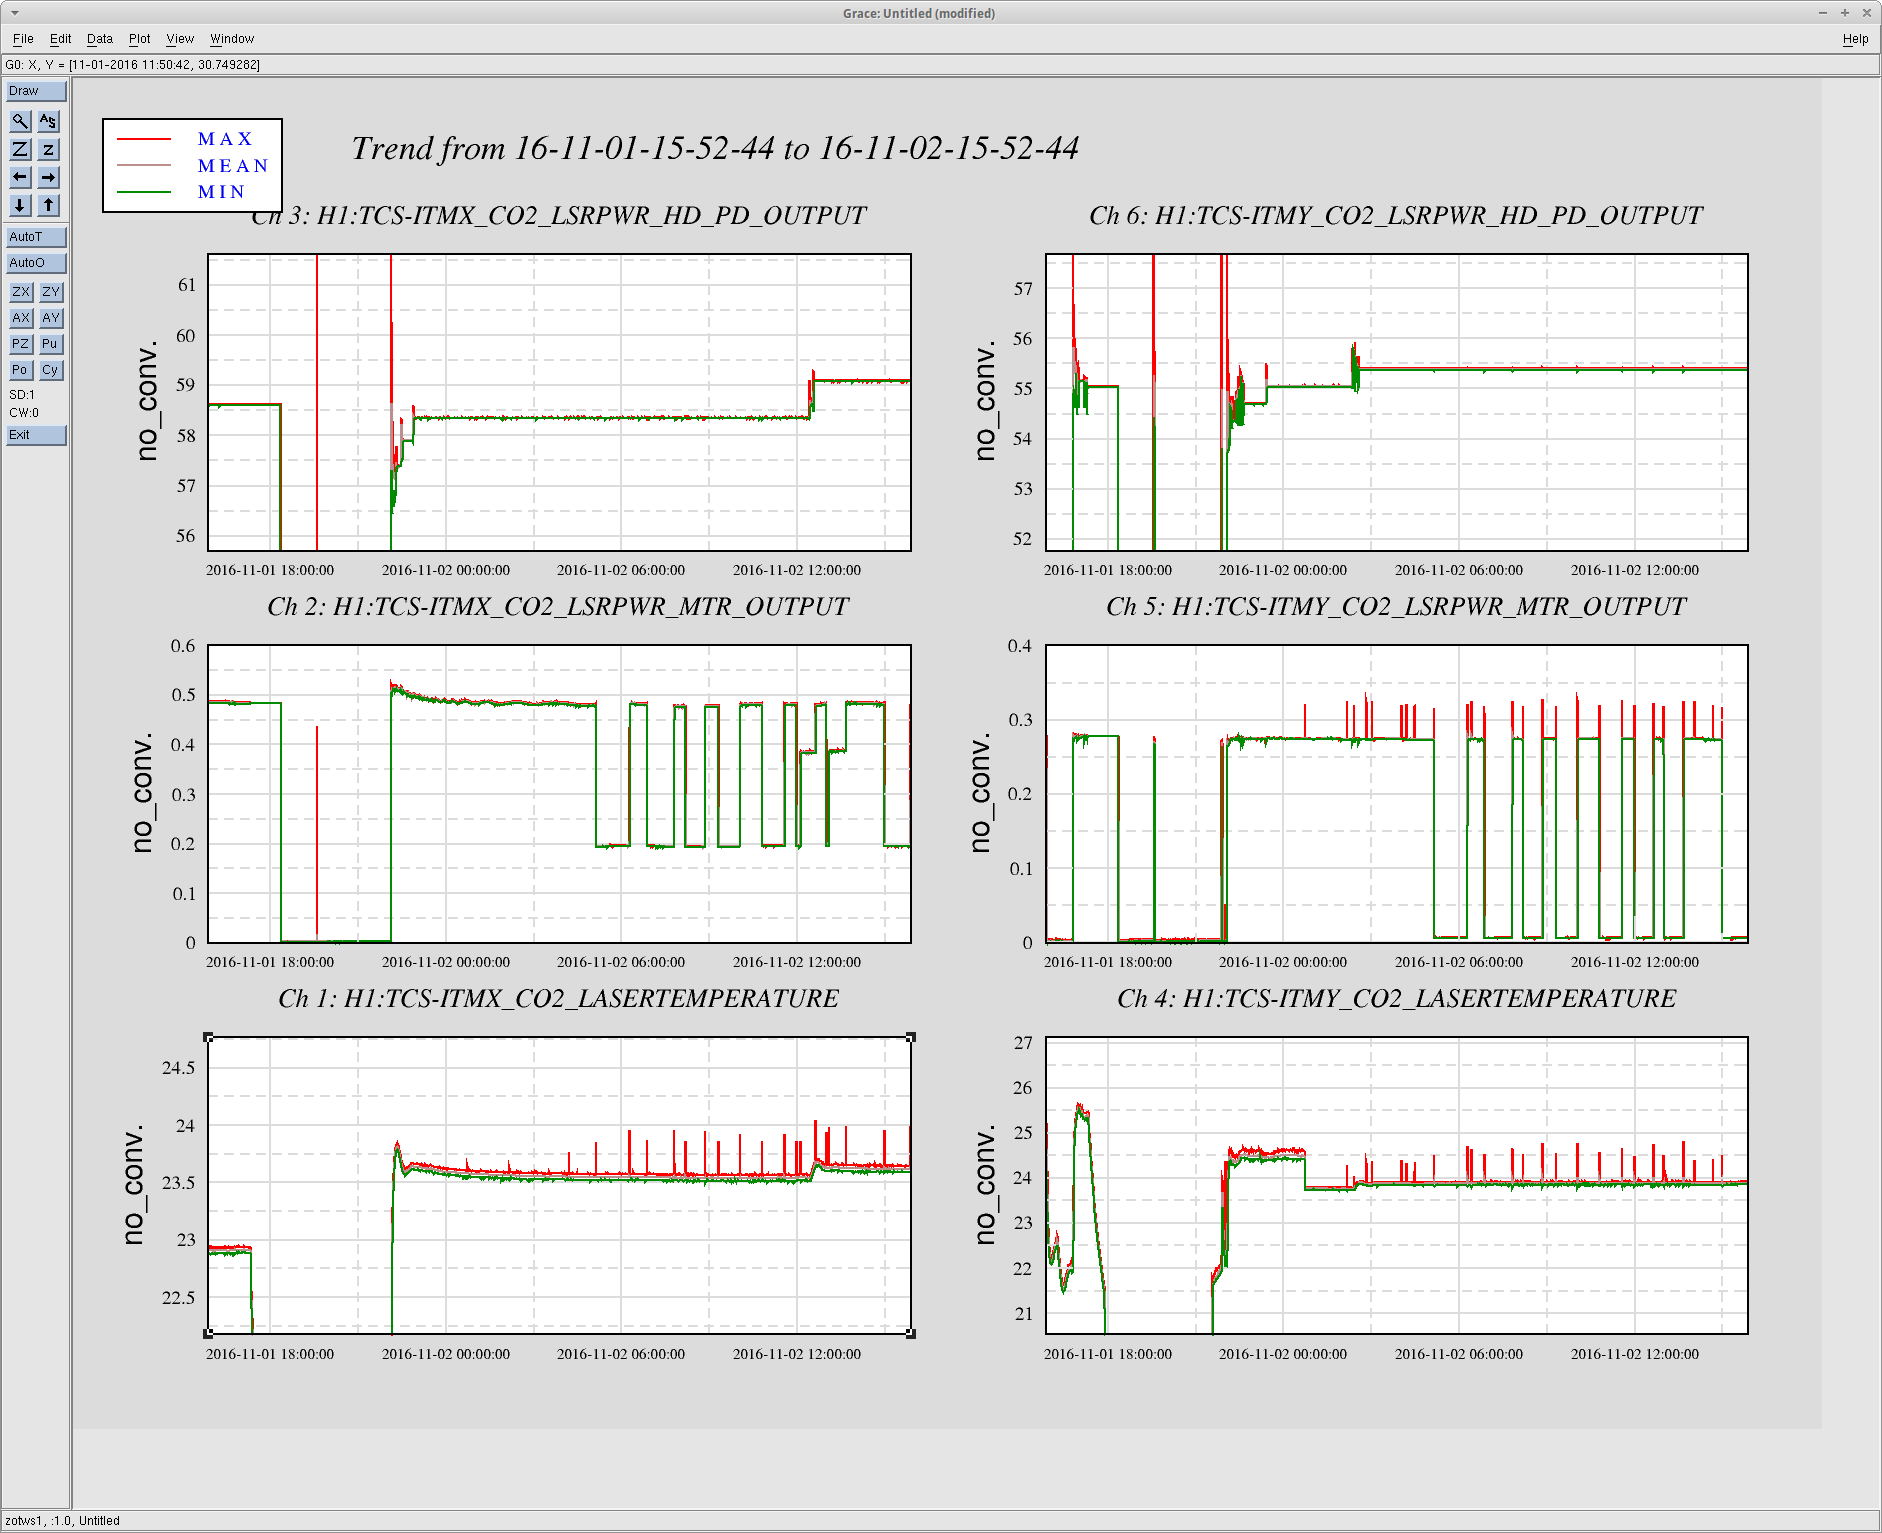
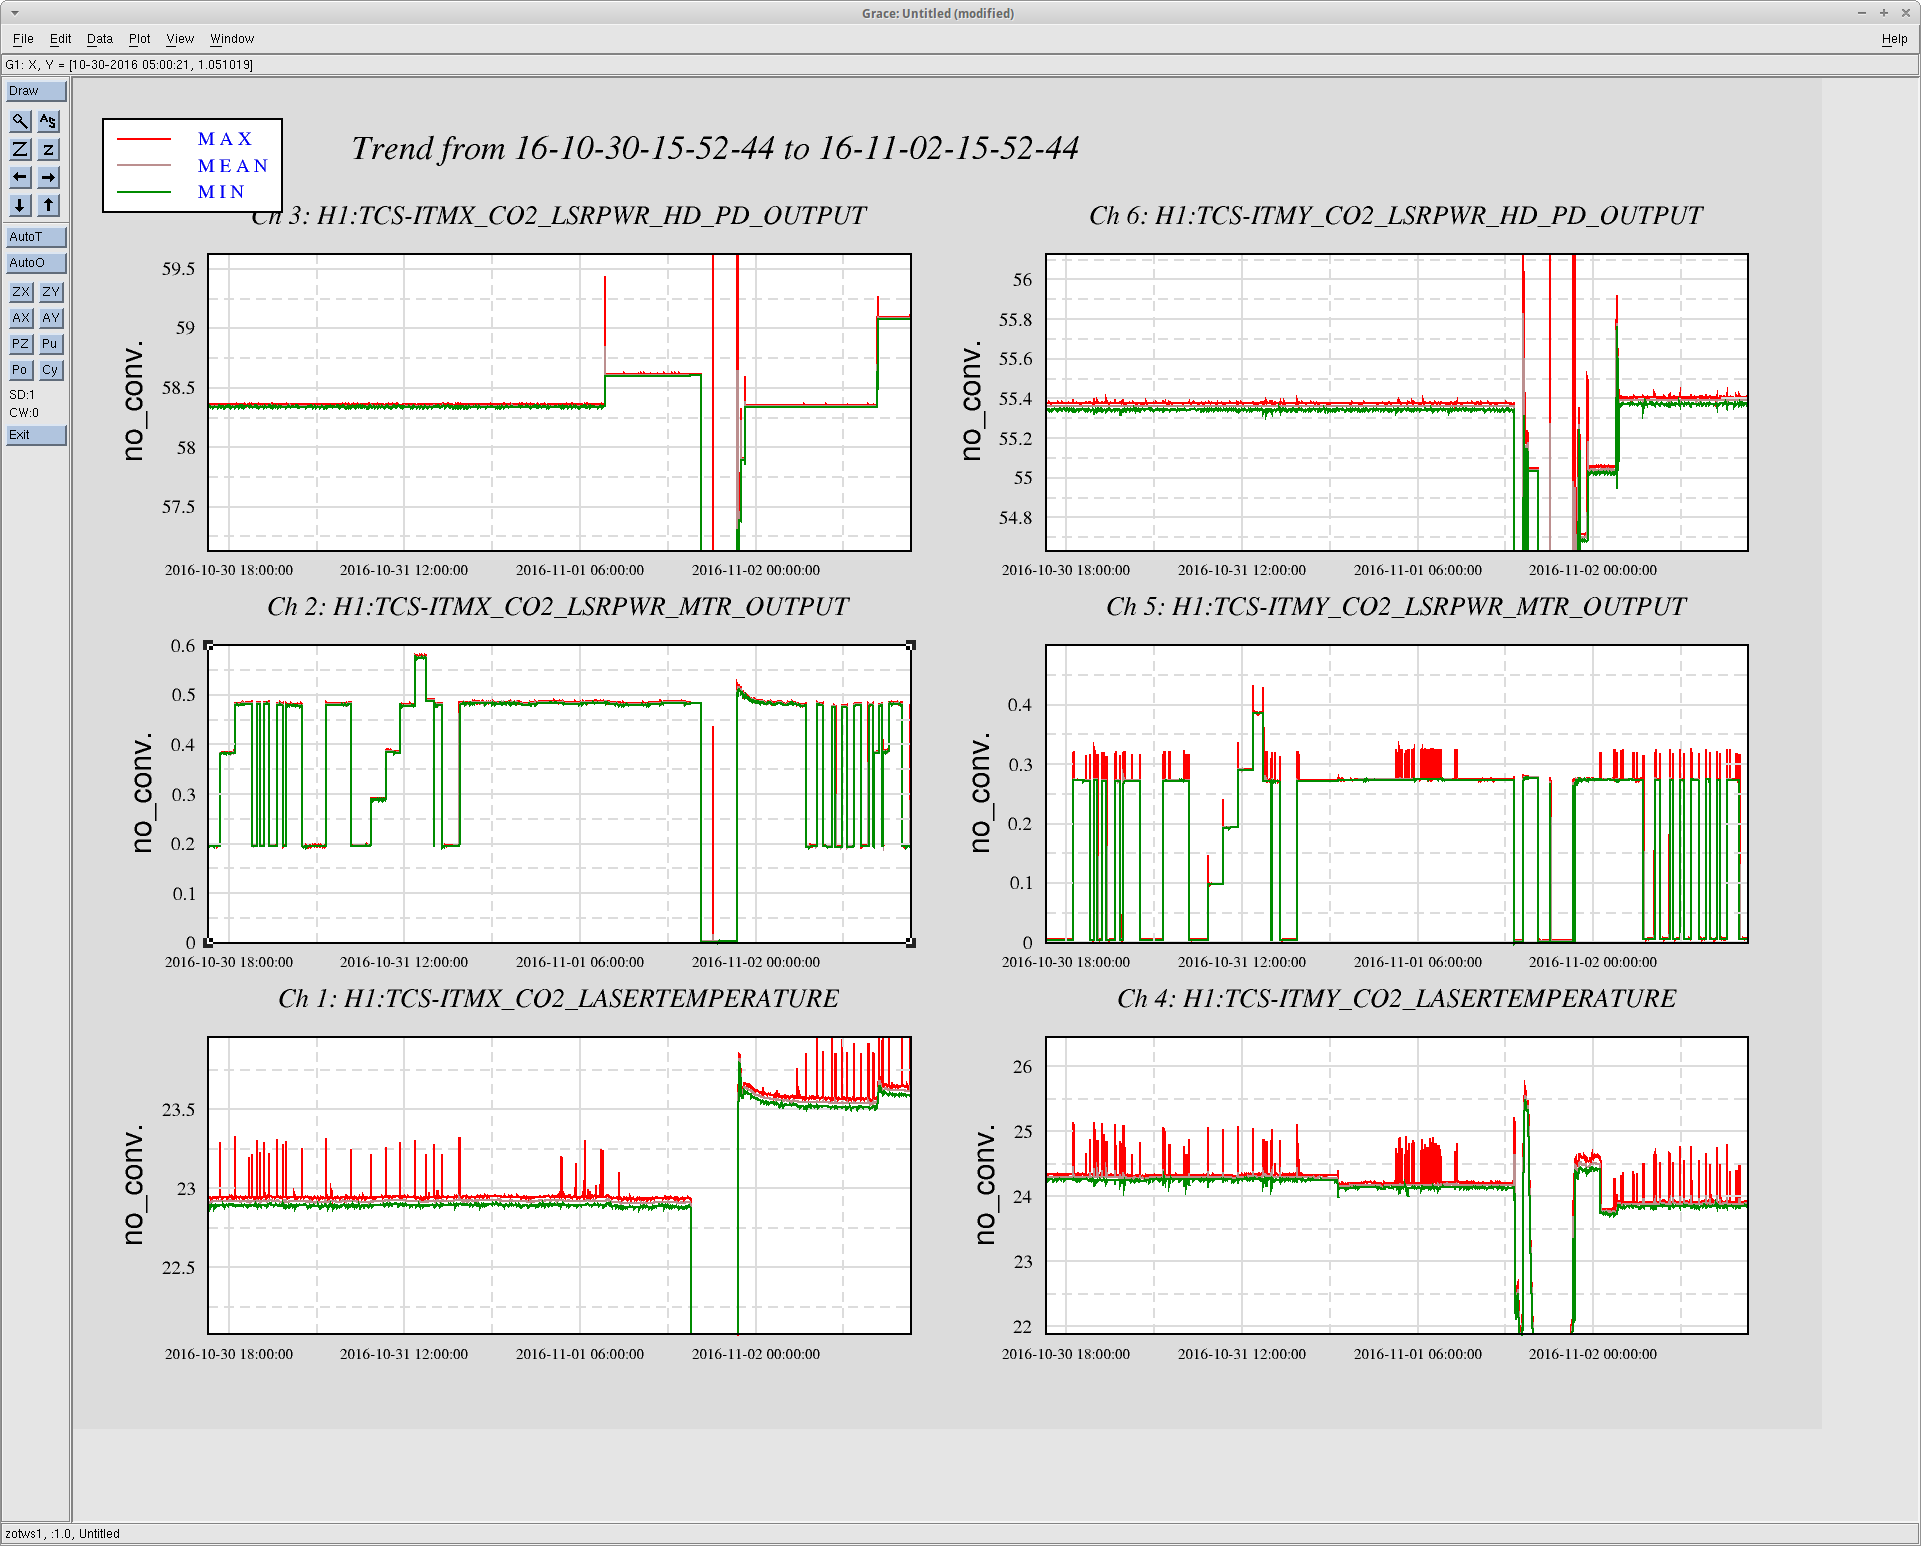
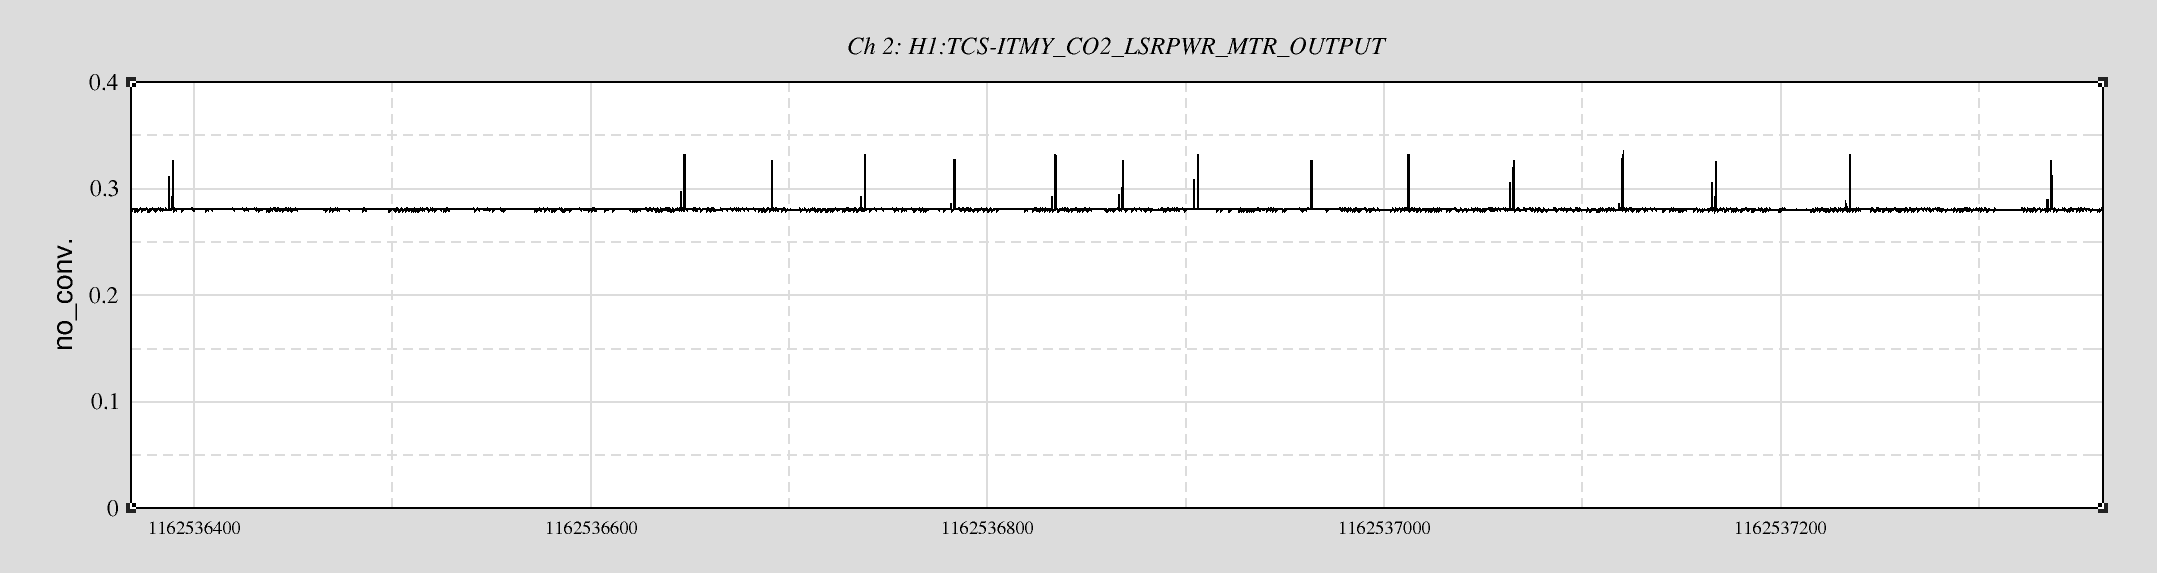
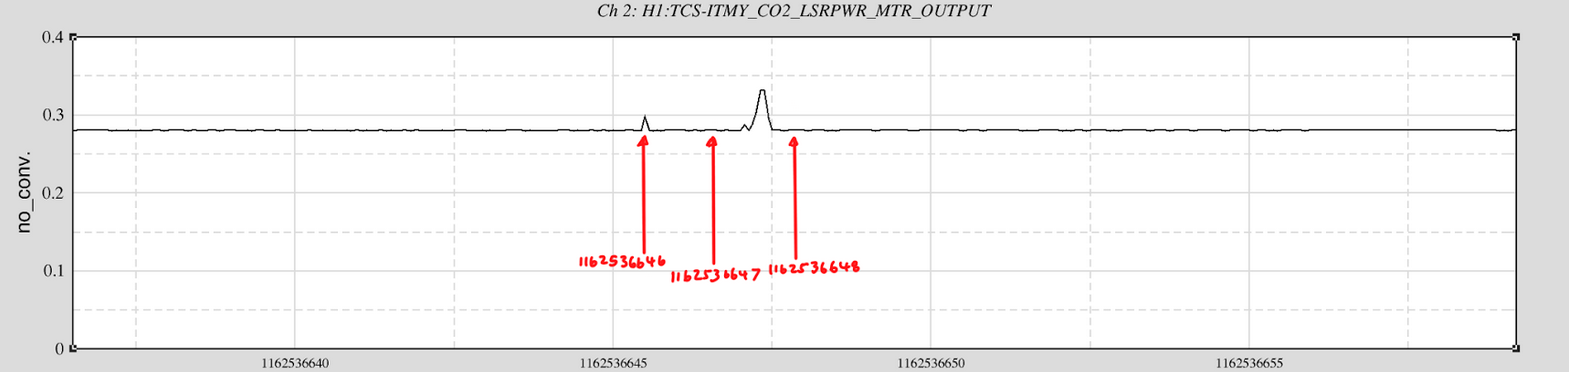
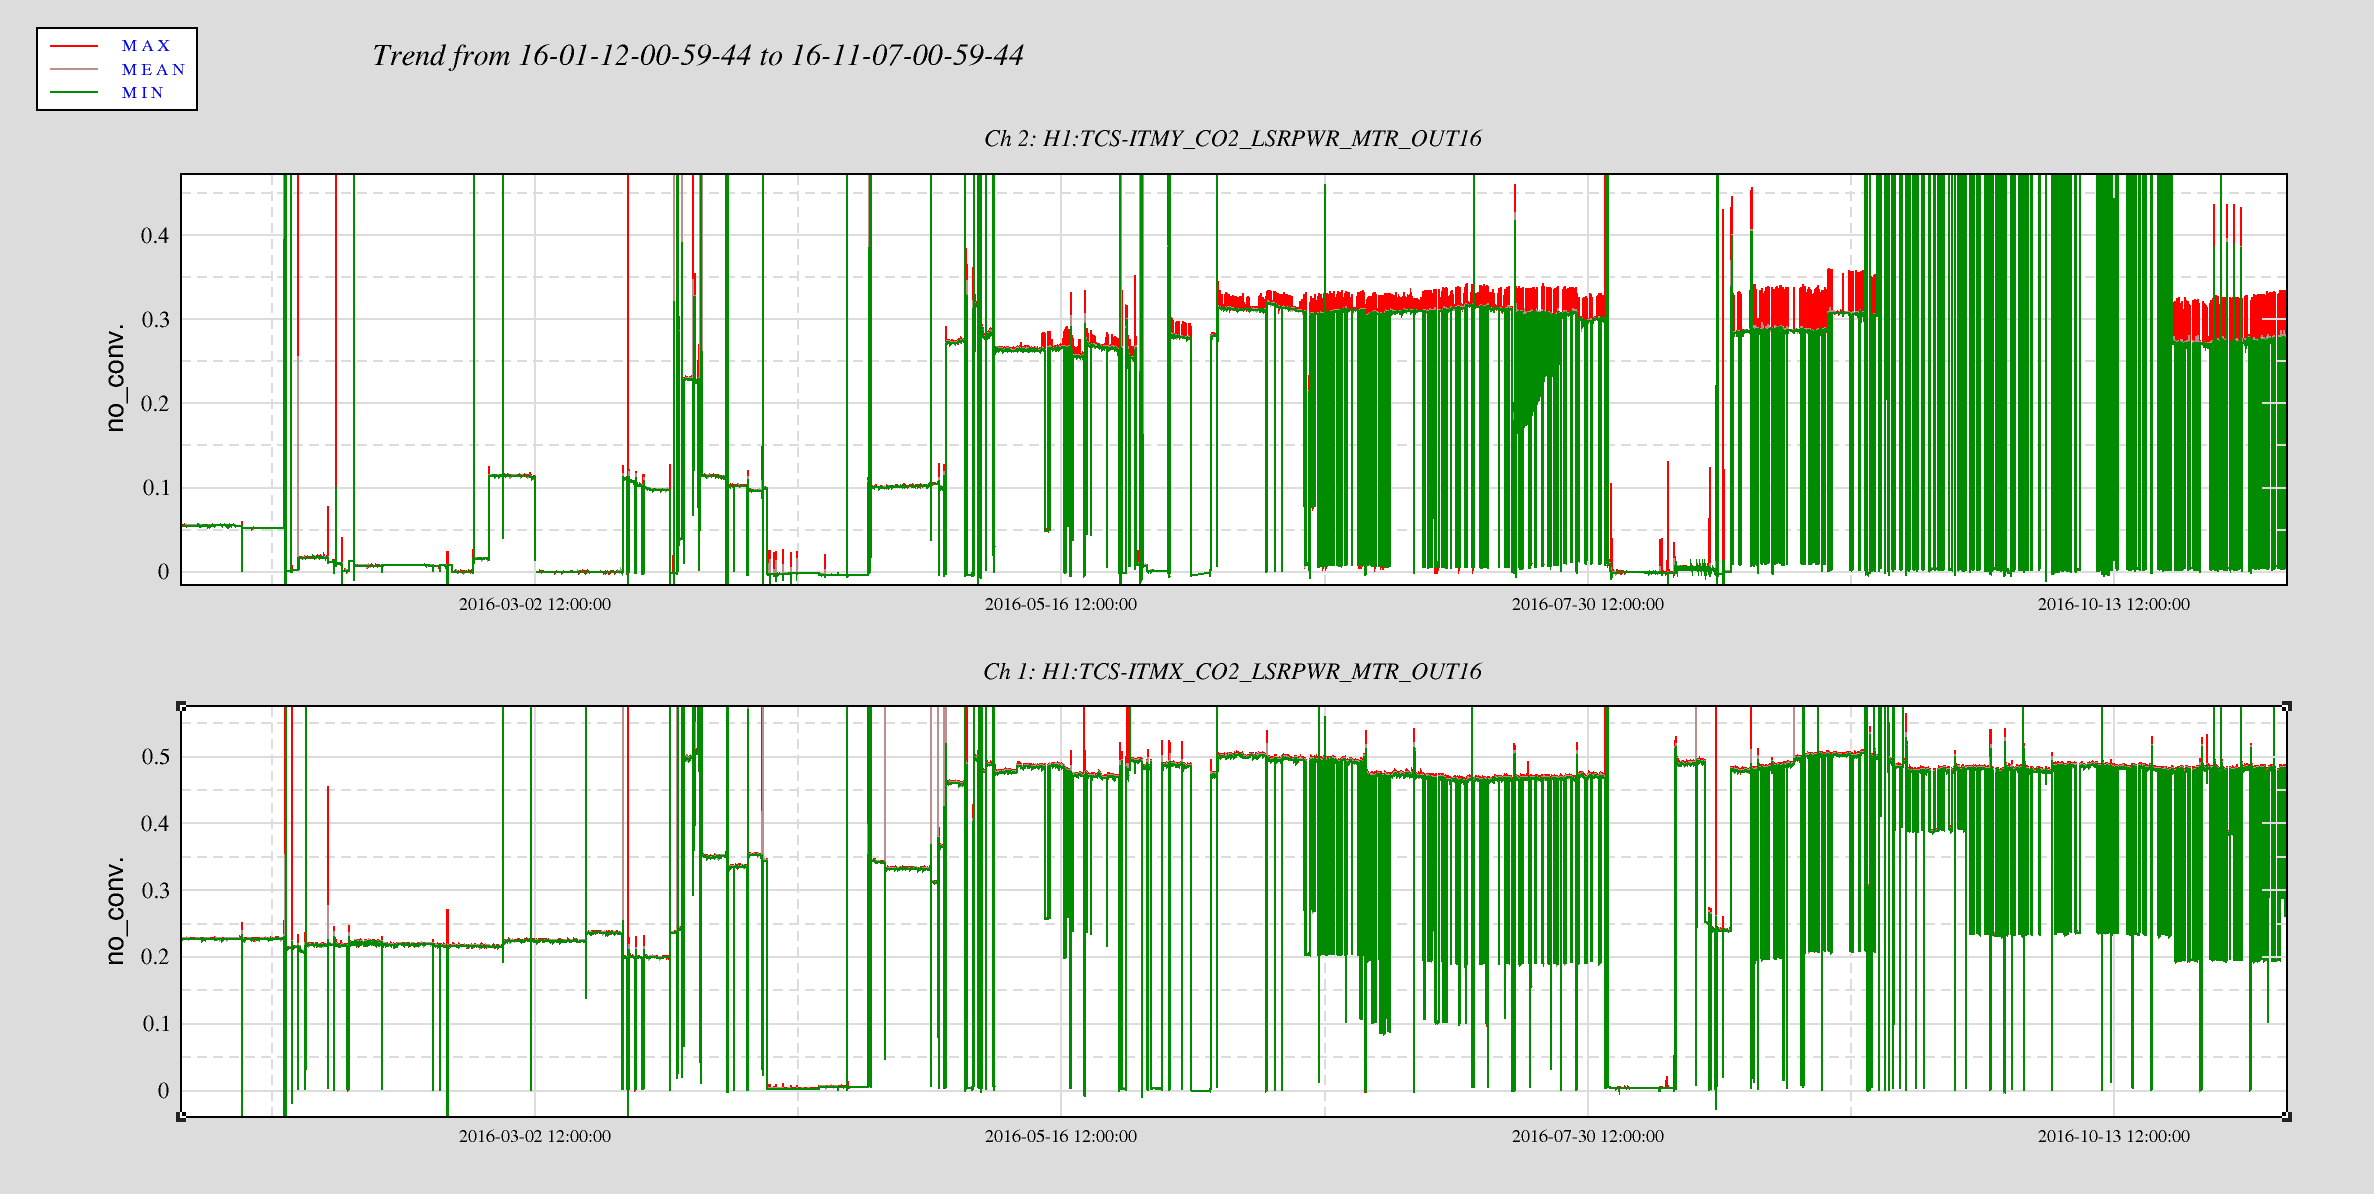
In the above list, the letters in the square brackets correspond to the labels in the dtt spectra shown below. A trend of this test are shown in the first attachment. LOCKINs 1 and 2 were monitoring the coupling transfer coefficients from the PSL periscope PZT to DARM for pitch and yaw, respectively. The pitch excitation was at 441.3 Hz and the yaw was at 421.1 Hz.
[The results]
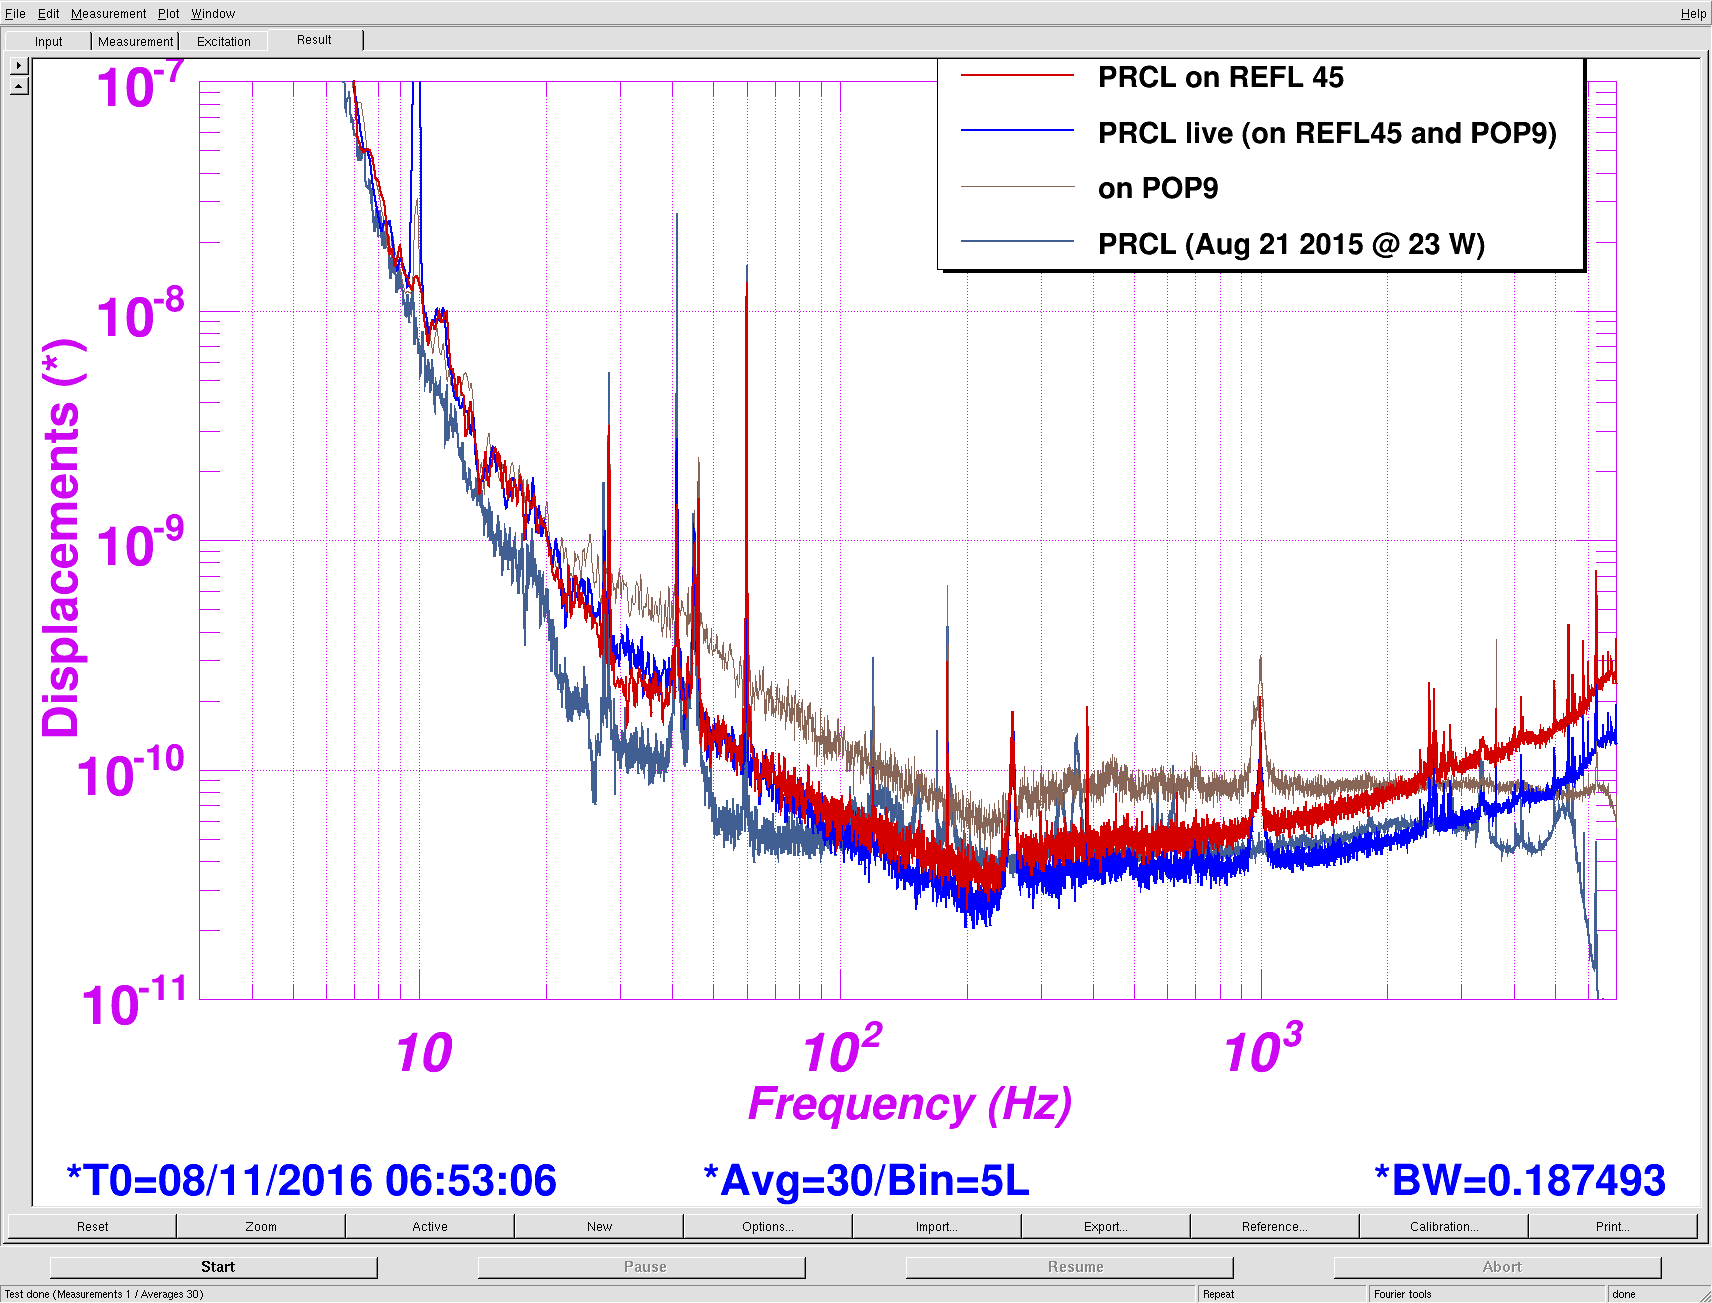
The DARM spectra from different times are shown below.
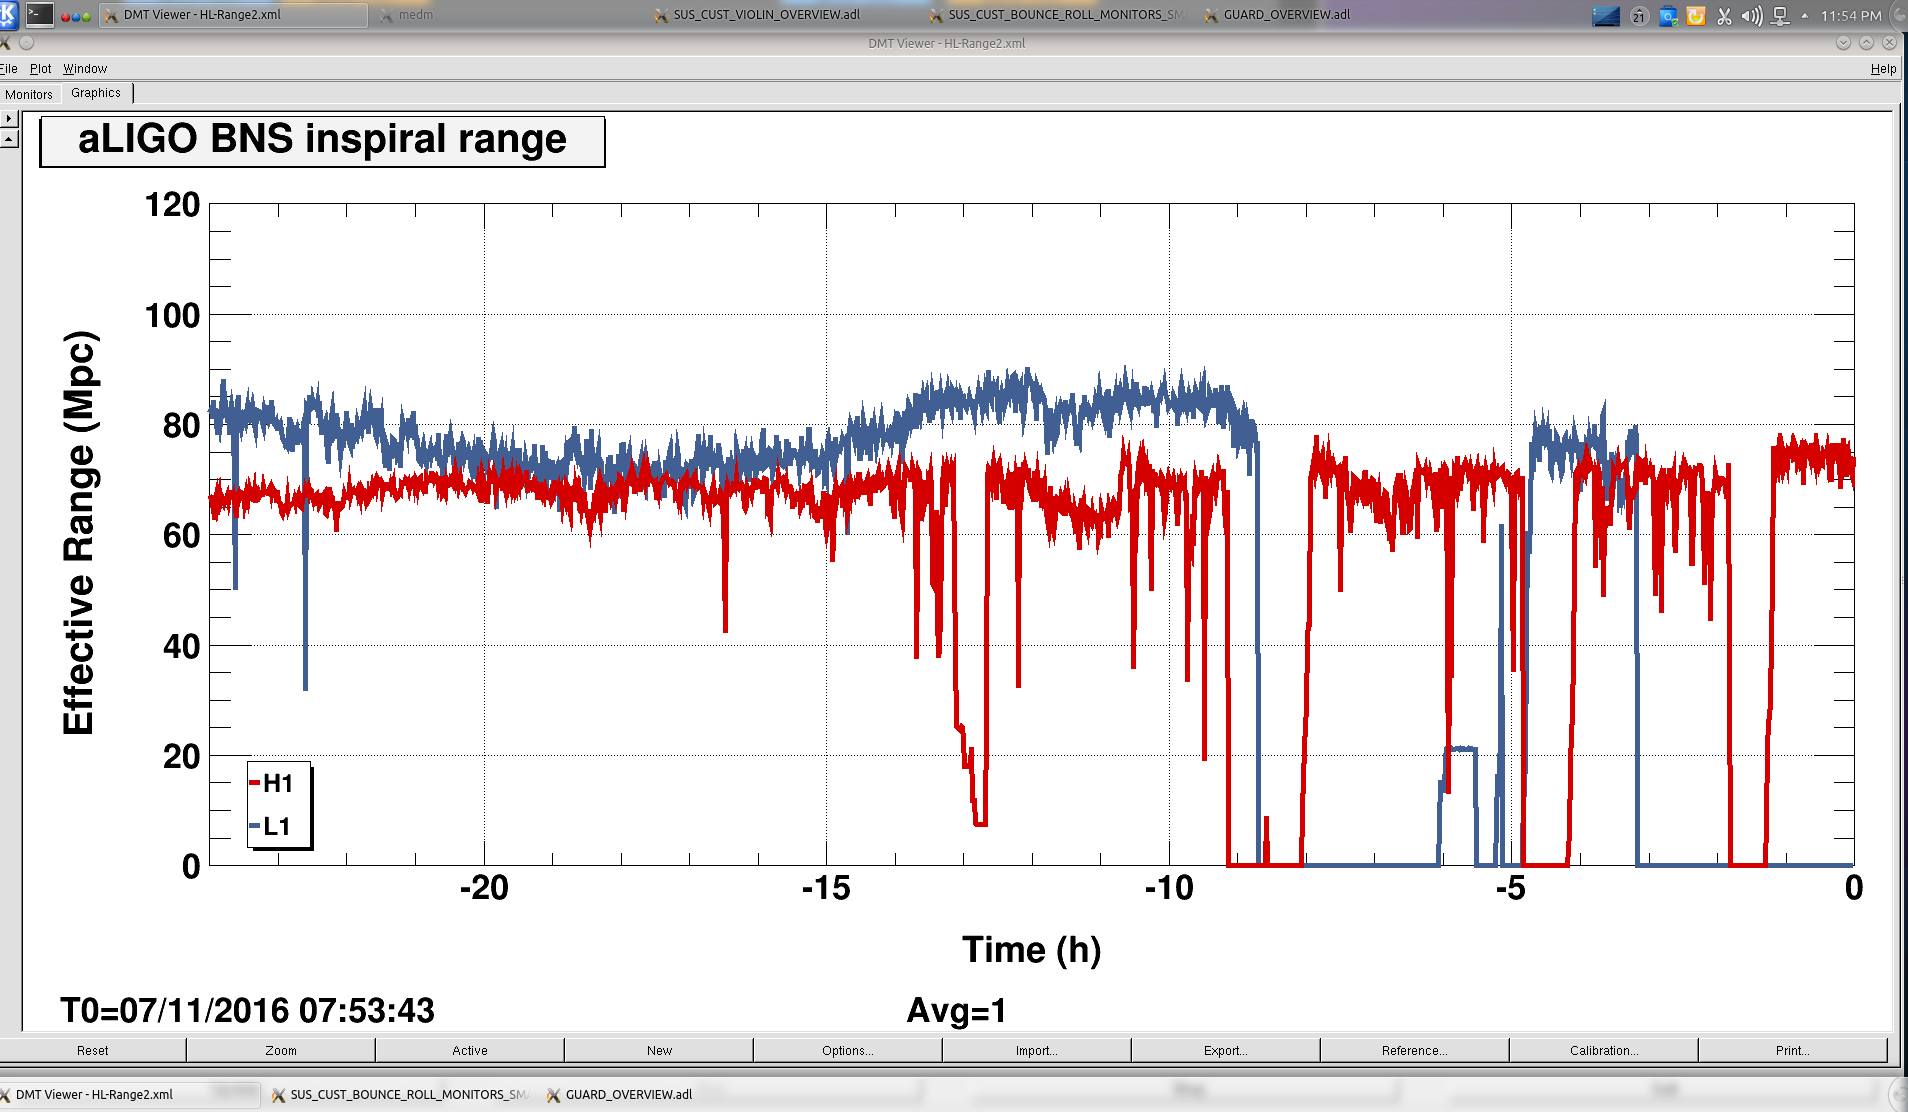
As the CO2X increased, noise around 350 Hz and 620 Hz decreased. This behavior is qualitatively consistent with what I have seen in the LOCKIN demodulators, especially the yaw coupling or LOCKIN2. However, obviously, this improvement came with higher noise elsewhere. In particular, the 260 Hz peak became quite noticeably worse by a factor of 3 at most. Also, the side lobe of the 1 kHz violin modes became significantly worse too by a factor of roughly 2. This time, I did not check laser noise couplings (intensity or frequency) simultaneously. According to the sensmon shown in the first attachment, increasing CO2X decreased the BNS range by 5 Mpc or so. The DARM spectrum below 100 Hz seems to have stayed the same throughout the test.