We've been struggling to switch from POP X to REFL WFS, probably because with our low recycling gain we are near the point where the REFL WFS have a sign flip for PR3. However, we know that we get bad scattered light coupling to DARM from ISCT1 if we leave the beam diverters open, so it would be good to switch to REFL WFS. TOday and last night we tried improving the recycling gain by changing the spot position on PR3, which makes the broad lump of noise from 200-1kHz come back. We also have reduced range which is probably because the SRCL coupling changes and we need to update the feedforward. I am hoping that we can see that the interferometer is stable in this configuration, and that we can get the range back to 75Mpc by retuning the FF if we get a long lock to measure the transfer function. In that case we will have to decide if we are more bothered by jitter or the scattered light, or try jitter subtraction or TCS to help with the jitter.
One wrinkle in this is that the REFL WFS centering for yaw seems to go unstable, probably because it is cross coupled with some of our ASC loops. If you are an optimist you will believe this was actually the problem with the REFL WFS not the changing matrix, and that we can just go back to our low jiter/ low recycling gain alignment.
Move PR3 spot position:
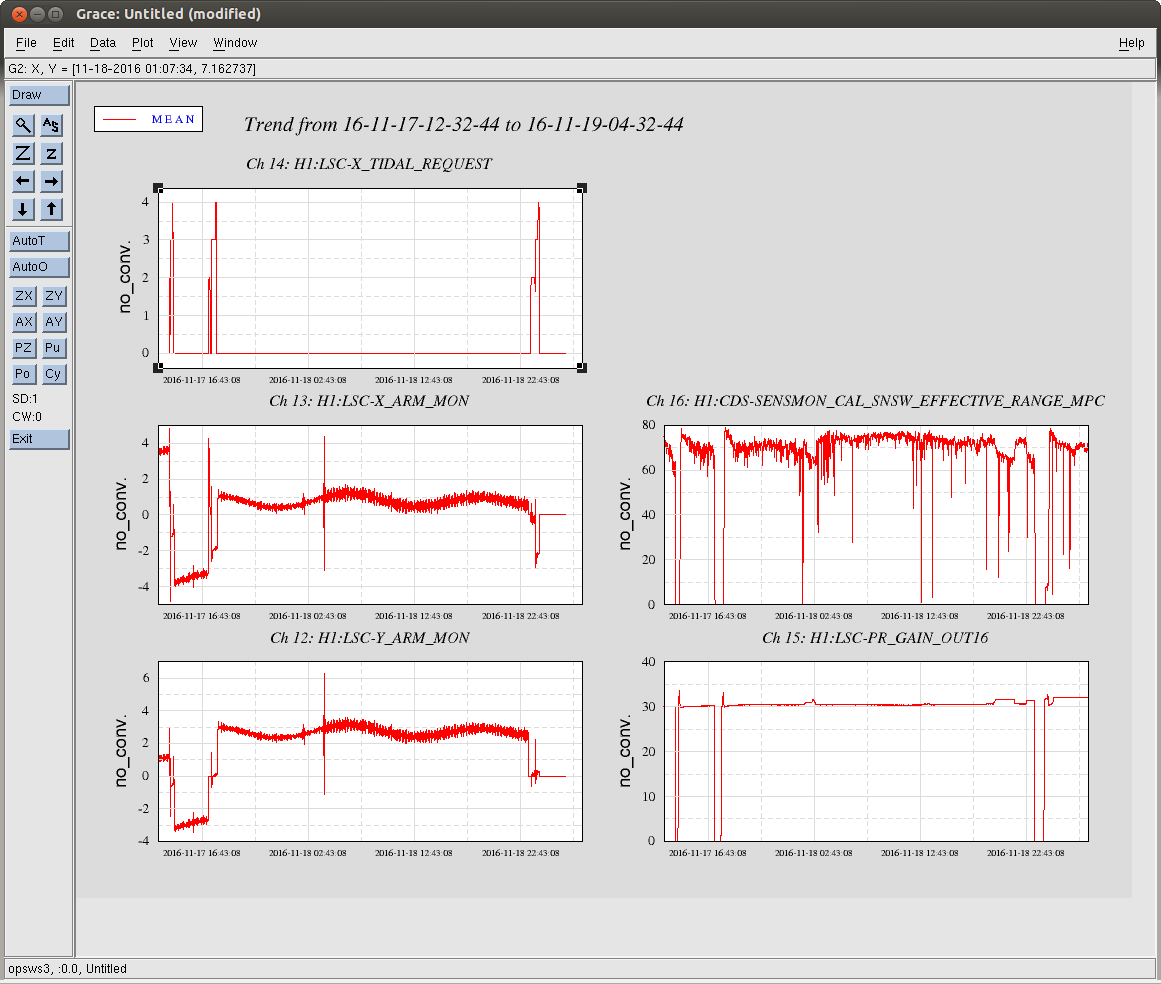
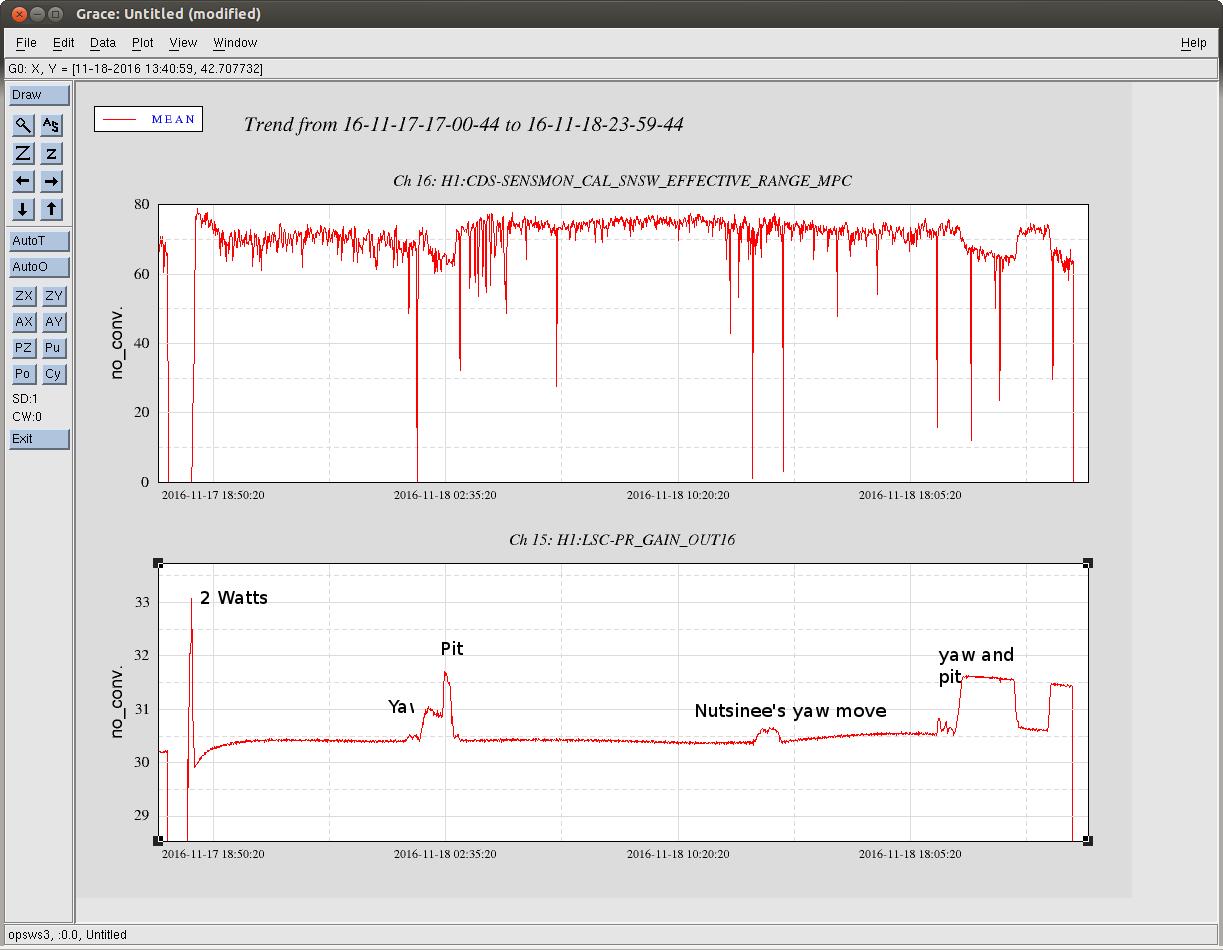
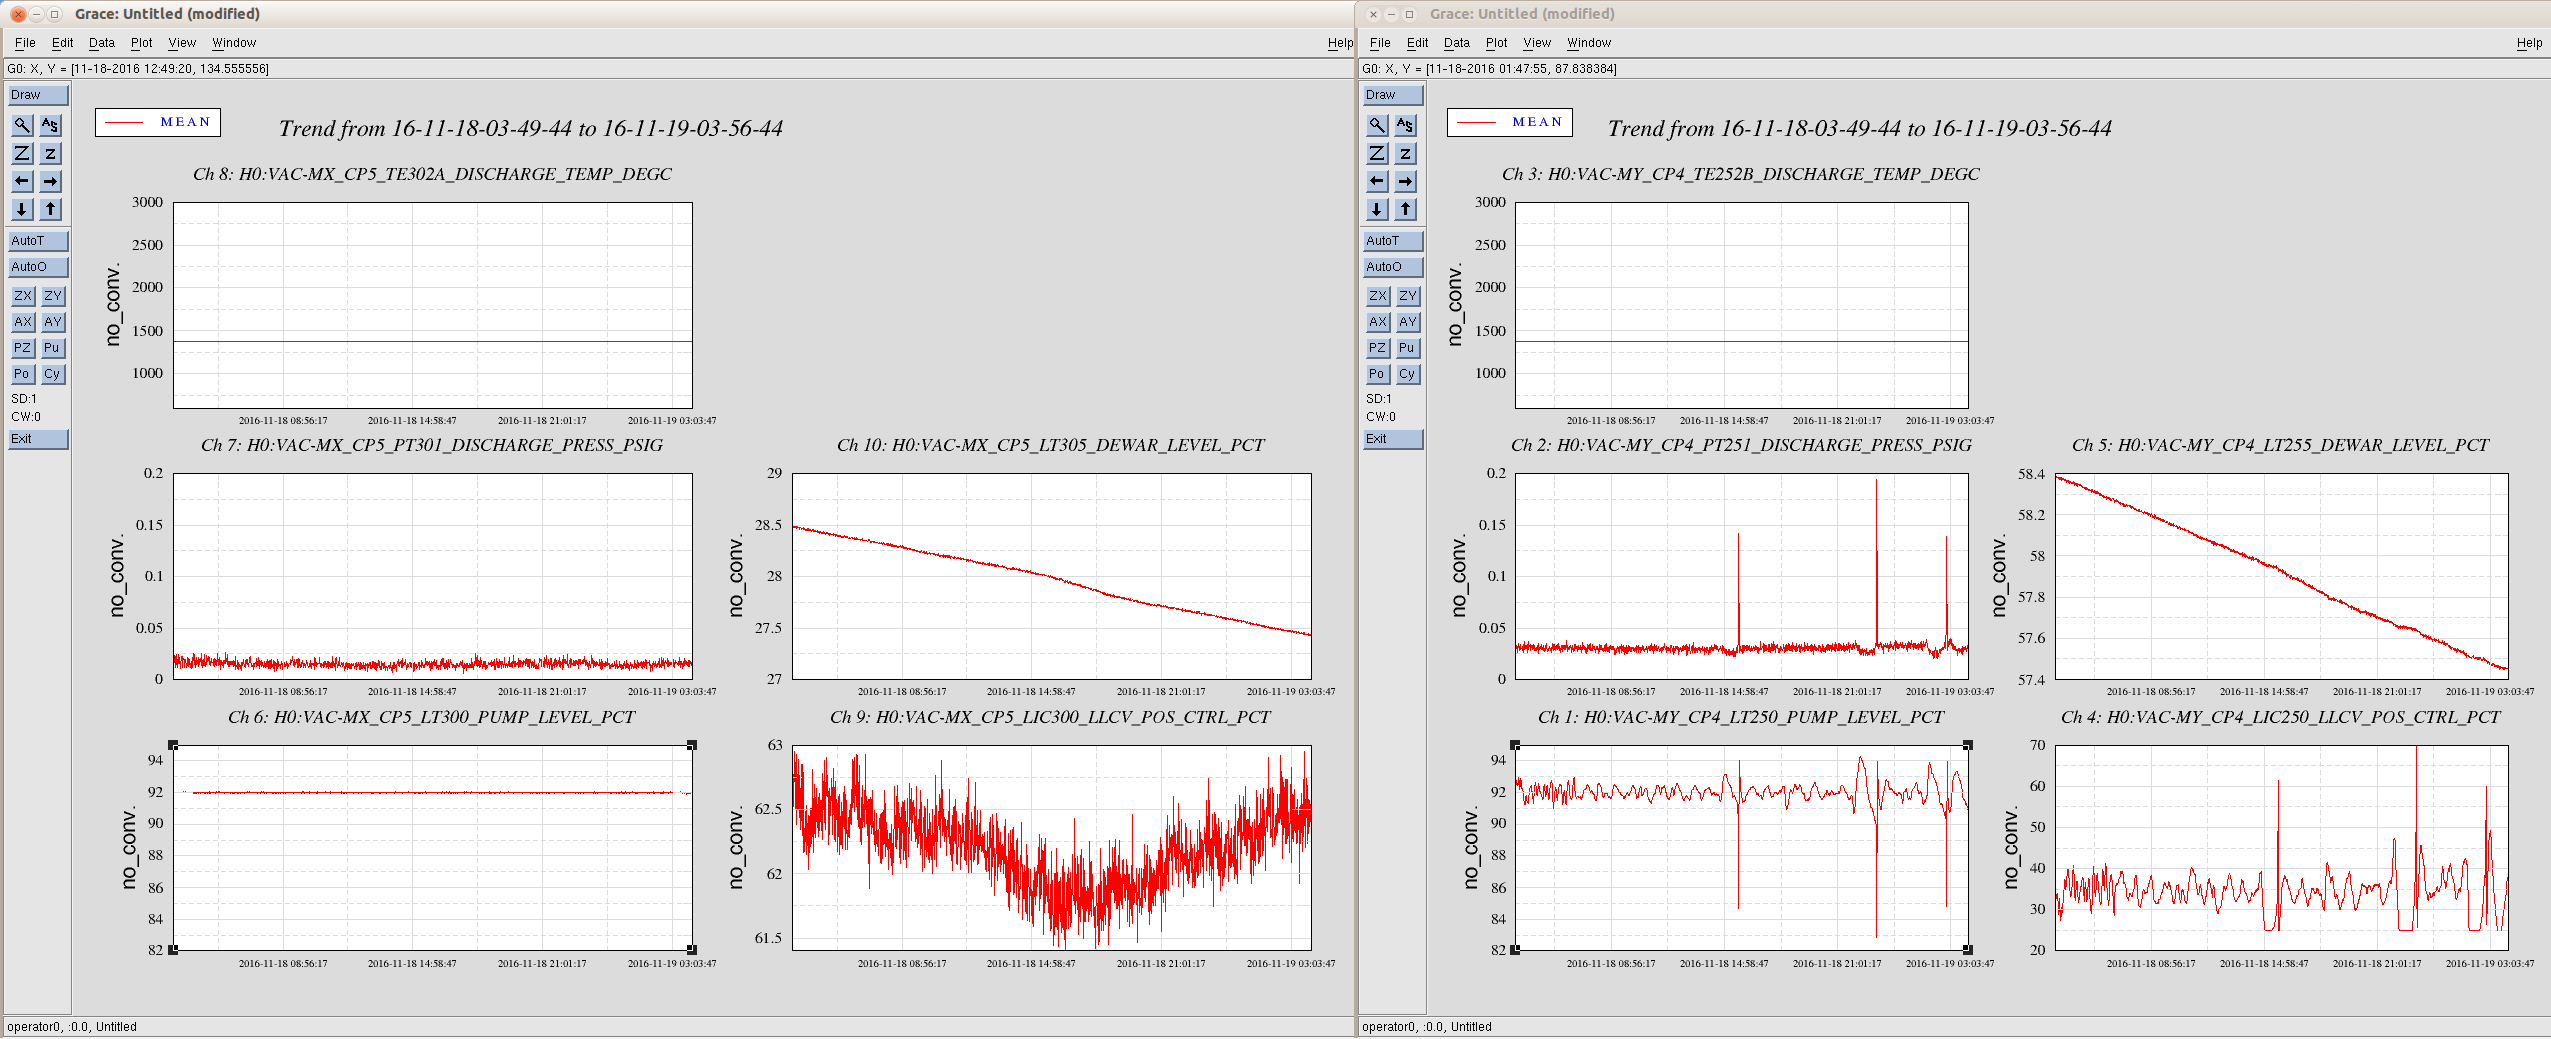
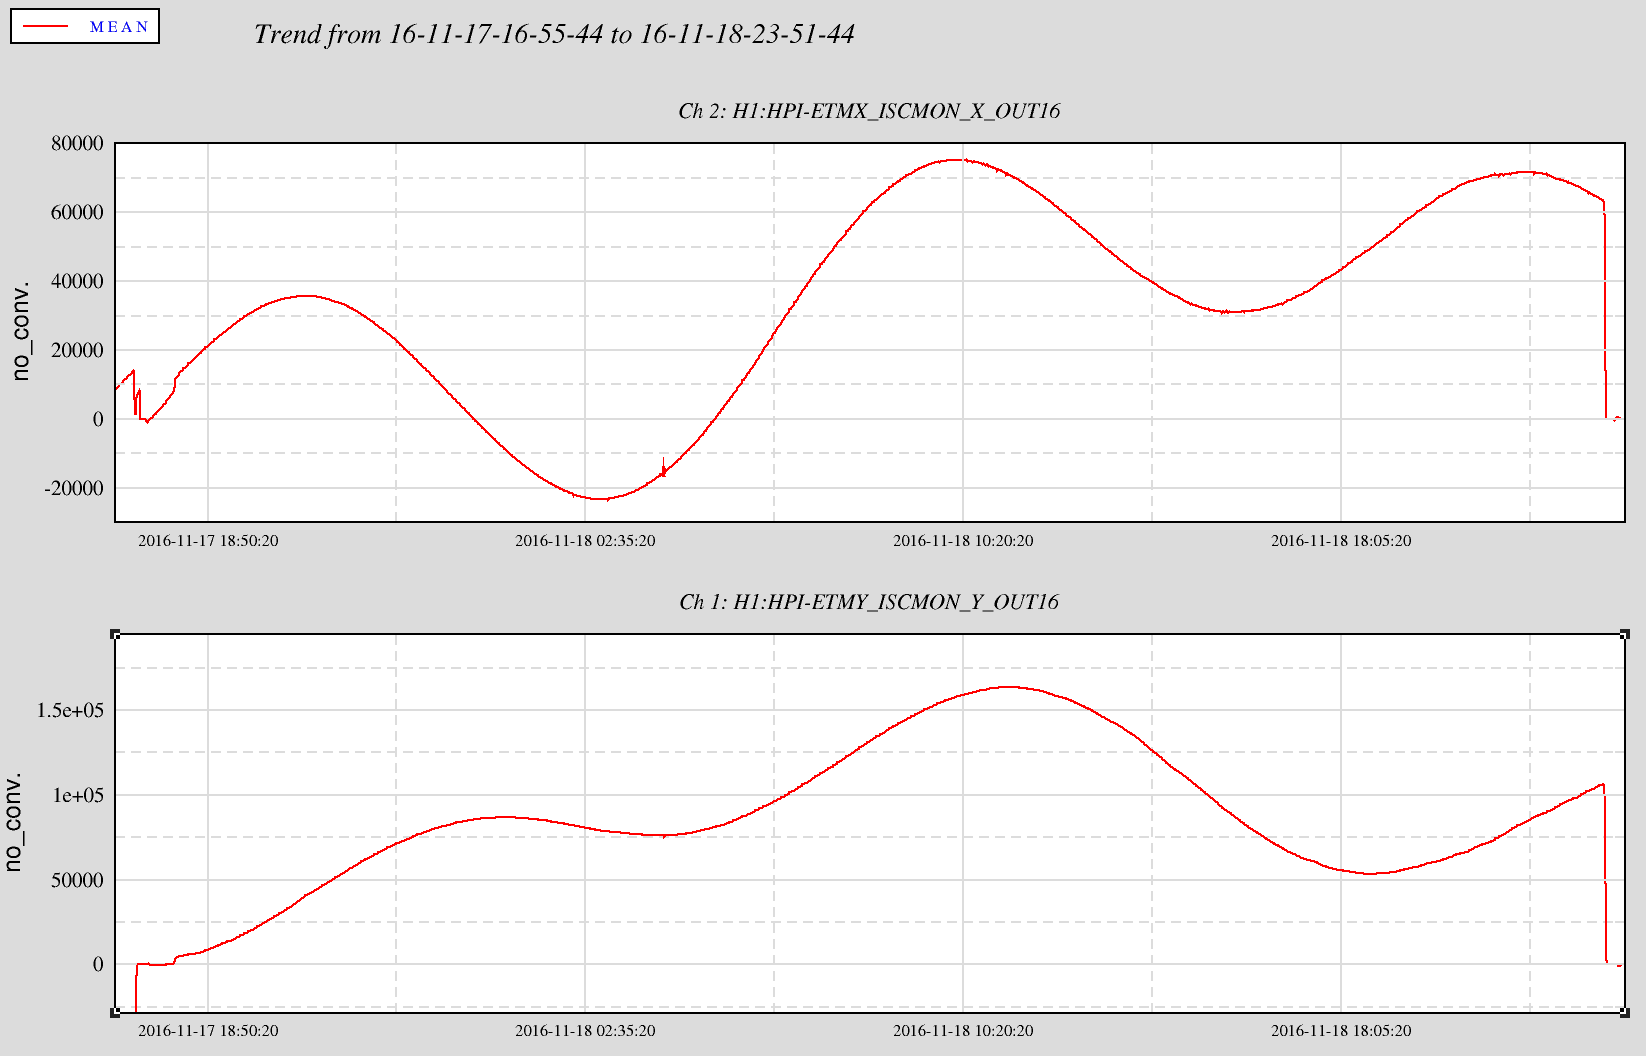
Yesterday we tried moving our spot position on PR3 as a way of increasing the recycling gain. We have been operating at an alignment that gives us a recycling gain of around 30.5, but minimizes the broad jitter lump in DARM. We are able to get a modest increase in recycing gain (to almost 30.7) by moving the PR3 spot in yaw, without causing any extra noise in DARM (this is the test that Nutsinee did last night). However, to get the best recycling gain (almost 31.6 ish) we need to also move pitch back in the direction that makes the broad jitter lump appear again. The first attachment shows the range and recycling gain over the course of the 30 hour lock we just had, you can see that the range clearly drops when the recycling gain increases.
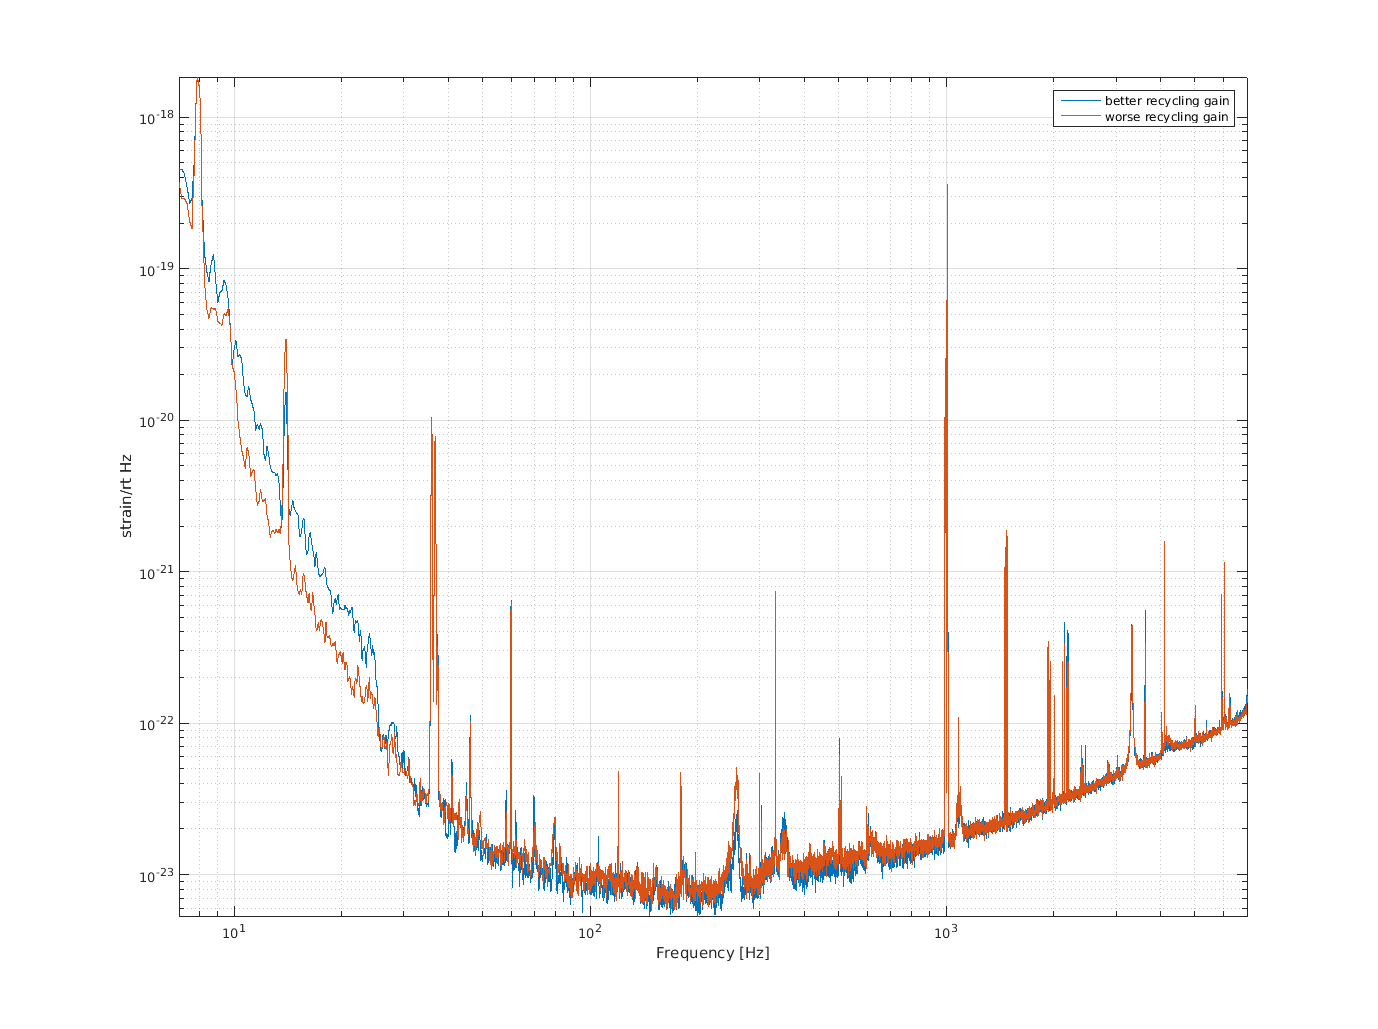
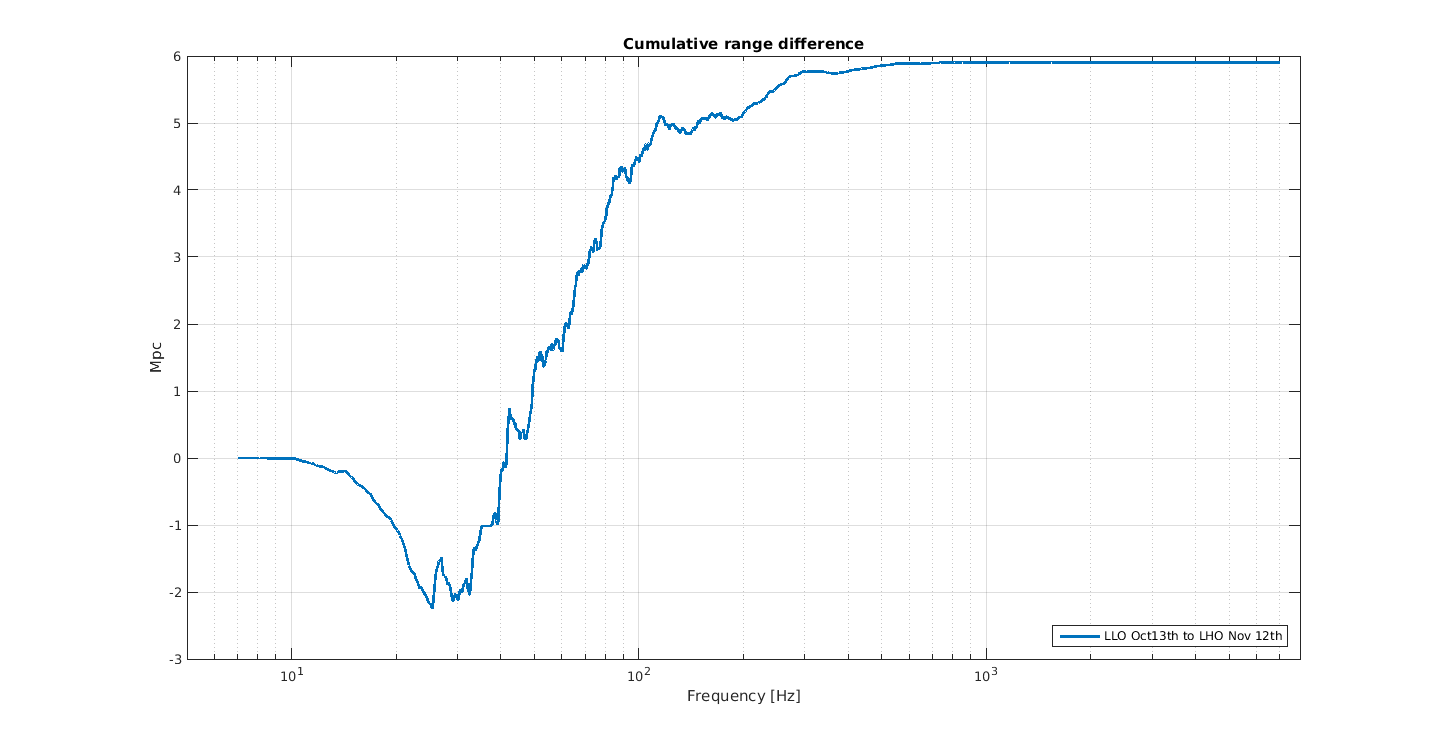
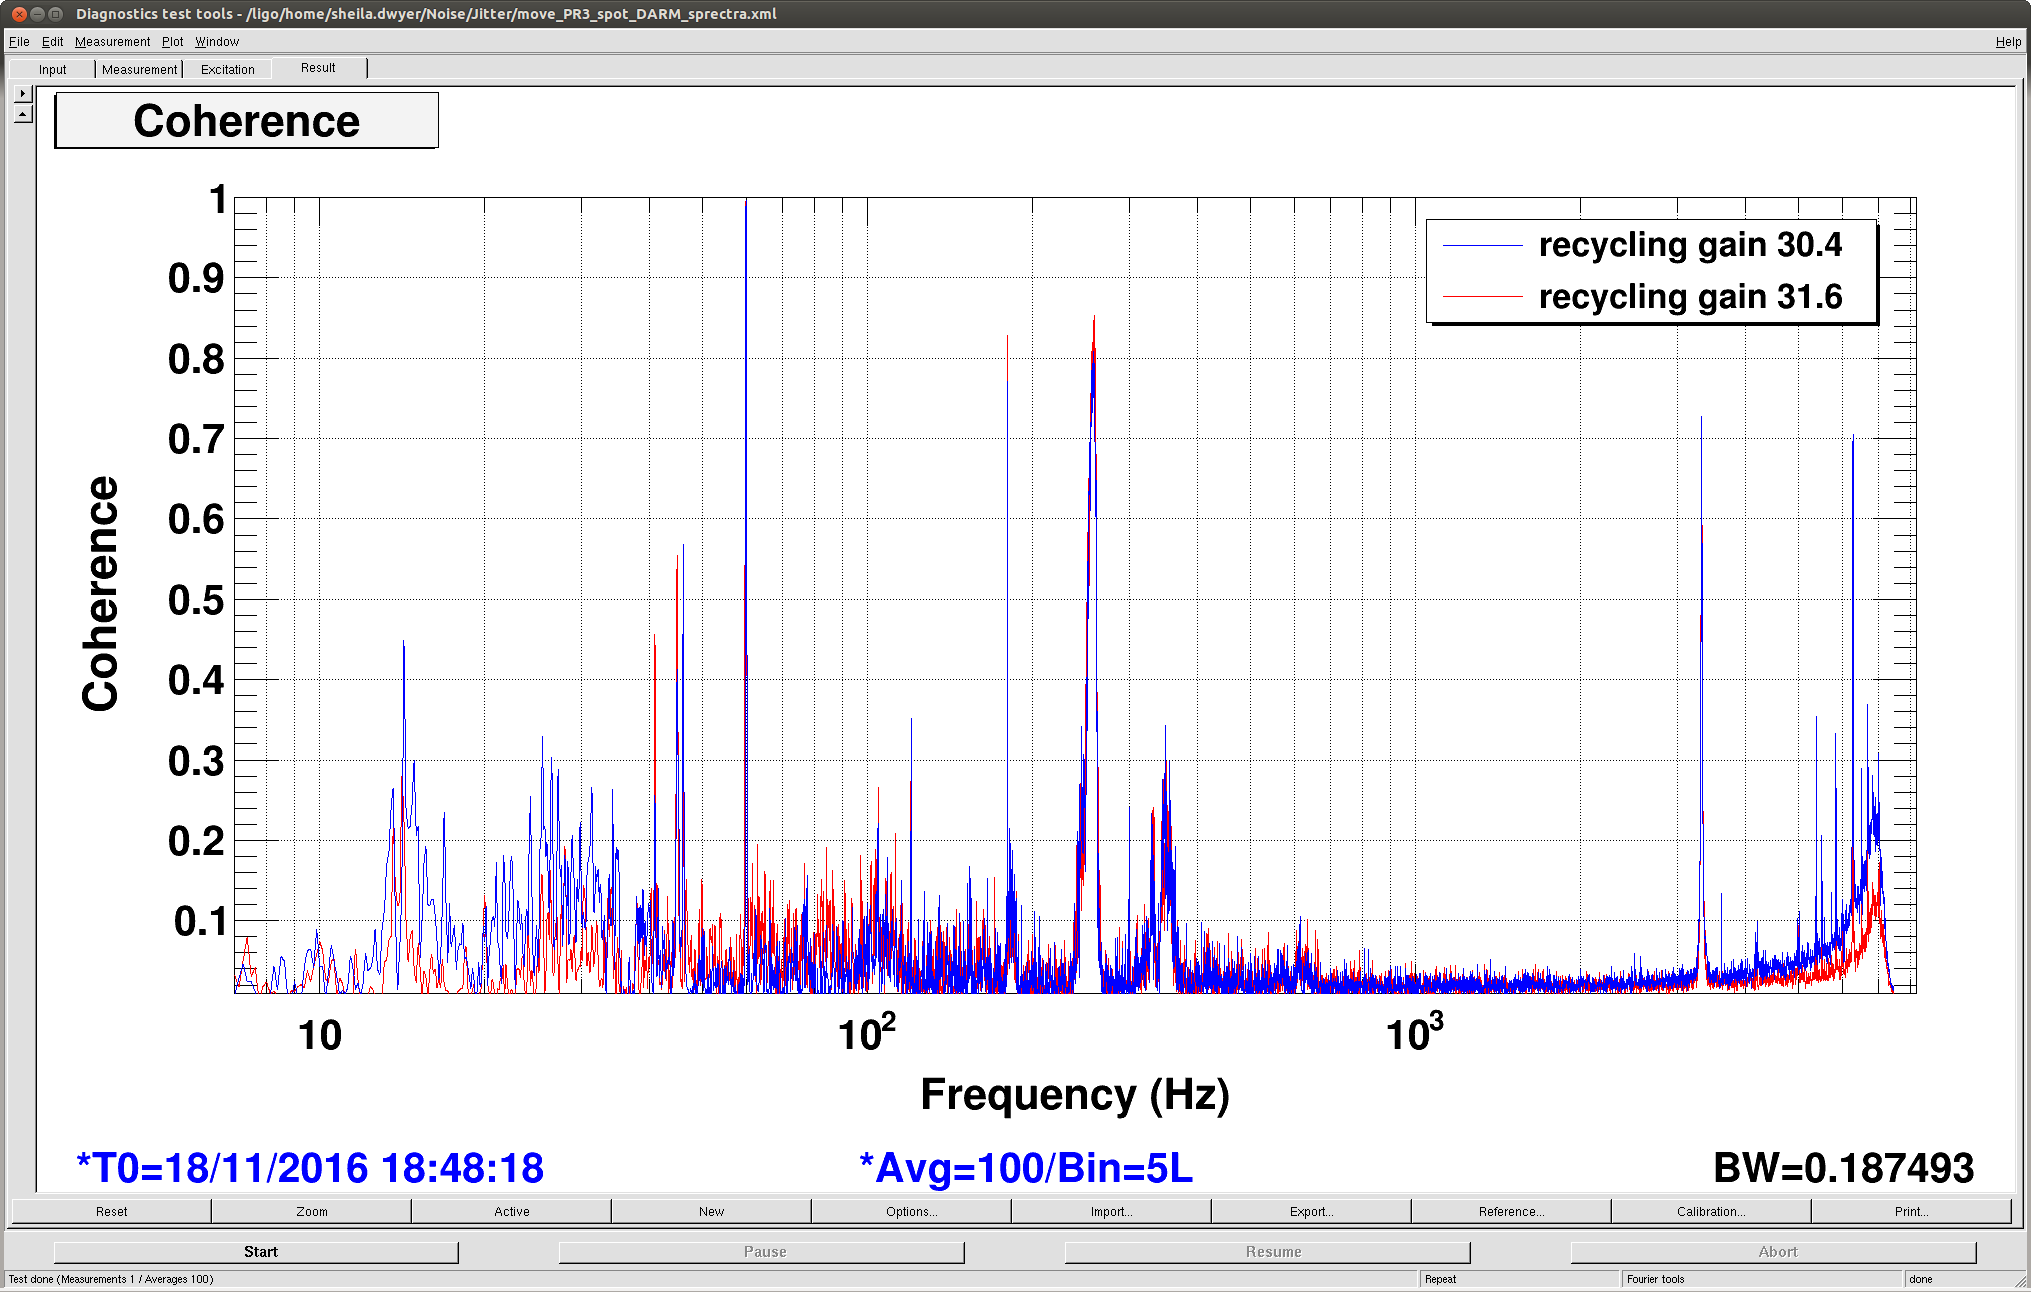
The drop in range however is not due to the jitter peaks, but due to the very small change in the noise from 30-200Hz. The second attachment is a comparision of the spectra in these 2 configurations, in the good recycling gain example we had not retuned a2l which makes the noise below 25Hz bad in the blue trace. The third attachement shows the cumulative range difference, you can see what frequencies are responsible for the drop in range. The third attachment shows that in the higher recyclcing gain state we had more SRCL coherence at these frequencies, so it might be possible to recover the range with the higher recycling gain by retuning SRCL feedforward.
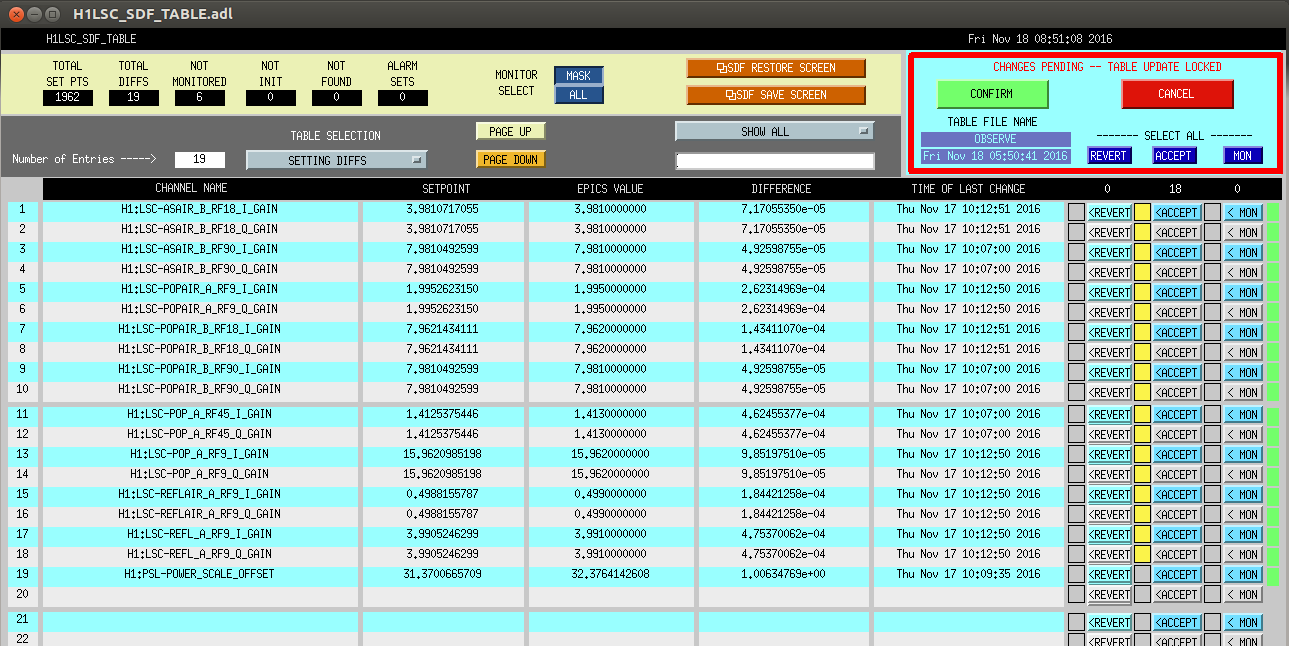
The offsets to use in PRC1 to get to the recycling gain of 32 are 0.2 for pit and -0.109 for yaw. I have put these into the POP A offsets, old values were 0.44 for yaw, nothing for pit, new values are 0.2 for pit, 0.331 for yaw. Cheryl was able to lock the interferometer this way without any updating of the inital alignment references.
PR3 on REFL WFS:
This afternoon I measured the refl WFS sensing for PR3 in some uncalibrated units:
|
|
recycling gain 30.4 |
recycling gain 32 |
|
A9I pit |
0.572 |
1.12 |
|
A45I pit |
0.036
|
0.26 |
|
B9I pit |
0.94
|
1.478 |
|
B45I pit |
-0.6 |
-0.642 |
|
A9I yaw |
-0.367 |
0.065 |
|
A45I yaw |
0.026 |
-0.352 |
|
B9I yaw |
0.795 |
1.232 |
|
B45I yaw |
-0.462 |
-0.407 |
I used the signals for which there is a signal with the same sign in both measurements and not factors of 10 gain changes.
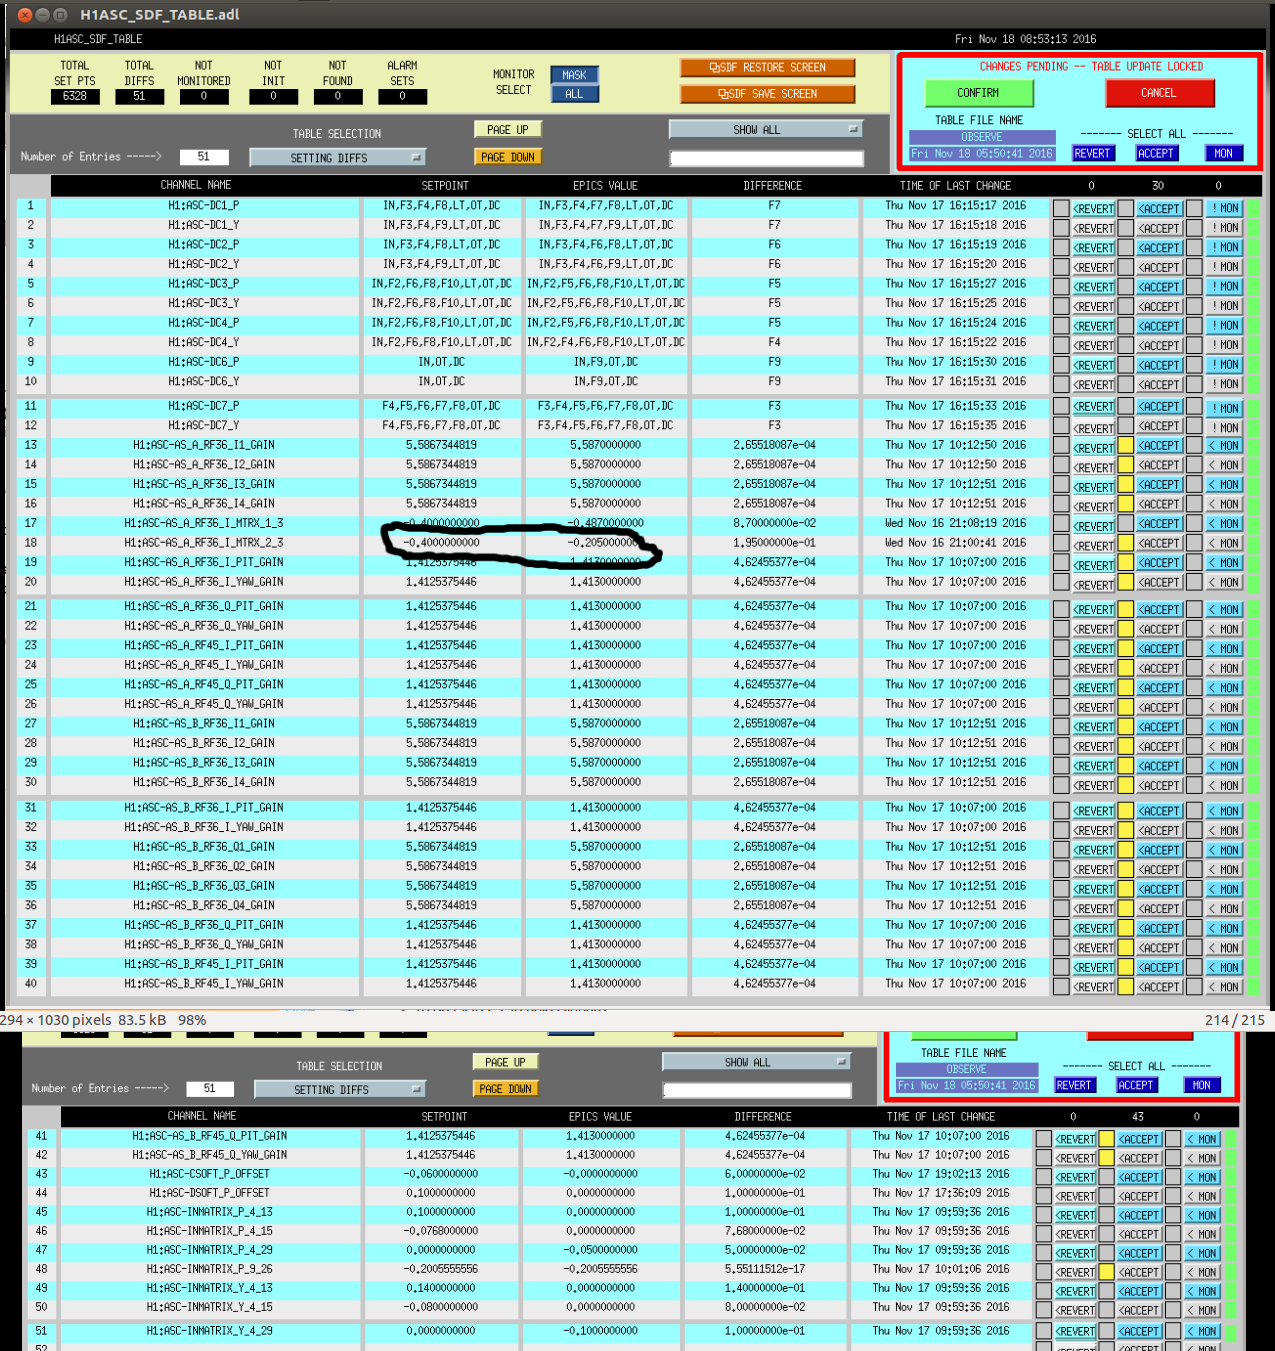
I used an input matrix of 0.53 for REFL A 9I, 0.04 for REFLB9I and -0.092 for REFL B45I. For yaw I switched it over using an input matrix of just refl B, 0.066 REFLB9I and -0.2 REFLB45I. This gives us a ugf about a factor of 4 below what we use for POPX. We have an instability at around 1.88 Hz when we sitch yaw over to REFL WFS with a higher bandwidth, I think it comes from the DC1_Y centering loop.
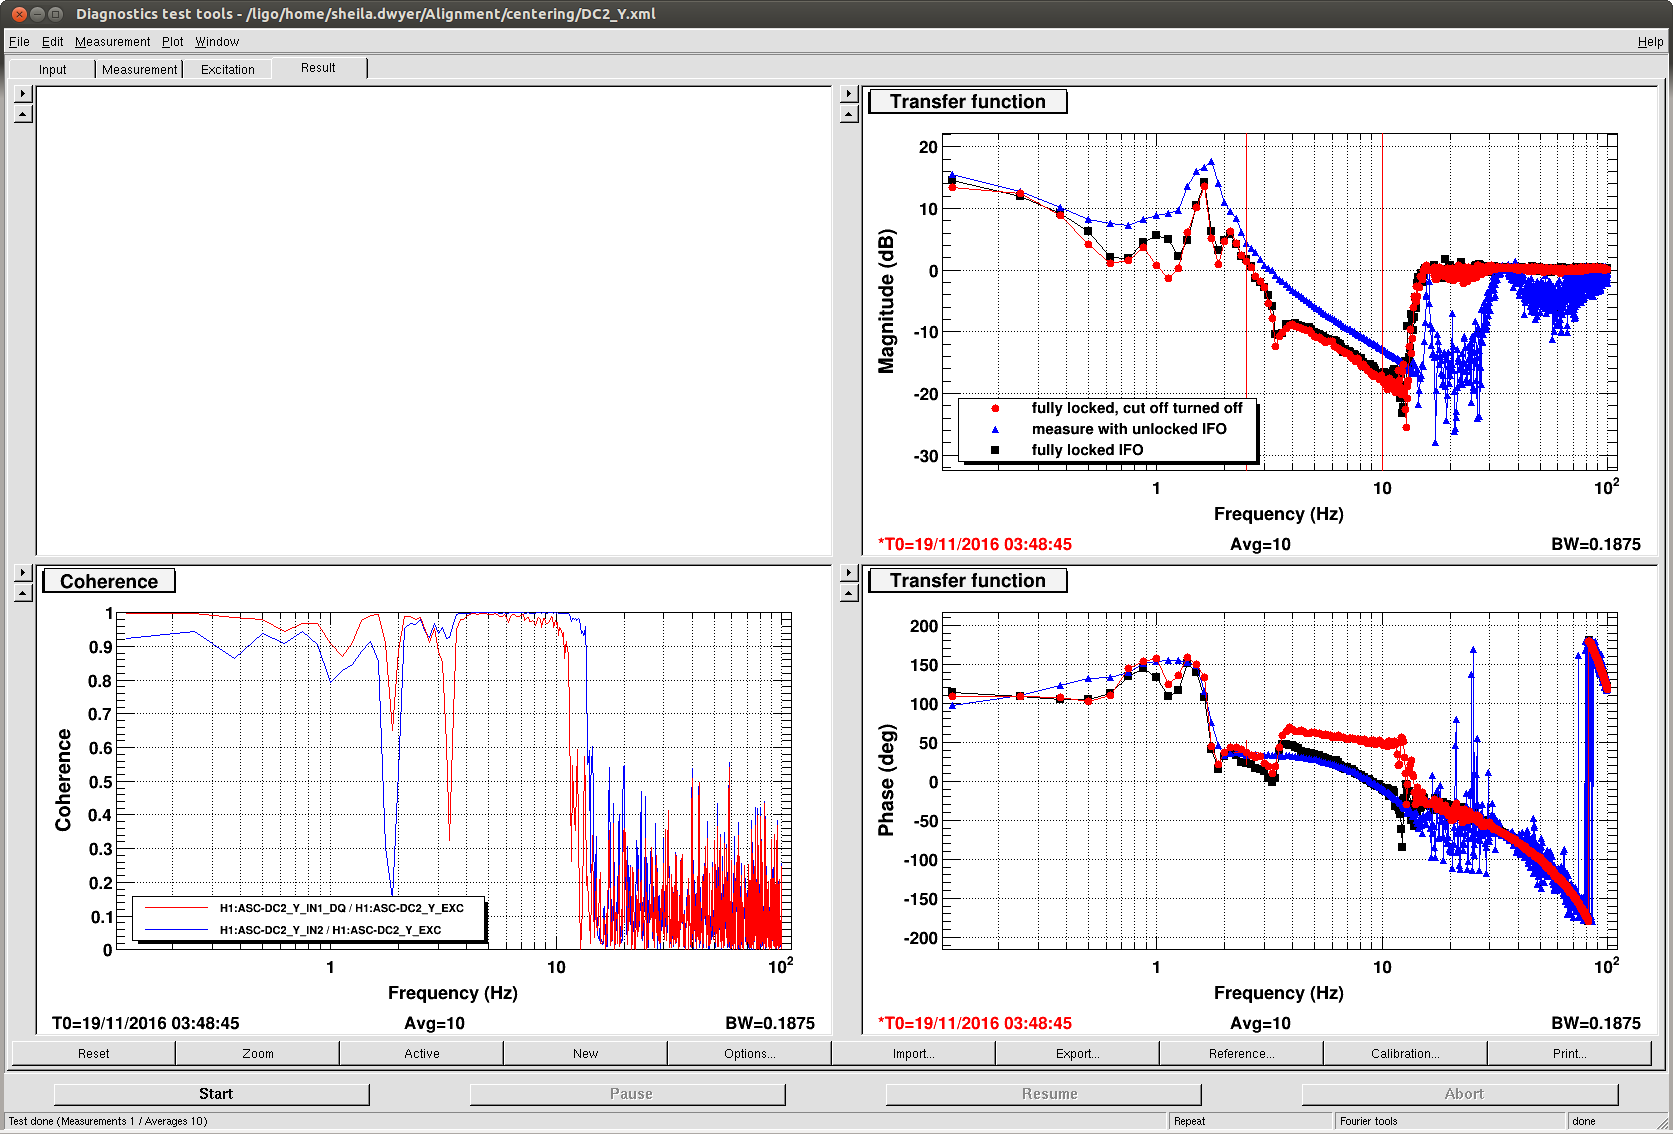
DC1Y centering instability:
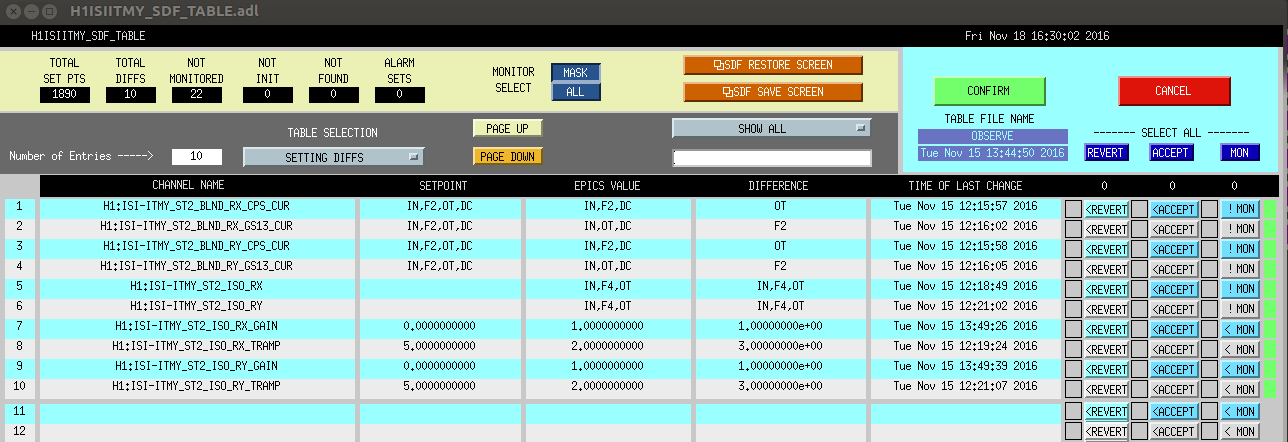
Last week Daniel and I worked on the refl centering loops with the interferometer off, (31382), the settings haven't changed but when I measured DC1Y with the full interferometer locked, something has changed for the worse as shown in the 5th attached screenshot. One gues is that this is because the centering loops are cross coupled with our other ASC loops.
We can try to fix this by increasing the gain, for now I have removed the cut off filter from DC1Y, which only helps a little. Having this off causes RM2 to saturate when we are locked at DC readout (the talker announces this as OM). I also added a notch to PR2Y which only gets engaged when we switch to the REFL WFS, it would not be OK if we had a higher bandwidith. This isn't a very good solution.
The guardian is edited to put in the new matrix and engage the notch for now in PR3_REFL_WFS. If this is not stable you can just go back to skipping PR3_REFL_WFS and CLOSE_BEAM_DIVERTERS
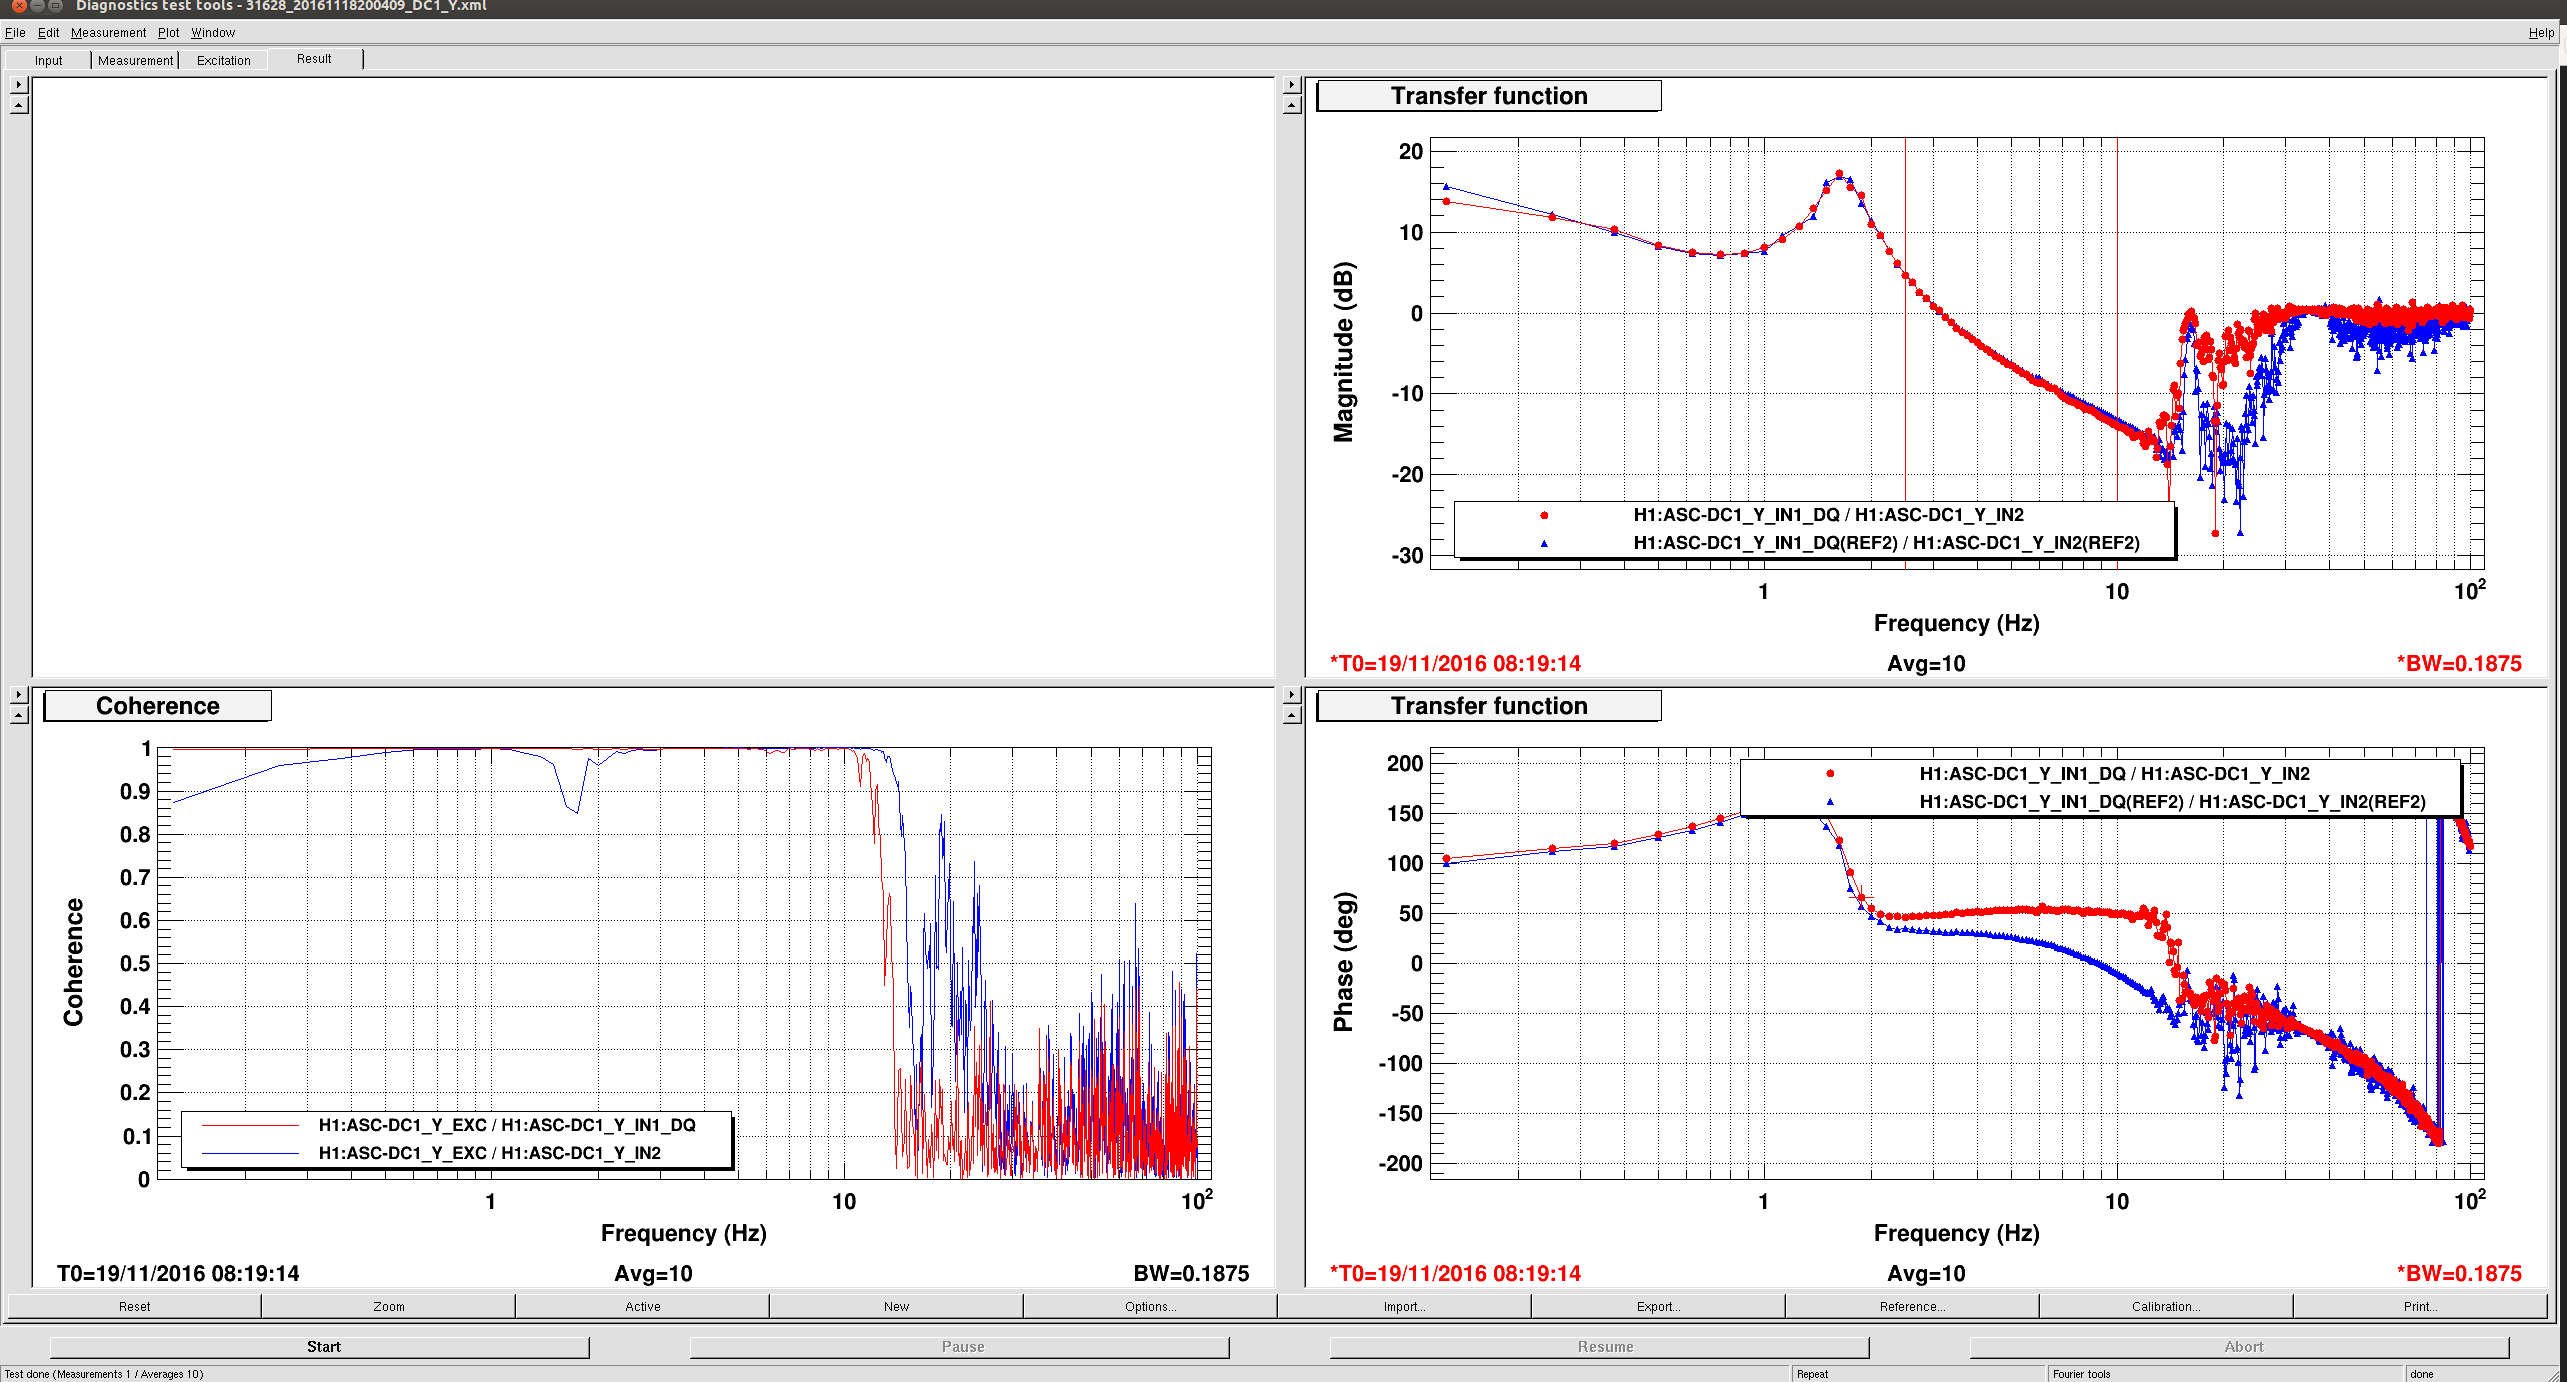
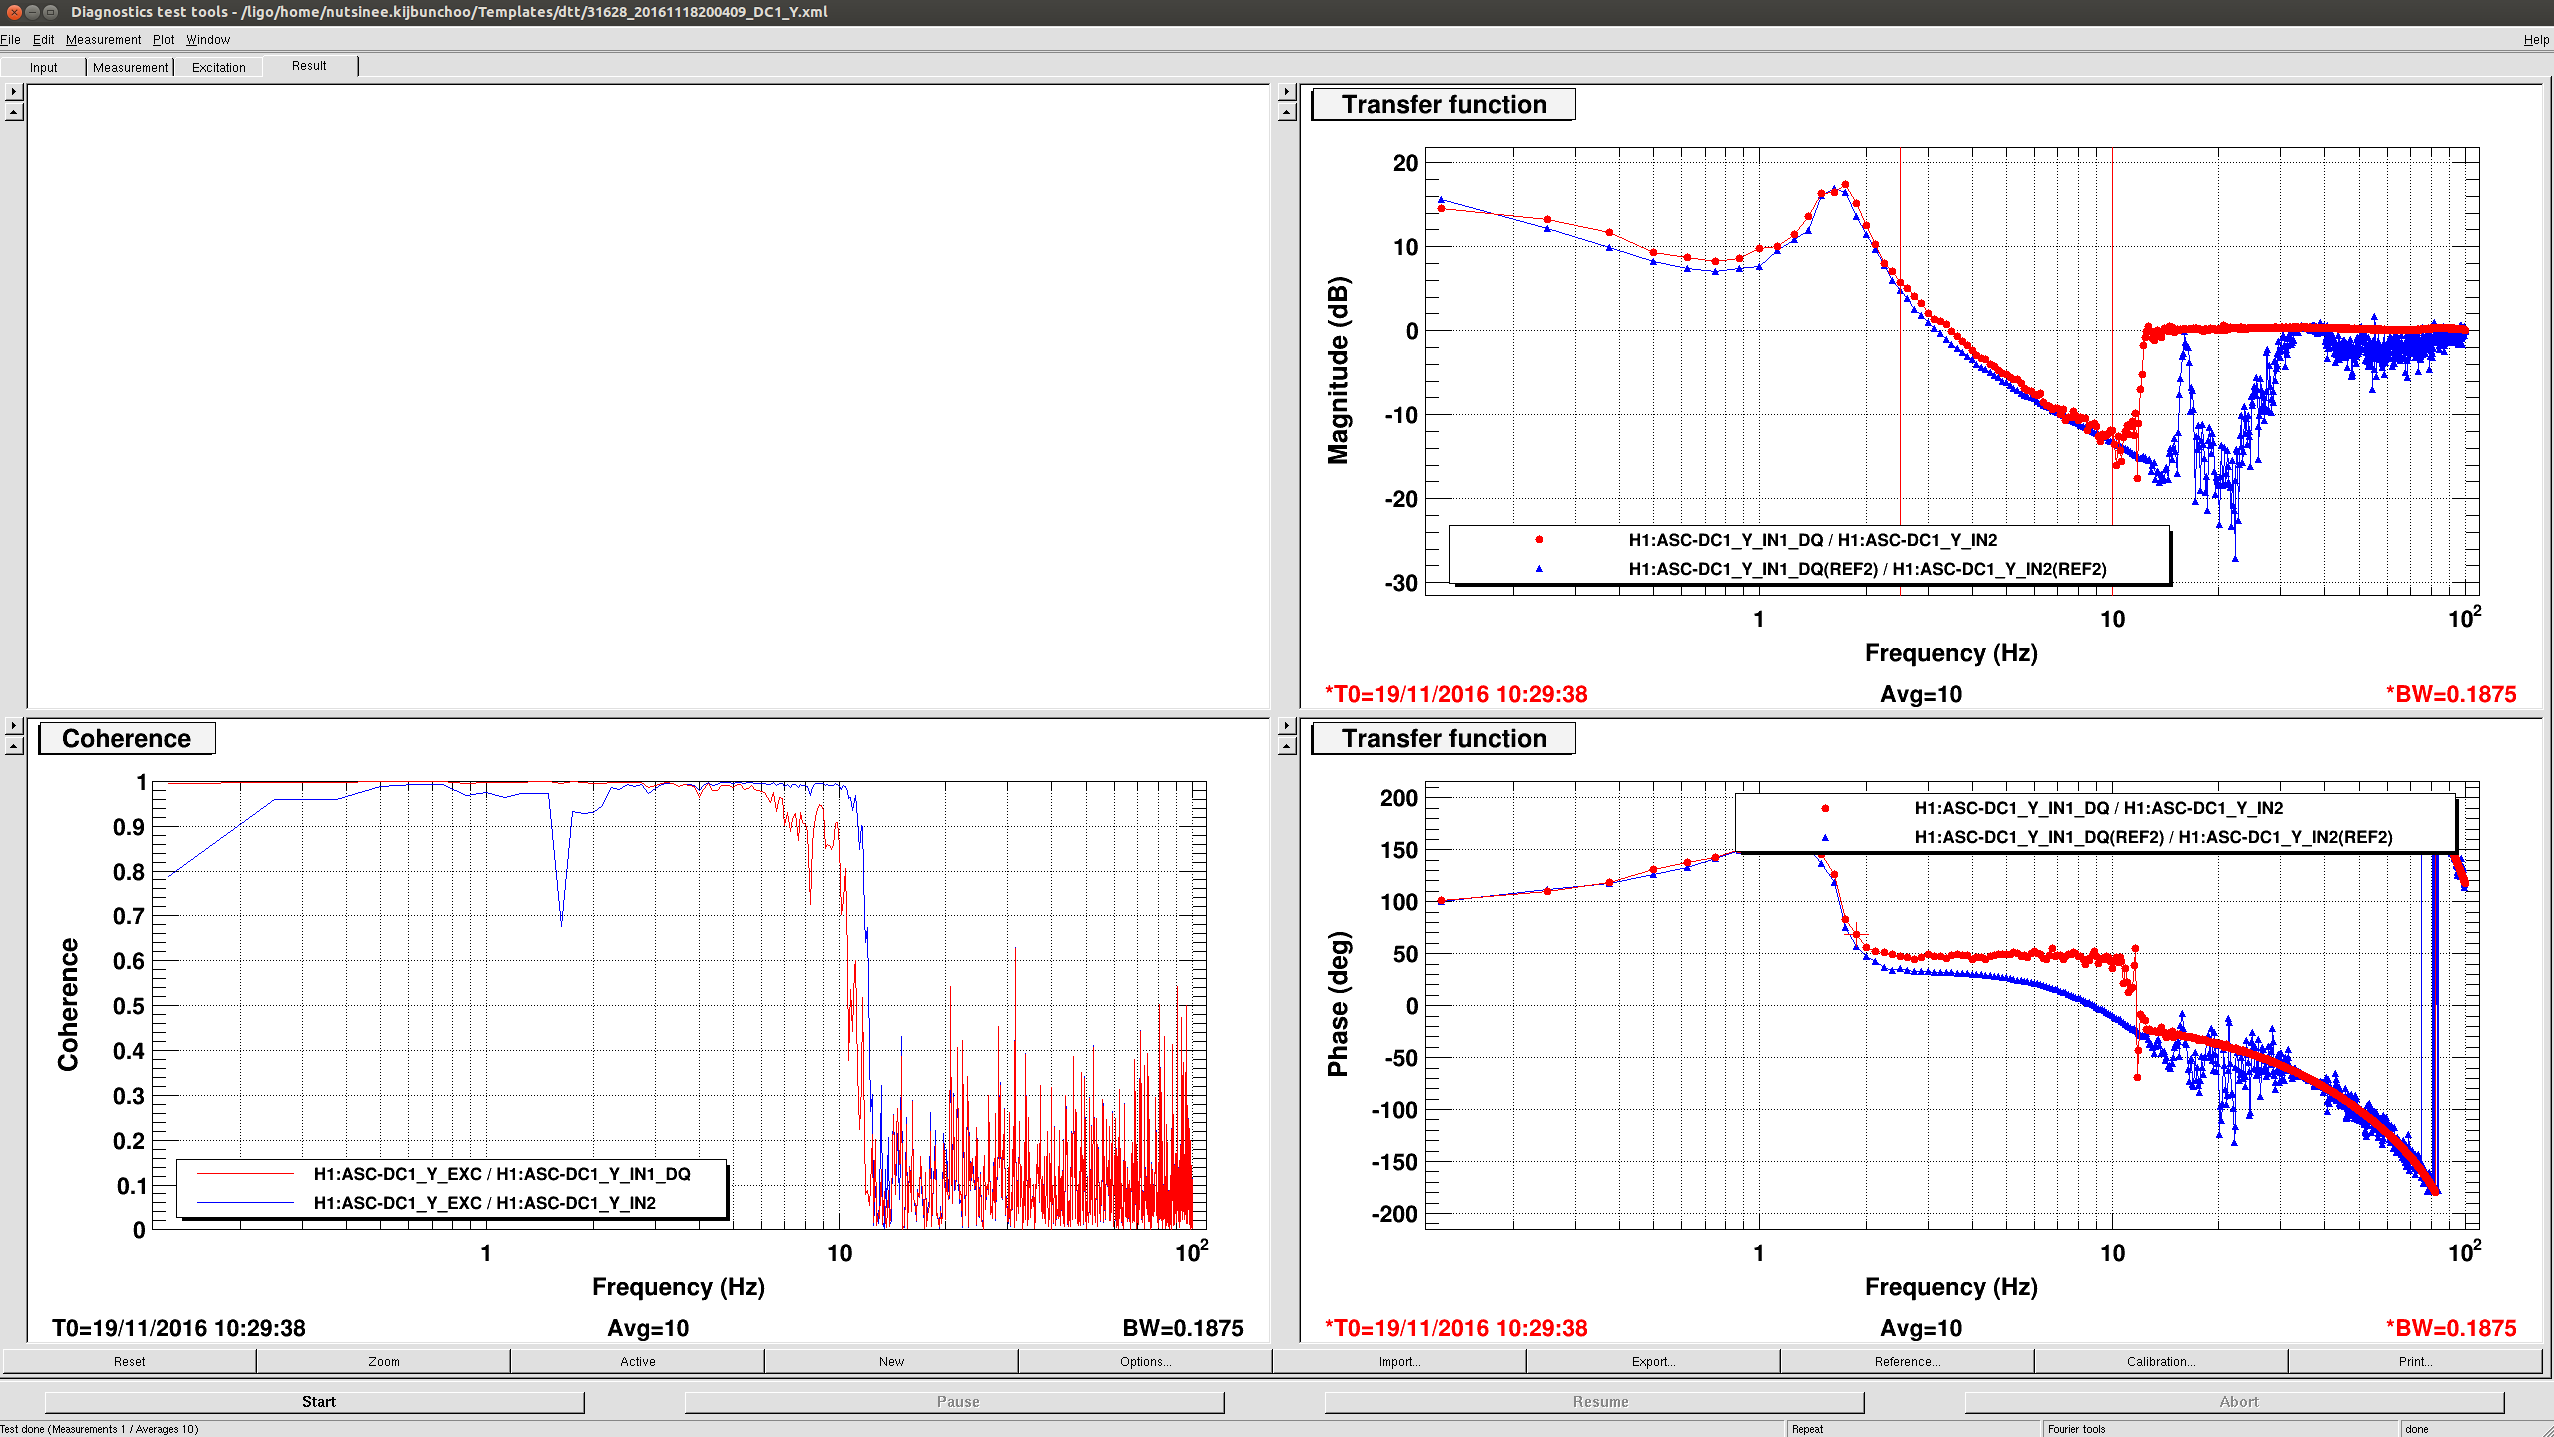
Operator Request: If the interferometer unlocks, could whomever is on shift measure the DC1Y centering loop?
-
First you will have to align PRM, and misalign ITMS and ETMS.
-
Then engage the DC centering loops by opening the ASC overview, and opening the link to DC centering on the blue button in the center of the screen. Turn on the 4 inputs for DC1 P and Y and DC2 P and Y.
-
Download the template attached to this alog and hit run.
-
Save this. If this works, it might also be helpful to run in some other configurations like DRMI or at DC readout before powering up.


Correction: Terra's alog 31593 instructs us to zero modes 3 and 26 to zero:
"Whoever is in the chair next when we have to relock (days from now I'm sure...), please:
• Stop at DC Readout. Run a2l. Turn PI Mode 3 & 26 gain to zero. Record time in alog when you put gains to zero.
• Continue up as normal."