Displaying reports 57421-57440 of 78016.Go to page Start 2868 2869 2870 2871 2872 2873 2874 2875 2876 End
Reports until 15:24, Wednesday 02 September 2015
LHO VE (VE)
gerardo.moreno@LIGO.ORG - posted 15:24, Wednesday 02 September 2015 - last comment - 15:56, Wednesday 02 September 2015(21147)
Mid-Y IP9 Controller Fails

(John, Gerardo)

Noticed the pressure along the Y-arm was rising, but there was no alarms of any kind, after investigating a bit, I determined that the pressure started rising at the Y-Mid station before any other place.
Went to Y-Mid and found the Ion pump controller tripped with the following error "SYSTEM ERROR SEE MANUAL ER7", still looking into this error, called John and he suggested to power cycle the controller, I did and the controller is now up and running.  The pressure is dropping.  We will keep and eye on this controller.
Attached is pressure trend for 1 day along the Y arm.

Non-image files attached to this report
Comments related to this report
gerardo.moreno@LIGO.ORG - 15:56, Wednesday 02 September 2015 (21150)

Error as displayed on controller.

Images attached to this comment
H1 General
corey.gray@LIGO.ORG - posted 15:09, Wednesday 02 September 2015 - last comment - 15:42, Wednesday 02 September 2015(21145)
SDF "OBSERVE.snap" Files Made & Loaded

(Betsy, Corey, Jamie)

This morning I worked with Betsy (& Jamie over phone) on the SDF/Configuration Control (it actually knocked us out of Observation Mode at 18:55UTC!).  SDF is now being used to measure part of the configuration for H1, AND it must be in GREEN (no diffs) in order for an operator to go to Observation Mode.  In order to make SDF more all-encompassing, there was a thought to have SDF note the state of all channels when H1 was in Observation Mode.  (So, SDF would "light up like a Christmas Tree when in acquisition, but should be all GREEN when Guardian is complete. 

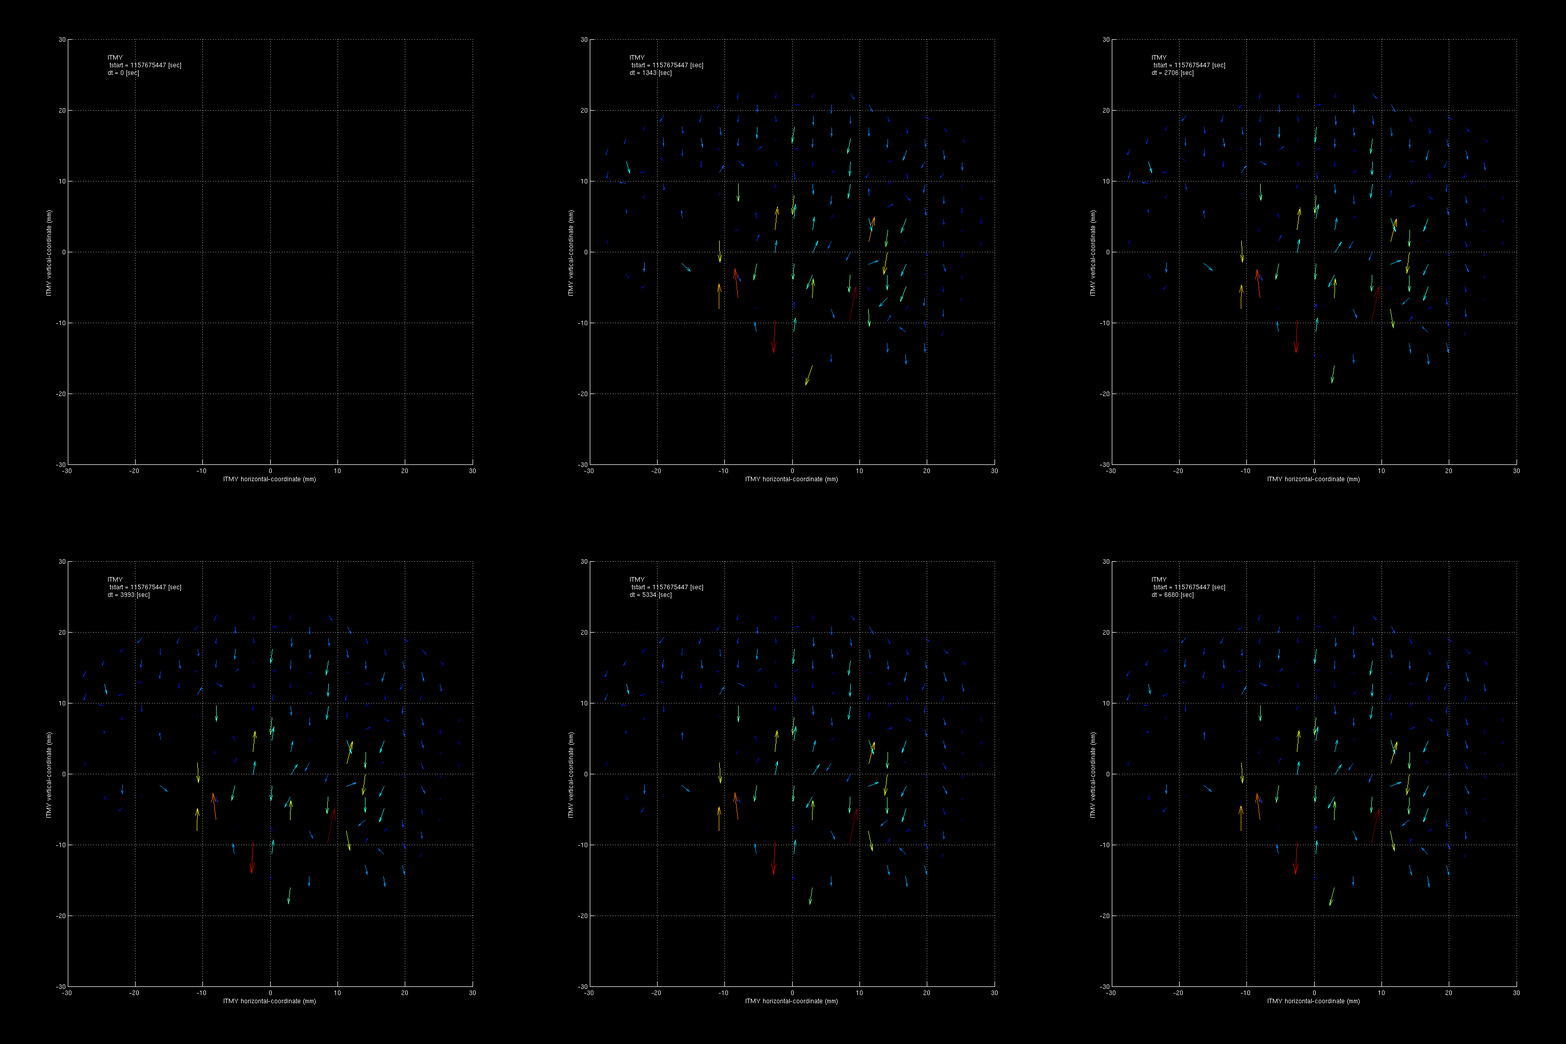
To test this out, we randomly picked ITMy.  We decided to Monitor ALL* of its channels while at NOMINAL_LOW_NOISE, and then (1) save this file as OBSERVE.snap & (2) Load this file into SDF. 

* We did decide to NOT Monitor a small list of channels which will change from lock to lock.  For a suspension, this would be the OPTICALIGN pit/yaw biases.

I've been waiting for H1 to break lock, so I could watch the new OBSERVE SDFs, to see if they return to a GREEN state when making it to NOMINAL_LOW_NOISE again, but we haven't dropped out of Science.  I might revert these SDFs to their safe.snaps since this is test configuration, and I wouldn't want to prevent Observation mode tonight.

At any rate, below are the SDFs I made OBSERVE.snaps for:

  1. SUS-ITMX (Not monitored:  Optic pit/yaw)
  2. SUS-ITMY (Not monitored:  Optic pit/yaw)
  3. SUS-ETMX (Not monitored:  Optic pit/yaw)
  4. ISI-ITMy (Not Monitored:  H1:ISI-ITMY_ST1_CPS_[*]_SETPOINT_NOW, which might be making tiny changes all the time.)

To back out of using the OBSERVE files & load safe, one can always:

  1. go to the SDF nodes for the ones noted above,
  2. open "SDF RESTORE SCREEN" (top center)
  3. click "! SELECT REQUEST FILE" on RESTORE window
  4. select & open "safe.snap" file
  5. click "LOAD TABLE" on RESTORE window
  6. This will return you to where we were at

To make these OBSERVE files will take us out of Science Mode (since "diffs" will be noted albeit briefly).  I might try making some more now since we are out of Science Mode for PEM Injections.  Otherwise, Betsy will be back Monday to also help out with this.

Comments related to this report
corey.gray@LIGO.ORG - 15:42, Wednesday 02 September 2015 (21149)

Made a few more OBSERVE.snaps:

  • SUS-ETMY (Not monitored:  Optic pit/yaw)
  • HPIITMY (Eveything accepted & monitored!)
  • ISIBS (Not Monitored:  H1:ISI-[*]_ST1_CPS_[*]_SETPOINT_NOW, which might be making tiny changes all the time.)
  • HPIBS (Eveything accepted & monitored!)

I also decided to back out all of these OBSERVE.snaps and revert back to the save.snaps for the time being.

H1 CAL
corey.gray@LIGO.ORG - posted 14:21, Wednesday 02 September 2015 (21146)
H1 Marked As Having "Injection" (while I'm in Observation Mode)

So, I've recently taken H1 back into Observation Mode (after taking it out for some SDF tweaks), however up on the GWI.stat page, LHO's status is set to Injection (pink).  (How can operators know when these are to happen?  Is there a schedule for them?)

Evan pointed me to where the Hardware Injections home is: 

sitemap / LVEA CAL / HWING CTRL  --->  HARDWARE (middle of screen) ---> this opens:  H1CALCS_INJHARDWARE.adl

These shouldn't be causing us grief, but if we are ever requested to turn these off, turn the OUTPUT off.

Eric Thrane/Keith Thorne are names I've heard mentioned as contacts for Hardware Injections.

H1 CDS (DAQ)
david.barker@LIGO.ORG - posted 11:36, Wednesday 02 September 2015 (21141)
CDS model and DAQ restart report, Tuesday 1st September 2015

ER8 Day 16. Maintenance Day. SUS restarts to swap out DAC/ADC cards. New odcmaster code.  No unexpected restarts.

model restarts logged for Tue 01/Sep/2015
2015_09_01 09:55 h1odcmaster
2015_09_01 09:57 h1fw1
2015_09_01 10:22 h1fw1
2015_09_01 10:26 h1fw1

2015_09_01 11:33 h1iopsusauxh56
2015_09_01 11:33 h1susauxh56
2015_09_01 11:35 h1iopsush56
2015_09_01 11:35 h1sussr3
2015_09_01 11:35 h1sussrm
2015_09_01 11:36 h1iopsush56
2015_09_01 11:36 h1susomc
2015_09_01 11:36 h1sussr3
2015_09_01 11:36 h1sussrm
2015_09_01 11:38 h1iopsush56
2015_09_01 11:38 h1susomc
2015_09_01 11:38 h1sussr3
2015_09_01 11:38 h1sussrm

2015_09_01 12:42 h1broadcast0
2015_09_01 12:42 h1dc0
2015_09_01 12:42 h1fw0
2015_09_01 12:42 h1fw1
2015_09_01 12:42 h1nds0
2015_09_01 12:45 h1nds1
2015_09_01 12:46 h1nds1
2015_09_01 14:32 h1pemcs
2015_09_01 14:34 h1broadcast0
2015_09_01 14:34 h1dc0
2015_09_01 14:34 h1fw0
2015_09_01 14:34 h1fw1
2015_09_01 14:34 h1nds0
2015_09_01 14:34 h1nds1
2015_09_01 15:24 h1dc0
2015_09_01 15:26 h1broadcast0
2015_09_01 15:26 h1dc0
2015_09_01 15:26 h1fw0
2015_09_01 15:26 h1fw1
2015_09_01 15:26 h1nds0
2015_09_01 15:26 h1nds1
2015_09_01 15:36 h1dc0
2015_09_01 15:37 h1dc0
2015_09_01 15:38 h1broadcast0
2015_09_01 15:38 h1fw0
2015_09_01 15:38 h1fw1
2015_09_01 15:38 h1nds0
2015_09_01 15:38 h1nds1

LHO General
corey.gray@LIGO.ORG - posted 11:31, Wednesday 02 September 2015 (21140)
Morning Status

This morning H1 was in an unhealthy state with it dropping out of lock fairly early in the ISC_LOCK scripts.  Alignment (mostly) was not an issue.  Kiwamu began troubleshooting as we went through various states of ISC_LOCK.  A few notable actions by Kiwamu:

After this we monitored for a while and decided to go to OBSERVATION Mode at 17:32UTC with a range of ~57Mpc.  There have been a few ETMy glitches during this stretch.

At some point we will drop out of Observation Mode for PEM Injection work by Anamaria & Robert.

H1 CDS (DAQ)
david.barker@LIGO.ORG - posted 11:30, Wednesday 02 September 2015 (21139)
CDS model and DAQ restart report, Monday 31st August 2015

ER8 Day 15

model restarts logged for Mon 31/Aug/2015
2015_08_31 09:13 h1iopsush2a
2015_08_31 09:15 h1susmc1
2015_08_31 09:15 h1susmc3
2015_08_31 09:15 h1suspr3
2015_08_31 09:15 h1susprm
2015_08_31 10:09 h1iopsush56
2015_08_31 10:09 h1susomc
2015_08_31 10:09 h1sussr3
2015_08_31 10:09 h1sussrm

2015_08_31 15:59 h1nds1
2015_08_31 16:05 h1nds1
2015_08_31 22:15 h1nds1
2015_08_31 22:18 h1nds1

unexpected restarts of h1nds1. Restarts of SUS IOPs to perform a recalibration of the 18bit-DACs

H1 SYS
jameson.rollins@LIGO.ORG - posted 11:21, Wednesday 02 September 2015 (21138)
SDF support screens updated

The support screens for the SDF_OVERVIEW screens, for the individual panels and the legend, have been updated.  They had not been updated yesterday, which is why the screens had been looking funny.

H1 ISC
kiwamu.izumi@LIGO.ORG - posted 11:09, Wednesday 02 September 2015 (21135)
morning locking effort

We are back to full lock at around 9:30 PT. There were a couple of issues in ASC as listed below.


I took over from Jenne, who stayed all the night, and kept relocking the interferometer. JeffB had a nice hand-written note of what guardian states the interferometer has unlocked. According his note, there were several lock losses in SWITCH_TO_QPD (see also Jenne's alog) and one lockloss in DRMI_ON_POP. I kind of suspected the TRX and TRY signals and therefore took a look at the spectra and dark offsets with IMC intentionally unlocked. They look healthy except for a small offset in TR_Y_B_QPD. They had an dark offset of about roughly 0.3 counts in terms of SUM  which should not be a problem in SWITCH_TO_QPD, but since I just noticed it, I adjusted the dark offsets. One note is that since these QPDs are sensitive not only to red light but also green light, I intentionally kept green light resonant in both arms in order to obtain proper dark offsets.

I did not lose lock in SWITCH_TO_QPD at all for some reason. I am not sure if this is because of the improved dark offsets in TRY or not. I then stopped at CARM_5PM for just checking out how high the bounce and roll modes are. Initially the bounce modes were as high as 10-12 m/sqrtHz in the darm spectrum with 0.1 Hz BW. I gave several minutes to the interferometer in order to damp them with some addition of extra gain in the DAMP_V filter in all four quad suspensions. At this point, PR3 tilted more than it usually does presumably due to some thermal load on the wires, I manually touched PR2 to counteract it. Without this touch, I think it would not stay locked for more than a minute in CARM_5PM. This maybe an indication of a different spot position on PR3. Though, no idea how different.

Reaching DC_READOUT, I found the interferometer to be more wobbly than it usually is. In particular, POP_LF was clearly modulated by PRM longitudinal actuation. This lead me to look further into the ASC loops, especially PRC and INP loops. As listed above, PRC2 Y, INP1 P/Y and PRC1 P/Y were found to be not engaged in full lock. Sheila looked into ISC_LOCK and removed the sentences which set the ASC gain to zero for INP1 and PRC1 so that by the time when the interferomteer engages full ASC it will engage INP1 and PRC1 as well. Since we did not lose lock afterwords, ISC_LOCK has not been tested. We set the ISCINF_Y  gain of PR3 to 10 according to trend of the past 10 days or so. So far the interferometer stays locked with ASC fully engaged without an obvious or big issue.

H1 General
betsy.weaver@LIGO.ORG - posted 10:50, Wednesday 02 September 2015 (21136)
Enabled set point monitoring on ISC_LOCK GRD node

Since the IFO just made it back to nominal low noise mode, I enabled the ISC_LOCK SPM.  It immediately came up with 33 differences.  Then, Sheila changed a few things and 6 more diffs possed up bringing the total to 39.  I'm not sure how Jamie intends to deal with the fact that this ISC_LOCK GRD is showing diffs likely made in subordinate GRDs.  I post a pic of the first 10 channels in the medm for Jamie and I to confer on and address.

(Note, to "turn SPM on", I added lines of code to the ISC_LOCK GRD code, and reloaded it.

ca_monitor = True
ca_monitor_notify = False

Images attached to this report
H1 General
jim.warner@LIGO.ORG - posted 07:58, Wednesday 02 September 2015 (21134)
Shift Summary
7:00 I arrive, calibration is ongoing, Kiwamu is on the floor, JeffK is doing work on an ITM
7:30 Kiwamu out
10:20 Evan reverts 9 Mhz oscillator
 
For the rest of the night, we've had difficulty locking, for reasons unclear. The lock a couple hours ago broke because some DHARD boosts were disabled as part of troubleshooting.
 
H1 ISC
jenne.driggers@LIGO.ORG - posted 07:01, Wednesday 02 September 2015 - last comment - 16:45, Wednesday 02 September 2015(21133)
Locking shenanigans

[JimW, Jenne, Evan, DanH]

Relocking after we took the IFO down for some Cal measurements about 7 hours ago has been pretty painful.  However, we're back up.  We were back up, before DHARD Pit kicked us out.

Our biggest problem was with some glitches that we think are in one of the mode cleaner mirrors.  They went away after a few hours though, so we aren't really clear on what the problem is.  We see them in MC2 MasterOut channels, so the glitches do exist in the digital system.  But, loops are closed everywhere, so it's tricky to tell where they originate.  While these glitches were present, we couldn't lock ALS for more than a few minutes at a time.  We would lose the lock before we were able to lock the DRMI, much less transition off of ALS.  The 2nd and 3rd attachments show quiet and noisy times, respectively.

Later, we lost lock a few times at Switch_to_QPDs.  Last month, Sheila and I kept adjusting the TRAMP on the reduction of the CARM offset that happens in that state, so I changed it again tonight.  I still don't have any particular understanding of why the speed at which we reduce the CARM offset matters so much.  For a while, we had been making it longer and longer (up to a Tramp of 60 sec), and then eventually reverted to the original 10 second ramp time.  Tonight, I put in the guardian that it should do this ramp over 30 seconds, and it's worked a few times in a row.

Next up was a set of weird PRCL glitches.  The attached lockloss screenshot shows them appearing in PRCL out, and the effect they have on the power recycling cavity's 9MHz buildup.  Some time around here, although I don't remember the exact order of operations (Evan, do you remember?) Evan reverted the 9MHz RF source from the IFR (which he installed during the calibration break earlier in the evening) back to the OCXO.  I don't know if we have a way to tell, other than someone's memory of the time, whether we were on the IFR or the OCXO at the time of this PRCL weirdness.  Anyhow, I think this only caused one lockloss, and it doesn't seem to be there right now. 

We have been seeing DHARD pitch oscillations during the CARM offset reduction for the past few days now.  Sheila and I were going to do some loop measurements last night to see why the loop was so unstable, but last night had its own troubles.  Anyhow, Evan commented out the turn-on of DHARD pitch FM1, "boostLTE".  This boost increases the gain below 1 Hz, but eats about 70 degrees of phase at 1 Hz.  With this commented out, we were finally able to get to DC Readout.  After we were sitting on Nominal Low Noise for a while, DHARD Pit started oscillating.  We saw it in the ASAIR camera, and in the ASC control signals.  My current hypothesis (without doing any measurements...) is that the IFO isn't stable enough for us to handle this semi-delicate loop before the rest of the ASC comes on.  So, I have added FM1 of DHARD Pit back to the guardian, but I put it at the very end of Engage_ASC_Part3 so that it comes on last.  Since it didn't ring up for more than ~30 minutes, I think delaying the boost turn-on should be okay.

The last sticking point didn't cause a lockloss, but it did prevent the guardian from getting to Nominal low noise on its own: The IMC guardian got stuck trying to turn on the ISS.  The ISS guardian has some logic that if the absolute value of the 1-second average of some number (PSL-ISS_SECONDLOOP_SIGNAL_OUT16) is above 2.5, don't turn on the ISS.  If this happens, it returns to the Locked state, but the ISC_Lock guardian is still requesting ISS_ON, so I think it should go back to trying to preparing the ISS, and rechecking this number.  Instead though, it just hangs at the Locked state.  I tried hand-requesting ISS_ON a few times, with the same result.  I don't know what this channel means, and I don't know how conservatively that threshold was set, but to try to get the lock to complete, I temporarily changed the threshold to be 3.5.  (After we got past this state, I put it back to 2.5 and reloaded the guardian, so next lock it will be back to the original threshold).  What is this signal (it's totally unclear from the screens, and I haven't opened up the model to see if I can figure it out)?  What are the consequences of increasing this threshold?  Why is the guardian getting stuck?  I think we need to re-examine this guardian logic. 

Images attached to this report
Comments related to this report
sudarshan.karki@LIGO.ORG - 16:45, Wednesday 02 September 2015 (21153)

PSL-ISS_SECONDLOOP_SIGNAL_OUT16 is the output of the ISS Outer Loop Servo that is fed to the first loop actuator.  If we try to close the loop with a larger value it will create a  DC offset large enough, on the first loop actuator, possibly kicking the ISS out of lock.   All these threshold values were determined from the experience. I dont remember what is the max threshold but probably we should understand why this value is not getting small enough as there is a PID loop that constantly tries to adjust the value.

On the other hand,  if this is happening after the loop is closed at which point the loop threshold value is already decreased to 0.1. At this point, the loop checks that the threshold condition is met before engaging each stage (gain, boost and integrator). If any one of the condition is not met it will open the ISS, go back to IMC LOCKED sate and start preparing ISS again. Looks like this is not happeing either. Hmm. More investigation needed.

H1 AOS
cheryl.vorvick@LIGO.ORG - posted 23:52, Tuesday 01 September 2015 (21128)
OPS EVE Summary:

By UTC time:


9/1

23:00 - Kiwamu relocking IFO

23:42 - IFO to low noise

23:49 - engage ISS 2nd loop - big glitch in IFO


9/2

00:10 - Commissioning starts - Robert, Anamaria - PEM

00:15 - Jamie calls to explain new SDF checks put into Guardian

--- old SDF medm screens that link off of the site map are wrong, I'll try to fix

00:20 - I accept ASAIR offsets - Kiwamu confirmed he set earlier in shift

00:40 - Keita and Evan to electronics room to measure a monitoring point, no injection

00:53 - Robert and Anamaria to EX (or EY)


lock loss:

01:39 - lock loss, lock from 23:49 to 01:39UTC

- reason: it appears that  PEM injections at EY were big enough to effect ISI and caused lock loss


01:40 - Keita and Evan back from electronics room

01:45 - Keita and Evan back to electronics room

01:56 - Keita and Evan back from electronics room


02:12 - IFO to low noise: back to commissioning

02:20 - Robert and Anamaria at EY

03:16 - Robert and Anamaria back from EY

03:17 - Dan and Evan to electronics room


05:02 - observation bit engaged


06:11 - closed fast shutter to break the IFO lock for calibration

- activities:

--- UIM coil drivers - JeffK

--- RF distribution amp - Dan and Evan

--- OMC DCPD characterization - Kiwamu

H1 CAL
kiwamu.izumi@LIGO.ORG - posted 15:36, Tuesday 01 September 2015 - last comment - 17:09, Thursday 30 June 2016(21101)
OMC DCPD signal chain,maybe missing 10-ish kHz pole in our model

In this morning, I checked the OMC DCPD electronics chain (for both A and B) by injecting known sine wave analog signal. This was one of those items that Keita suggested me a while ago.

According to the data, I am concluding that our calibration model needs to add another pole at 10-ish kHz for accurately simulating the OMC whitening circuits.


Method

The measurement method is straightforward -- it is a swept sine measurement in a manual way.

I had a function generator by the HAM6 electronics rack which drove a single-ended-to-differential convertor (D1000931, technically speaking this is a coil driver test box). Then the differential signal is sent to the input of the OMC DCPD whitening board (D1002559, S1101603) by some clipping technique. By the way, the actual cable for connecting the OMC DCPDs were unplugged during the measurement. The excitation amplitude was set to 2 Vp-p at the function generator which resulted in 2 Vp-p in both positive and negative paths at the input of the whitening board as expected accroding to the schematic of the coil driver test box.

I then recorded the data in IOP at the full sample rate using dataviewer for 1 sec for a selected excitation frequency (and for some reason, diaggui did not want to run and hence dataviewer this time). Keeping the same excitation amplitude, I manually stepped the freqyency from 8 kHz to 100 Hz. After every step, I saved the time series of the IOP so that I can make a transfer function later. In addition, I had an oscilloscope with me which kept monitoring the excitation ampitude at the input of the whitening board. The scope told me that the excitation ampltude stayed constant at 2.02 Vp-p in each channel throughtout the measurement. The OMC DCPD had


Analysis and result

To get a transfer function from the data that I took in time series, I decided to do a sine-wave fitting for each data chunk to get the amplitude information. I wrote a small matlab script to do it. It can be found at:

aligocalibration/trunk/Runs/ER8/H1/Scripts/OMCDCPDs/Matlab/OMC_DCPD_AnalogChain_TimeSeries.m

The script utilizes fminsearch and spits out the best fit amplitude for each frequency measurement. Additionally, it places uncertainty or error bar by taking the standard deviation of the residual. Note that this is not a standard way to place an error bar since it does not take the number of measurement points into consideration. According to the fit, the residuals were found to be usually a few counts which is much smaller than the amplitude of signals which was about 2000 counts. So it typically places 0.1% uncertainty after all.

The result is shown in the attached pdf. By the way the lower panel in the plot says, "residual", but it should read "(measured)/(model)" instead. It shows the measured transfer function together with the expected model transfer function for comparison. It is very obvious that the measurement suggests that our model is missing some high frequency pole. The model is merely made of the analog AA response which I have already measured and fitted. Adding some random pole, I could see an extra pole at around 10.7 kHz making the fitting much better. In fact, I sort of knew that there seemed to be a high frequency pole by some other measurements which I did not post. We probably need to add this high frequency pole in our calibration model.

Non-image files attached to this report
Comments related to this report
kiwamu.izumi@LIGO.ORG - 19:28, Tuesday 01 September 2015 (21123)

I have measured and fitted the AA filter response for DCPD A and B (ch13 and ch14 of S1102788 respectively). I used the same coil driver test box to produce differential signal and measured the transfer functions with SR785. The results don't show any unexpected additional high frequency poles.

The plots are shown below in line. The fitting is good up to 10 kHz.


The fitting code can be found at:

/aligocalibration/trunk/Runs/ER8/H1/Scripts/OMCDCPDs/Liso/fit_AA_OMC_DCPD_A.fil

/aligocalibration/trunk/Runs/ER8/H1/Scripts/OMCDCPDs/Liso/fit_AA_OMC_DCPD_B.fil

The analysis/plot code can be found at:

/aligocalibration/trunk/Runs/ER8/H1/Scripts/OMCDCPDs/python/OMC_DCPD_AA_filters.py

The figures in both pdf and png formats are available at:

/aligocalibration/trunk/Runs/ER8/H1/Results/OMCDCPDs/2015-08-27_AA_DCPD_A.pdf

/aligocalibration/trunk/Runs/ER8/H1/Results/OMCDCPDs/2015-08-27_AA_DCPD_A.png

/aligocalibration/trunk/Runs/ER8/H1/Results/OMCDCPDs/2015-08-27_AA_DCPD_B.pdf

/aligocalibration/trunk/Runs/ER8/H1/Results/OMCDCPDs/2015-08-27_AA_DCPD_B.png

Images attached to this comment
Non-image files attached to this comment
kiwamu.izumi@LIGO.ORG - 21:24, Tuesday 01 September 2015 (21124)

Independently of the above measurements, I have measured the entire signal chain of the OMC DCPD A and B by injecting random signals from the extra DAC output in LSC (a.k.a. LSC-EXTRA_AO2).

It also showed a high frequency pole at around 10.7 kHz which is consistent with the result from the manual swept sine described above.


Measurement setup

  • Random noise excitation in LSC-EXTRA_AO2
  • Output of the LSC-EXTRA_AO2 at the ISC rack is connected to a spear RF patch panel and routed all the way to the HAM6 area.
  • In the HAM6 area, the excitation signal is split into two by a BNC tee and drives the A and B inputs (corresponding to ch4 and ch5 respectively) of the whitening board (D1002559, S1101603).
    • Note that this time the connections are made in a single-ended manner, so that it does not exctie the negative leg of the differential receiver in the whitening board.
  • I took a transfer function from the IOP channel of LSC-EXTRA_AO2 and that of OMC DCPD A and B in order to avoid confusion from IOP's up/down-sampling filters.

By the way, in the digital world particularly in the IOP world, LSC-EXTRA_AO2 is called DAC0_CH9, and DCPD A and B are called ADC0_CH12 and CH13 respectively.

AI filter for LSC-EXTRA_AO2 needed to be measured

Since this measurement automatically includes the AI filter for LSC-EXTRA_AO2, we need to subtract this transfer function out of the resultant measurement. So I measured and fitted it (ch10 of S1102761) by using the coil driver test box (D1000931) and a SR7850. Here is the result.

As shown in the plot above, the fitting is good up to 10 kHz. I did not see unexpected high frequency pole. The fitting code, data and results can be found at:

/aligocalibration/trunk/Runs/ER8/H1/Measurements/AAAI/LSC_EXTRA_AO_AI_v2.dat

/aligocalibration/trunk/Runs/ER8/H1/Scripts/AAAI/Liso/fit_AI_LSC_EXTRA_AO.fil

/aligocalibration/trunk/Runs/ER8/H1/Scripts/AAAI/python/LSC_EXTRA_AO2_AIfilter.py

/aligocalibration/trunk/Runs/ER8/H1/Results/AAAI/2015-08-27_AI_LSC_EXTRA_AO.png

/aligocalibration/trunk/Runs/ER8/H1/Results/AAAI/2015-08-27_AI_LSC_EXTRA_AO.pdf

This fitting result is then used in the subsequent analysis as decribed below.


Results

First of all, I attach the measured transfer functions together with the fitting result.

As I noted in the above subsection, the measured transfer functions include

  • AI filter of LSC-EXTRA_AO2
  • AA filter of DCPD A or B
  • flat response of the whitening filters (as I set them to 0dB with no whitening stages engaged)

In my fitting model, I newly inserted a high frequency pole at around 11 kHz as an initial guess. Without this additional high-freq pole, the fitting would be miserable above 1 kHz similarily to the one shown in the above entry or alog 21101. As for the parameters of the AA and AI filters, I have used the fitted parameters and do not try to re-fit them in this anaysis. In other words, the fitting parameters in this analysis are:

  • high-freq pole at around 11 kHz
  • scale factor (which should be close to 0.5 because I am driving only one leg of the differential receiver)
  • delay presumably due to some computation cycle

The below are the raw output from LISO:

#Best parameter estimates:
#pole6:f =  10.7609523979k +- 1.226 (0.0114%)

#Best parameter estimates:
#pole6:f =  10.7183613550k +- 1.209 (0.0113%)

The upper one represetns the fitting result for DCPD A and the lower one for DCPD B. Both of them have a pole at around 10.7 kHz.

Some SVN info

As usual, the data, codes and resultant figures are saved in svn. They can be found at:

/aligocalibration/trunk/Runs/ER8/H1/Measurements/OMCDCPDs/2015-08-27/LSC_AO_OUT_to_OMC_DCPDs_RandNoise_0whitenings.xml

/aligocalibration/trunk/Runs/ER8/H1/Measurements/OMCDCPDs/2015-08-27/IOPCH9to_IOPCH12_0whitening_tf.txt

/aligocalibration/trunk/Runs/ER8/H1/Measurements/OMCDCPDs/2015-08-27/IOPCH9to_IOPCH13_0whitening_tf.txt

/aligocalibration/trunk/Runs/ER8/H1/Scripts/OMCDCPDs/Liso/fit_LSCCH9toOMCCH12_0whitening.fil

/aligocalibration/trunk/Runs/ER8/H1/Scripts/OMCDCPDs/Liso/fit_LSCCH9toOMCCH13_0whitening.fil

/aligocalibration/trunk/Runs/ER8/H1/Scripts/OMCDCPDs/python/OMC_DCPD_AAandWhite.py

/aligocalibration/trunk/Runs/ER8/H1/Results/OMCDCPDs/2015-08-27_DCPD_A_AAand0White.pdf

/aligocalibration/trunk/Runs/ER8/H1/Results/OMCDCPDs/2015-08-27_DCPD_A_AAand0White.png

/aligocalibration/trunk/Runs/ER8/H1/Results/OMCDCPDs/2015-08-27_DCPD_B_AAand0White.pdf

/aligocalibration/trunk/Runs/ER8/H1/Results/OMCDCPDs/2015-08-27_DCPD_B_AAand0White.png


Next step

I will analyze equivalent data with one whitening stage engaged. This is more important because this is likely going to be the configuration we will run during O1.

Images attached to this comment
Non-image files attached to this comment
kiwamu.izumi@LIGO.ORG - 23:00, Tuesday 01 September 2015 (21126)

I have measured the DCPD signal chain in the same fashion as the previous alog, but this time with the 1st whitening stage engaged.

Here is my conclusion:

  • The whitening board seems to consistently show a high frequency pole at around 11 kHz
  • The zero and pole location of the 1st whitening stage seem to be inaccurate by 12% at most
  • We should  re-measure the whitenig board in a wide frequency band

Measurement setup

The measurement setup is the same as the one in the previous alog shown above. I drove LSC-EXTRA_AO2 by random noise and took transfer functions from the IOP test point of LSC-EXTRA_AO2 to that of DCPD A and B. This time the 1st stage whitening filter is engaged with 0 dB gain.

Results

Here are the measured transfer functions with the fitting results.

LISO says:

#Best parameter estimates (for DCPD A):
#pole6:f =  10.8756718522k +- 1.275 (0.0117%)
#pole7:f =  10.3442465820 +- 4.165m (0.0403%)
#zero2:f =  992.1541013425m +- 2.461m (0.248%)
#factor =  500.1410089072m +- 1.112m (0.222%)

#Best parameter estimates (for DCPD B):
#pole6:f =  10.8295424180k +- 1.26 (0.0116%)
#pole7:f =  10.4145450914 +- 4.172m (0.0401%)
#zero2:f =  998.2444937993m +- 2.463m (0.247%)
#factor =  499.8306079302m +- 1.105m (0.221%)


The result suggests that the high frequency pole (called pole6 in the fitting code) moved up by 1-2% from 10.7-ish kHz to 10.8-ish kHz in both DCPD A and B compared with the previous data without the whitening filter engaged. I don't have a good explanation for why they moved up. But the point is that the high frequency pole does exist in the whitening configuration that we want to run during O1. Therefore we should definitely include this pole in our calibration model. Additionally, the measurement done at Caltech also shows a reduction in the magnitude as frequency reaches the end of the measurement frequency band at around 6 kHz (S1101603). Therefore I start believing that this high frequency pole is real and do exist in the whitening boards. I guess this effect was not visible in my intemnsity transfer function measurement (alog 20851) because ASC-AS_C, which was my intensity reference, also uses the same whitening circuit (D1001530) as OMC DCPDs.

Another interesting thing is that LISO reports different poles and zeros for the actual whitening filters than the ones reported in DCC (S1101603, or see nice summary by Koji at alog 17647). The pole location seem to be almost the same at a few % level, but the location of zeros differ by more than 10%. This is not cool. This also makes me think that we should re-measure the whitenig filter response.

SVN info

/aligocalibration/trunk/Runs/ER8/H1/Measurements/OMCDCPDs/2015-08-27/LSC_AO_OUT_to_OMC_DCPDs_RandNoise_1whitenings.xml

/aligocalibration/trunk/Runs/ER8/H1/Measurements/OMCDCPDs/2015-08-27/IOPCH9to_IOPCH12_1whitening_tf.txt

/aligocalibration/trunk/Runs/ER8/H1/Measurements/OMCDCPDs/2015-08-27/IOPCH9to_IOPCH13_1whitening_tf.txt

/aligocalibration/trunk/Runs/ER8/H1/Scripts/OMCDCPDs/Liso/fit_LSCCH9toOMCCH12_1whitening.fil

/aligocalibration/trunk/Runs/ER8/H1/Scripts/OMCDCPDs/Liso/fit_LSCCH9toOMCCH12_1whitening.fil

/aligocalibration/trunk/Runs/ER8/H1/Scripts/OMCDCPDs/python/OMC_DCPD_AAand1White.py

/aligocalibration/trunk/Runs/ER8/H1/Results/OMCDCPDs/2015-08-27_DCPD_A_AAand1White.png

/aligocalibration/trunk/Runs/ER8/H1/Results/OMCDCPDs/2015-08-27_DCPD_B_AAand1White.pdf

/aligocalibration/trunk/Runs/ER8/H1/Results/OMCDCPDs/2015-08-27_DCPD_B_AAand1White.png

/aligocalibration/trunk/Runs/ER8/H1/Results/OMCDCPDs/2015-08-27_DCPD_B_AAand1White.pdf

Images attached to this comment
kiwamu.izumi@LIGO.ORG - 01:45, Wednesday 02 September 2015 (21131)

This should be a killer measurement for this long discussion which was triggered by the unexpected high frequency pole-ish behavior in the DCPD signal chain. I have measured the transfer function of the DCPD whitening filter using an SR785 tonight.

The current conclusions are that:

  • A measurement of the whitening filter tells that we need to have two poles at high frequencies-- one at around 18 kHz and the other ar around 14 kHz
    • ( In addition, another pole at 98 kHz gives us a better fitting )
  • The whitening zero-pole pairs need to be updated in the calibration model and perhaps in the OMC front end model in order to accurately compensate the filter response.


Motivation

There seemed to be one or perhaps multiple high frequency pole(s) at a frequency on the order of 10 kHz. We wanted to include them in the calibration model to be mroe accurately model the phase and time delay. Besides, independtly of the high frequency poles, we noticed that the whitening zero-pole pairs were not precisely at the frequencies specified in the DCC document of an early measurement (S1101603). These two things pushed us to re-measure the analog transfer function of the whitening filter, in particular the first stage which is the one we usually use in full lock.

Measurement

I again used the coil driver test box only for the reason that I wanted a single-ended-to-differential convertor. With an SR785, I performed a swept sine measurement for ch4 and ch5 which correpond to DCPD A and B respectively. The 1st stage of the whitening filter was engaged while the rest are disabled for both A and B whitening filters. The whitening gain was set to 0 dB for both A and B. These settings are nominal that we usually operate in full lock. The exctiation amplitude was 200 mVp-p in the positive and negative inputs which resulted in 2 Vp-p at highest at the positive and negative outputs. With a scope, I confirmed that there was an obvious distortion or saturation in the signal at the outputs.

Results

I fitted the measured data with four poles and one zero. See the fitting results shown below.

As shown in the plot, the fitting is good from 1 Hz to 10 kHz at 0.1% level in absolute amplitude and 0.02 deg level in the phase. Here are the raw output from LISO.

#Best parameter estimates (for DCPD A):
#pole0:f =  18.6402825833k +- 20.23 (0.109%)
#pole1:f =  14.5121291389k +- 12.5 (0.0861%)
#pole2:f =  98.9771014448k +- 60.89 (0.0615%)
#pole3:f =  10.2675781089 +- 660.2u (0.00643%)
#zero0:f =  973.9581771978m +- 151.1u (0.0155%)
#factor =  993.7495082788m +- 129.2u (0.013%)


#Best parameter estimates (for DCPD B):
#pole0:f =  18.4126906482k +- 21.61 (0.117%)
#pole1:f =  14.6312083283k +- 13.88 (0.0949%)
#pole2:f =  98.3231767285k +- 60.51 (0.0615%)
#pole3:f =  10.3405121747 +- 667u (0.00645%)
#zero0:f =  980.5696173840m +- 152.8u (0.0156%)
#factor =  993.4759822630m +- 129.8u (0.0131%)


In order to get a better fitting, I ended up adding three poles at high frequencies -- two of them seem to stay between 10 and 20 kHz while the third one tends to be at around 98 kHz. I did not need to have a delay at all because this is just an analog circuit.

SVN info

/aligocalibration/trunk/Runs/ER8/H1/Measurements/OMCDCPDs/2015-09-02/DCPD_A_1whitening.dat

/aligocalibration/trunk/Runs/ER8/H1/Measurements/OMCDCPDs/2015-09-02/DCPD_B_1whitening.dat

/aligocalibration/trunk/Runs/ER8/H1/Scripts/OMCDCPDs/Liso/fit_whitening_1st_stage_DCPD_A.fil

/aligocalibration/trunk/Runs/ER8/H1/Scripts/OMCDCPDs/Liso/fit_whitening_1st_stage_DCPD_B.fil

/aligocalibration/trunk/Runs/ER8/H1/Scripts/OMCDCPDs/python/whitening_1st_stage.py

/aligocalibration/trunk/Runs/ER8/H1/Results/OMCDCPDs/OMCDCPDs/2015-09-02_whitening_1st_stage_DCPD_A.pdf

/aligocalibration/trunk/Runs/ER8/H1/Results/OMCDCPDs/OMCDCPDs/2015-09-02_whitening_1st_stage_DCPD_A.png

/aligocalibration/trunk/Runs/ER8/H1/Results/OMCDCPDs/OMCDCPDs/2015-09-02_whitening_1st_stage_DCPD_B.pdf

/aligocalibration/trunk/Runs/ER8/H1/Results/OMCDCPDs/OMCDCPDs/2015-09-02_whitening_1st_stage_DCPD_B.png

Images attached to this comment
Non-image files attached to this comment
koji.arai@LIGO.ORG - 02:32, Thursday 03 September 2015 (21168)

Are these above-Nyquist-freq poles the ones I've reported with LHO ALOG 17647?
If so, they are the high freq poles associated with the OMC DCPD in-vac preamps.
Since they exist above the Nyquist frequency (~8kHz), it is not straight forward to compensate them.

As they show up like a linear time delay at low freq, we decided to leave them uncompensated in April. (Refer Daniel S, Jeff K).
This corresponds to ~18us delay. I thought this was already accommodated in the DARM calibration model described in LHO ALOG 17951
and the following comments (particularly in LHO ALOG 18037). Were they dropped at some point?

kiwamu.izumi@LIGO.ORG - 07:12, Thursday 03 September 2015 (21171)

Koji,

No. They are not the ones in DCPDC's preamp. These poles are found in the whitening board by directly measuring it.

As for preamp's super-nyquist poles, they have been incorporated in our calibration model and  have been actually used in the upsampled FIR pipeline without approximating it as a time delay. So we did not drop the ones from the preamp.

kiwamu.izumi@LIGO.ORG - 12:16, Thursday 03 September 2015 (21184)

For double chek my conclusion written above, I went back to the original plot in alog 21101. With the newly discovered high frequency poles of the whitening board (alog 21131) included, the measurement agrees with the model with 1-ish % descrepancy up to 5 kHz in magnitude as shown in the attached plot.

This is good enough .


The code and figure:

 /aligocalibration/trunk/Runs/ER8/H1/Scripts/OMCDCPDs/Matlab/OMC_DCPD_AnalogChain_TimeSeries.m

/aligocalibration/trunk/Runs/ER8/H1/Results/OMCDCPDs/2015-09-01_OMC_DCPDs_timeseries_analysis.pdf

Non-image files attached to this comment
kiwamu.izumi@LIGO.ORG - 17:09, Thursday 30 June 2016 (28101)

The data for the whitening filters in the above entries are obsolete as of 30/6/2016.

The whitening chassis was replaced by a different unit on June 28th in 2016 (alog 28010). A new measurement was taken on June 30th in 2016 (alog 28087).

H1 ISC
keita.kawabe@LIGO.ORG - posted 12:48, Tuesday 01 September 2015 - last comment - 17:28, Wednesday 02 September 2015(21094)
Harmonic generator testing (Filiberto, Keita)

We pulled both the power supply and the harmonic generator from the remote rack and tested them in the lab, together with spare supply and spare generator. We used a spare 9.1MHz source on the bench.

In the lab, regardless of the combinations (supply and generator), 45MHz thing was clean.

In the rack, we tested the original generator with spare and original supply, with 9.1MHz source coming from the distributor in the rack. In both of the cases there were huge 45+-2MHz-ish humps.

Evan reported in the past that using IFR at the rack didn't change the results, so we didn't bother to look at 9.1MHz source.

In all of these test cases both in the lab and rack, the only thing connected to the harmonic generator was power supply, 9.1MHz source and the network analyzer on 5x output. Everything else was terminated.

We also looked at the supply voltage in the lab. We opened the chassis and used clips to access gnd and +15V test points. Under the load, both of the units didn't show any huge high frequency noise. RMS voltage measured on the scope was about 1mV, which was dominated by some pickup (it got smaller when I hand held the chassis away from the 9.1MHz source). Fil also measured the spectrum and it was within the spec. And anyway, the harmonic generator didn't show any hump in the lab, so the power supply is pretty much exonerated.

Fil put the original units back in.

Comments related to this report
rich.abbott@LIGO.ORG - 13:17, Tuesday 01 September 2015 (21098)ISC
Do the other harmonic harmonic generator output spigots have excess sideband noise?
evan.hall@LIGO.ORG - 14:03, Tuesday 01 September 2015 (21100)

Rich, yes. I took measurements of some of the other ports of the HG in the CER a few days ago (measurements attached).

001.TXT: 45 MHz output

002.TXT: 27 MHz output

004.TXT: 135 MHz output

005.TXT: 90 MHz output

007.TXT: 36 MHz output

Non-image files attached to this comment
rich.abbott@LIGO.ORG - 16:48, Tuesday 01 September 2015 (21113)
There's a clue in the data files you attached.  Looking at the plot of the 45 MHz, you see side lobes at +/- 1MHz.  Looking at the plot of 90 MHz, and 135 MHz you see side lobes with the same offset frequency.  If the source of the pollution was coming into the input of the harmonic generator, then the peaks of the side lobes would scale with frequency.  Given that this is not the case, you are looking for something that effects each frequency directly.  In my opinion, that would most likely point to a power supply issue causing phase modulation of an amplifier common to each output spigot (based on the observation that the induced modulation is about the same in each channel and assuming that's the physical topology of the HG).  

There is 50dB of separation between the peak of the carriers and the side lobes, so you can produce a spectrum like that with a pretty small 1 MHz noise hump on a power supply rail.  I would be wanting to look at the HG power supply directly with an RF spectrum analyzer (be sure to AC couple the power supply to the spectrum analyzer or else you will need to buy a new spectrum analyzer, 1000pF would suffice)

I don't know exactly how you are measuring these noise peaks, but I guess it could also be something in the particular spectrum analyzer (if you are using a different analyzer in the shop for example).  Have you looked at a "clean" signal to be sure you don't see it on all observed signals with that particular analyzer?  Sorry if this is simplistic, you may well have already vetted this and wrote about it only to have me forget somewhere.

I now wish I had popped the top on the HG and its power supply.  I have been itching to do that for a while, but missed the opportunity while I was there this weekend.  I'd be super interested to see a photo of the insides if anyone felt like looking...
daniel.sigg@LIGO.ORG - 00:28, Wednesday 02 September 2015 (21129)

The power supply is a LIGO low noise unit boxed into a standard chassis. More details here. Possible points of investigations: power cable shielding, power decoupling at the generator side, grounding issues.

evan.hall@LIGO.ORG - 05:21, Wednesday 02 September 2015 (21132)

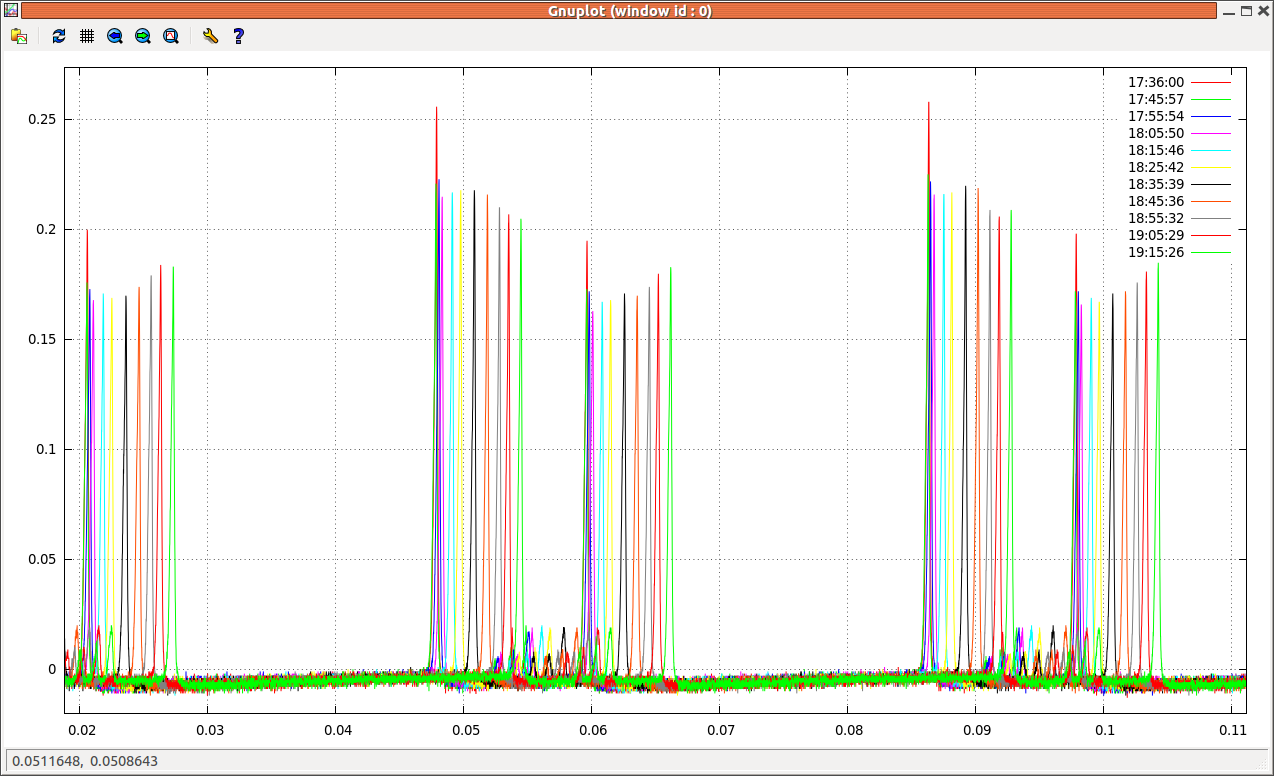
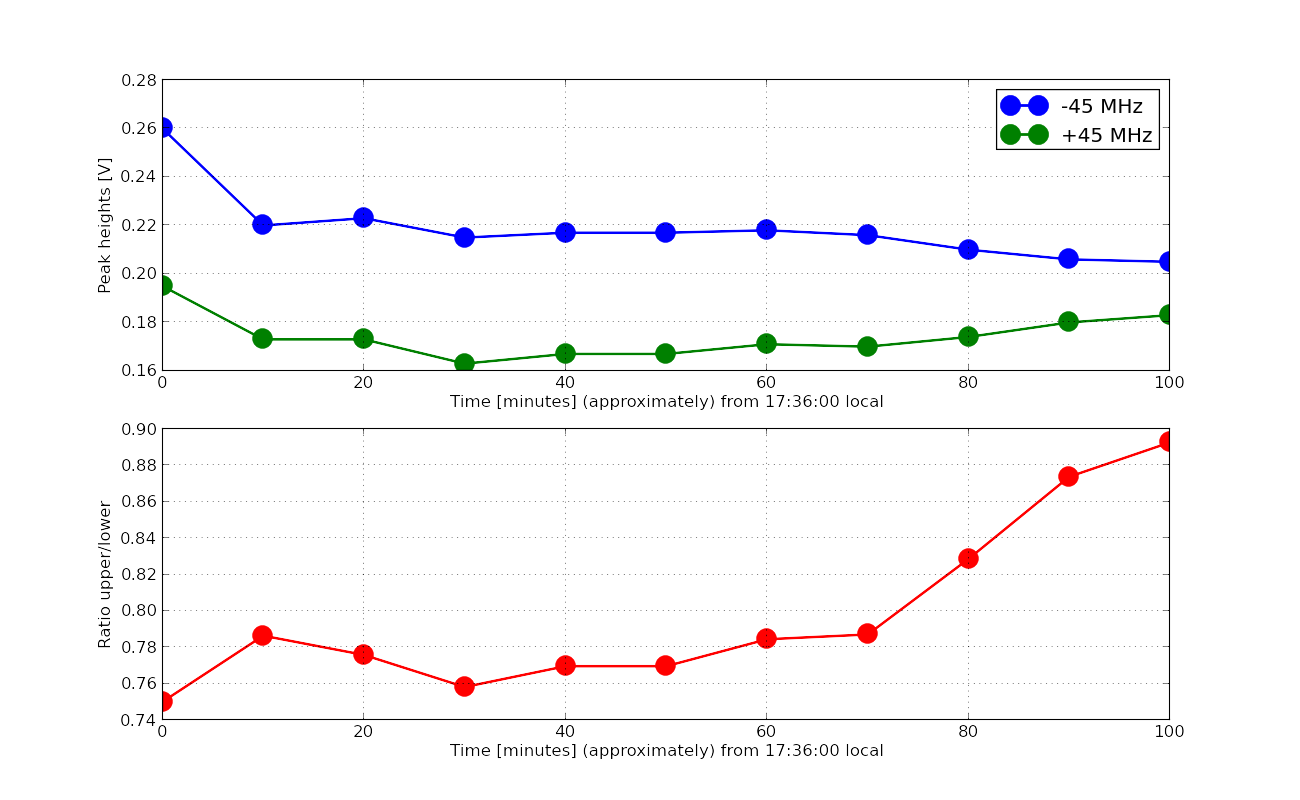
I went back and looked at the IFR data from a few days ago, and it seems that this may be a problem with the 9 MHz coming from the OCXO. The first attachment shows the output of the harmonic generator when powered from the IFR versus the OCXO. The IFR measurement still has peaks around the 45 MHz, but they are much smaller than with the OCXO.

As a check, Dan and I measured the spectrum directly out of the IFR and out of the OCXO (no distribution amplifier involved). In both cases, the spectrum on either side of 9.1 MHz looks pretty clean, but the OCXO has much worse noise between 0 and 2 MHz, and the shape qualitatively matches the peaks that are seen on the outputs of the harmonic generator.

We also did some related tests, like looking at the 45 MHz spectrum of the spare HG when powered from the 9 MHz distribution amplifier. This spectrum has the same huge peaks as the primary HG.

Keita and I looked at the noise from the ±15 V power supply, but we didn't see anything outrageous. As advised, we ac coupled the spectrum analyzer with 1 nF. The spectrum seemed to be roughly a few hundred nV/Hz1/2 out to a few megahertz, but we found it hard to get a clean measurement.

Non-image files attached to this comment
rich.abbott@LIGO.ORG - 10:52, Wednesday 02 September 2015 (21137)
I misspoke.  The offset frequency of PM or FM sidebands in a multiplied spectrum remains constant, but the sideband power scales with the multiplication factor.  

9.1MHz carrier (W) with sinusoidal sideband (Wm) before multiplication:
COS[W*t + A*SIN(Wm*t)]

Derivative of argument for angular Frequency:
W + A*Wm*COS(Wm*t)

After frequency multiplication of factor N:
N*W + N*A*Wm*COS(Wm*t)

Sideband frequency unchanged, power scaled by N

That being said, the sideband power is not scaling by N in the data I saw posted.  The carrier could still be amplitude modulated, but I don't see how it could be phase or frequency modulated.  Sorry for my earlier flawed theory on frequency multiplication.

If someone would please figure this out, I could do a much better job of warping theory to fit observation.

Conclusion:  There might be AM being induced on either on the 9.1MHz carrier, or somewhere inside the harmonic generator - for what little that does to help.

daniel.sigg@LIGO.ORG - 12:51, Wednesday 02 September 2015 (21144)

The direct RF spectrum of the 9.1MHz shows no side lopes at 1-2MHz offset. This describes the total power including both AM and FM sidebands. Odd harmonics generators are typically squaring up the fundamental and then filter out the desired frequency. So, they should be first order insensitive to AM.

rich.abbott@LIGO.ORG - 17:28, Wednesday 02 September 2015 (21159)
You are right about the limiting Daniel.  Evan saw sidebands on the OCXO input too.  I attach a plot of the 45.5, 91, and 135 MHz spectra frequency shifted for relative comparison (Data taken from earlier post).
Non-image files attached to this comment
H1 ISC (SEI, SUS)
nutsinee.kijbunchoo@LIGO.ORG - posted 12:53, Saturday 29 August 2015 - last comment - 00:50, Wednesday 02 September 2015(21009)
Windy lockloss coherence

Kiwamu, Nutsinee

As we were trying to relock the ifo after several locklosses due to high wind (50mph), we noticed the sideband signals wiggled a lot before another lockloss at DC_READOUT (wind speed ~35-40 mph). We found a coherence between POP18, POP19, POP_A_LF, AS90 and PRM, SRM, BS which indicates that the DRMI was unstable. The BS ISI Windy blends weren't turned on. 

Images attached to this report
Comments related to this report
kiwamu.izumi@LIGO.ORG - 16:47, Saturday 29 August 2015 (21011)

One of the two lock losses seemed to be associated with PRM saturation. We heard of the saturation alarm voice pointing PRM DAC in full lock mutiple times before the lockloss in NOMINAL_LOWNOISE. I am not sure if this is the direct cause, but as shown in the attached, PRM had been experiencing ~20 sec oscillation in longitudinal which used to be a big issue in the past (alog 19850). At that point wind was around ~40 mph on average. Also, I attach spectrum of each coil on the M3 stage. It is clear that the components below 0.1 Hz are using up the DAC range when wind is high.

Images attached to this comment
evan.hall@LIGO.ORG - 13:24, Monday 31 August 2015 (21055)

Just as a check, I remade Kiwamu's plot for PRM, SRM, and MC2, with all the stages that are used for actuation.

At this point, the wind ine corner station varied between 3 and 13 m/s. The 30 mHz 100 mHz BLRMSs were about 0.02 µm/s in the CS Z (consistent with sensor noise), 250 µm/s for EX X, and 250 µm/s for EY Y.

Since this time, we have increased the offloading of PRM and SRM to M1 by a factor of 2, but we probably need an even higher crossover in order avoid saturation during these times. It may have the added benefit of allowing us to stay locked during even windier times. Additionally, MC2 does not look like it needs any work on its crossovers in order to avoid saturation.

Images attached to this comment
evan.hall@LIGO.ORG - 00:50, Wednesday 02 September 2015 (21130)

The above comment should say 0.25 µm/s for EX X and EY Y.

H1 CAL (ISC, SUS)
jeffrey.kissel@LIGO.ORG - posted 22:54, Monday 24 August 2015 - last comment - 22:59, Tuesday 01 September 2015(20846)
H1 SUS ETMY Coil ESD Drivers Measured to High Precision
J. Kissel

For efforts of limiting systematics in the calibration, I've measured all ISC controlled stages of ETMY drivers, UIM, PUM, and TST. For now, I just attach screen shots of the measurements and report where they live, such that LLO might repeat exactly the same measurements tomorrow (instead of their current plan to take the measurements in analog, lugging around an SR785). In the fullness of time, I'll fit these to get precise poles and zeros for use in the DARM model.

I can already tell that they will be different from what has been quoted as cannon -- LLO aLOG 4495 -- which is upon what all ETM current *coil* driver compensation filters are based. For example, for some reason, the z:p = 50:300 [Hz] filter on the output impedance network of the UIM drivers, seems to have disappeared. It was supposed to have moved up in frequency when we increased the drive strength (see T1400223 and E1400164) but not disappear. It shouldn't matter for the calibrating, but this is just rediculousness that should be investigated lest we're being misinformed about the frequency region we do care about by a bogus measurement.

Anyways, I'll do a similar study to what was done in LLO aLOG 4495 with this data, and we will compensate the calibration accordingingly.

Details:
------------------
In order to 
(1) speed up measurements 
(2) focus drive amplitude and number of cycles in the frequency regions which were needed, and
(3) yield the ability to do multiple slow measurments simultaneously
I split the measurements for each driver into several templates with differing frequency bands. Ideally, if I weren't inventing, completing, and hoping to analyse it all to give me a very precise result in one day, I would have used the SEI group's Schroeder-phased TF tool, which has such flexibility, but alas.

The templates live and have been committed to here:
/ligo/svncommon/CalSVN/aligocalibration/trunk/Runs/ER8/H1/Measurements/Electronics/
For ESD Driver in low-noise configuration:
2015-08-24_H1SUSETMY_ESDLVLNDriver_WhiteNoise_0p5Hzto1kHz_$(QUADRANT)_TF.xml
2015-08-24_H1SUSETMY_ESDLVLNDriver_SweptSine_50Hzto1kHz_$(QUADRANT)_TF.xml
2015-08-24_H1SUSETMY_ESDLVLNDriver_SweptSine_500Hzto7kHz_$(QUADRANT)_TF.xml

For ESD Driver in high-range configuration:
2015-08-24_H1SUSETMY_ESDHVDriver_WhiteNoise_0p5Hzto1kHz_$(QUADRANT)_TF.xml
2015-08-24_H1SUSETMY_ESDHVDriver_SweptSine_50Hzto1kHz_$(QUADRANT)_TF.xml
2015-08-24_H1SUSETMY_ESDHVDriver_SweptSine_500Hzto7kHz_$(QUADRANT)_TF.xml

For PUM Driver (each template covers all quadrants)
2015-08-24_H1SUSETMY_PUMDriver_SweptSine_0p1to30Hz_$(FILTERSTATE)_TF.xml
2015-08-24_H1SUSETMY_PUMDriver_WhiteNoise_1to7000Hz_$(FILTERSTATE)_TF.xml

For UIM Driver (each template covers all quadrants)
2015-08-24_H1SUSETMY_UIMDriver_WhiteNoise_0p1to900Hz_$(FILTERSTATE)_TF.xml
2015-08-24_H1SUSETMY_UIMDriver_WhiteNoise_0p1to7000Hz_$(FILTERSTATE)_TF.xml

Regarding the system set-up, I took advantage of the secret coil driver switching ability (revealed in, for example, on page 8 of G1401184), to turn off the digital compensation filters, and drove through the either the ESDOUTF bank for L3/ESD or the TEST bank for L1 and L2. Note, though I turned off the frequency dependent compensation, I did not turn off any of the OUTF gain and sign compensation (which is why some of the PUM and UIM driver's signs are flipped with respect to each other). I'll take this into account during post-processing.

Also, I've used the 65 [kHz] IOP test point SUS AUX monitor channels as my response channels. I discovered all too quickly that we've been running all of our AUX monitor models at 2048 [Hz].  Sadly, because we ('ve been told we) must develop a very precise inverse actuation filter for the hardware injection team, we need to get information about the high (but not super-nyquist) frequency poles which we compensate for in the DARM ESD path (namely, the ~3250 [Hz] zero -- see LHO aLOG 18769 and LHO aLOG 18579). Not only does a sampling rate of 2048 prevent measuring such zeros, there's also severe distortion from the 65 [kHz] to 2 [kHz] very aggressive IOP down sampling filter. Yes, we know the shape, but it's just much less confusing to not include it in the measurement. However, comparing the IOP test points against the user model versions of the channels did provide good sanity checks. It for example allowed me to identify that -- even though we fixed the user-model channel ordering of the monitors for the low-noise driver, we haven't yet fixed them for the high-voltage monitors, so the Lefts are still reversed from the Rights.
Images attached to this report
Comments related to this report
jeffrey.kissel@LIGO.ORG - 22:59, Tuesday 01 September 2015 (21127)
More on this screwy UIM driver result:

I've quickly processed the measurement, just to better show the world that this UIM driver is totally confusing. 

Again, the measurement is from the TEST L bank (otherwise empty, gain of 1.0) of the UIM to the IOP Channel of the FAST I MON. During the measurement, all digital compensation of poles and zeros are OFF. This means the signal chain of the measurement is
Drive [ct] > 
    Euler2OSEM Matrix Element (E2O) > 
        Coil Balancing Gain (CBG) > 
            IOP 16k-65k AI(f) > 
                DAC [V/ct] (G_{DAC}) > 
                    Analog AI(f) [V/V] > 
                        Coil Driver [A/V] > 
                            FAST I Monitor Board [V/A] > 
                                Analog AA(f) [V/V] > 
                                    ADC [ct/V] (G_{DAC})> 
                                        IOP Response [ct]
That means, to calibrate this measurement of (IOP Response [ct] / Drive [ct]) into the [A/V] of the coil driver, I must divide out the frequency response one 16k-65k IOP upsampling or "AI" filter, the two identical analog AA and AI filters, and multiply by the following gains,

                  R24_{MON}       1                   1     1       1               [ A/V ]
DC calibration  = --------- x ---------- x G_{ADC} x --- x --- x ------- = 0.024954 -------
                  R25_{MON}   2 R5_{UIM}             E2O   CBG   G_{DAC}            [ct/ct]

where the response is calibrated with R24_{MON} (= R27 = R29 = R33) = 30k [Ohm] and R25_{MON} (= R35) = 10k [Ohm] which are the gain resistors on the differential-to-single-ended amplifier on the fast current monitor on the monitor board (D070480), coupled with the output impedance of the UIM driver R5_{UIM} (= R23) = 2000 (D070481, with the more up-to-date T1400223), a factor of two from the current monitor math, and G_{ADC} = 40[V] / 2^16 [ct]. For the drive, the Euler-to-OSEM matrix element E20 = 0.25, the coil balancing gain for UL = 0.957, and the gain of the DAC, G_{DAC} = 20 [V] / 2^18 [ct].

With the above calibration, I get the attached plot. I show the UIM's UL coil (the magnitude shows the same response for all four coils).

Where we expect the C12, R104, R4, and R5 output impedance network in the UIM driver D070481 to yield a zero:pole pair of (now) 85:300 [Hz] that is a default frequency response in all states, we see none. State 1, where all low pass filters are OFF, makes this dreadfully obvious.

Even worse, with the DC gain calibration as described above, I do not reach the nominal 0.62 [mA/V] that T1400223 claims either, I get 0.28 [mA/V]. 

Gross!

If the H1-SUS Rack DCC file card for ETMY is up-to-date (S1301920), the serial number of this chassis is S0900304. This is consistent with the modification aLOG LHO aLOG 11514. Unfortunately, though the traveler was updated, the test plan is just a copy-and-paste of the acceptance testing prior to modification.

When the oppurtunity strikes, I'm going to take measurements of the other UIM drivers to confirm that I'm not insane. 
Non-image files attached to this comment
Displaying reports 57421-57440 of 78016.Go to page Start 2868 2869 2870 2871 2872 2873 2874 2875 2876 End