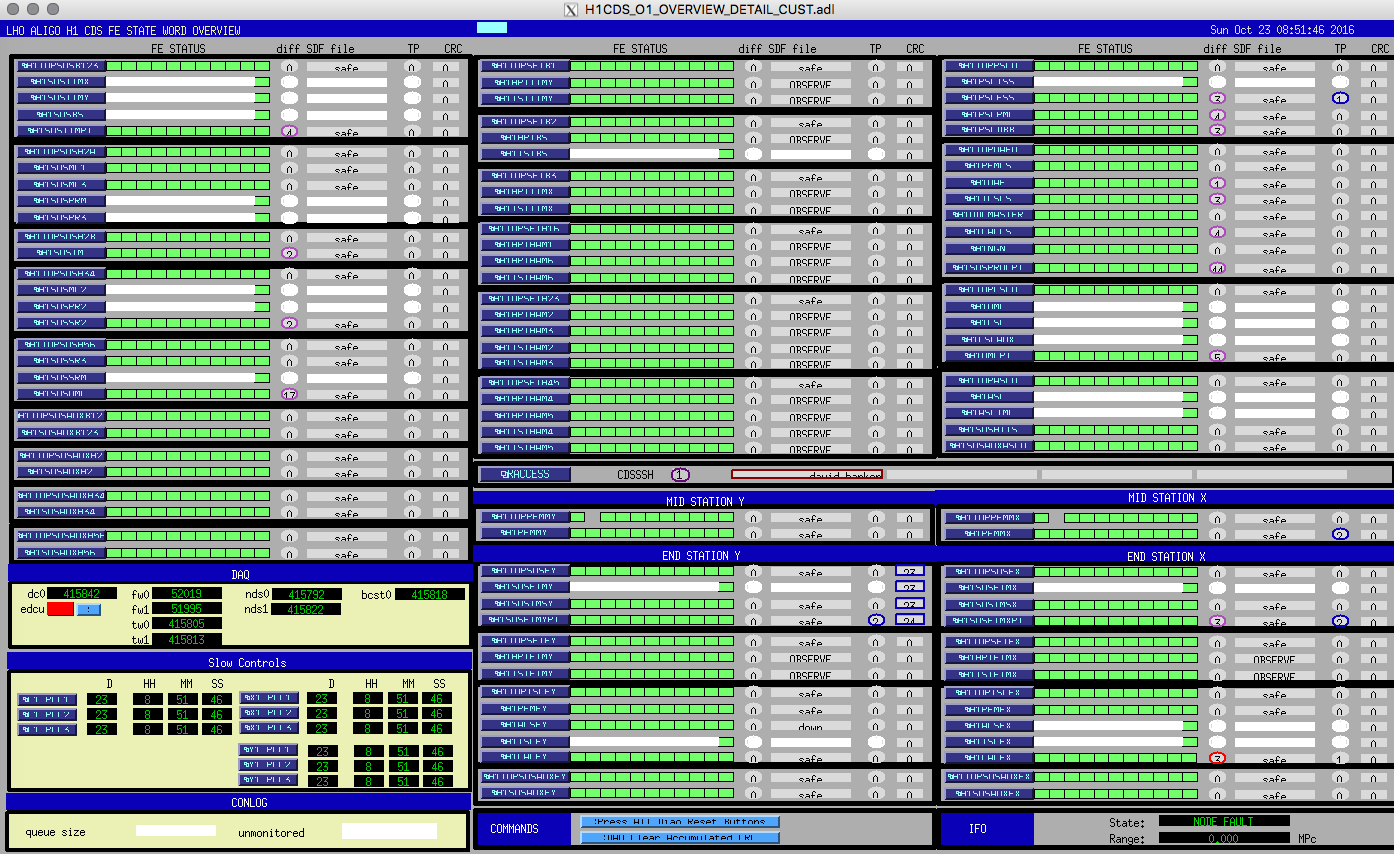
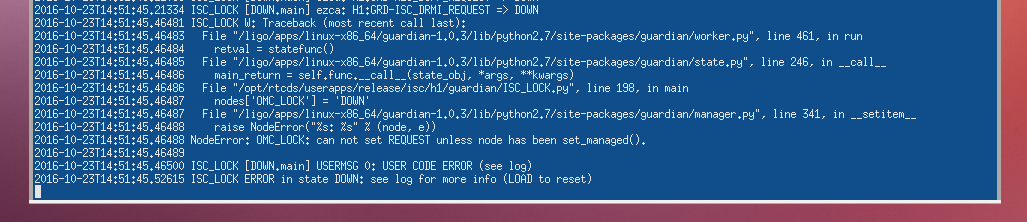
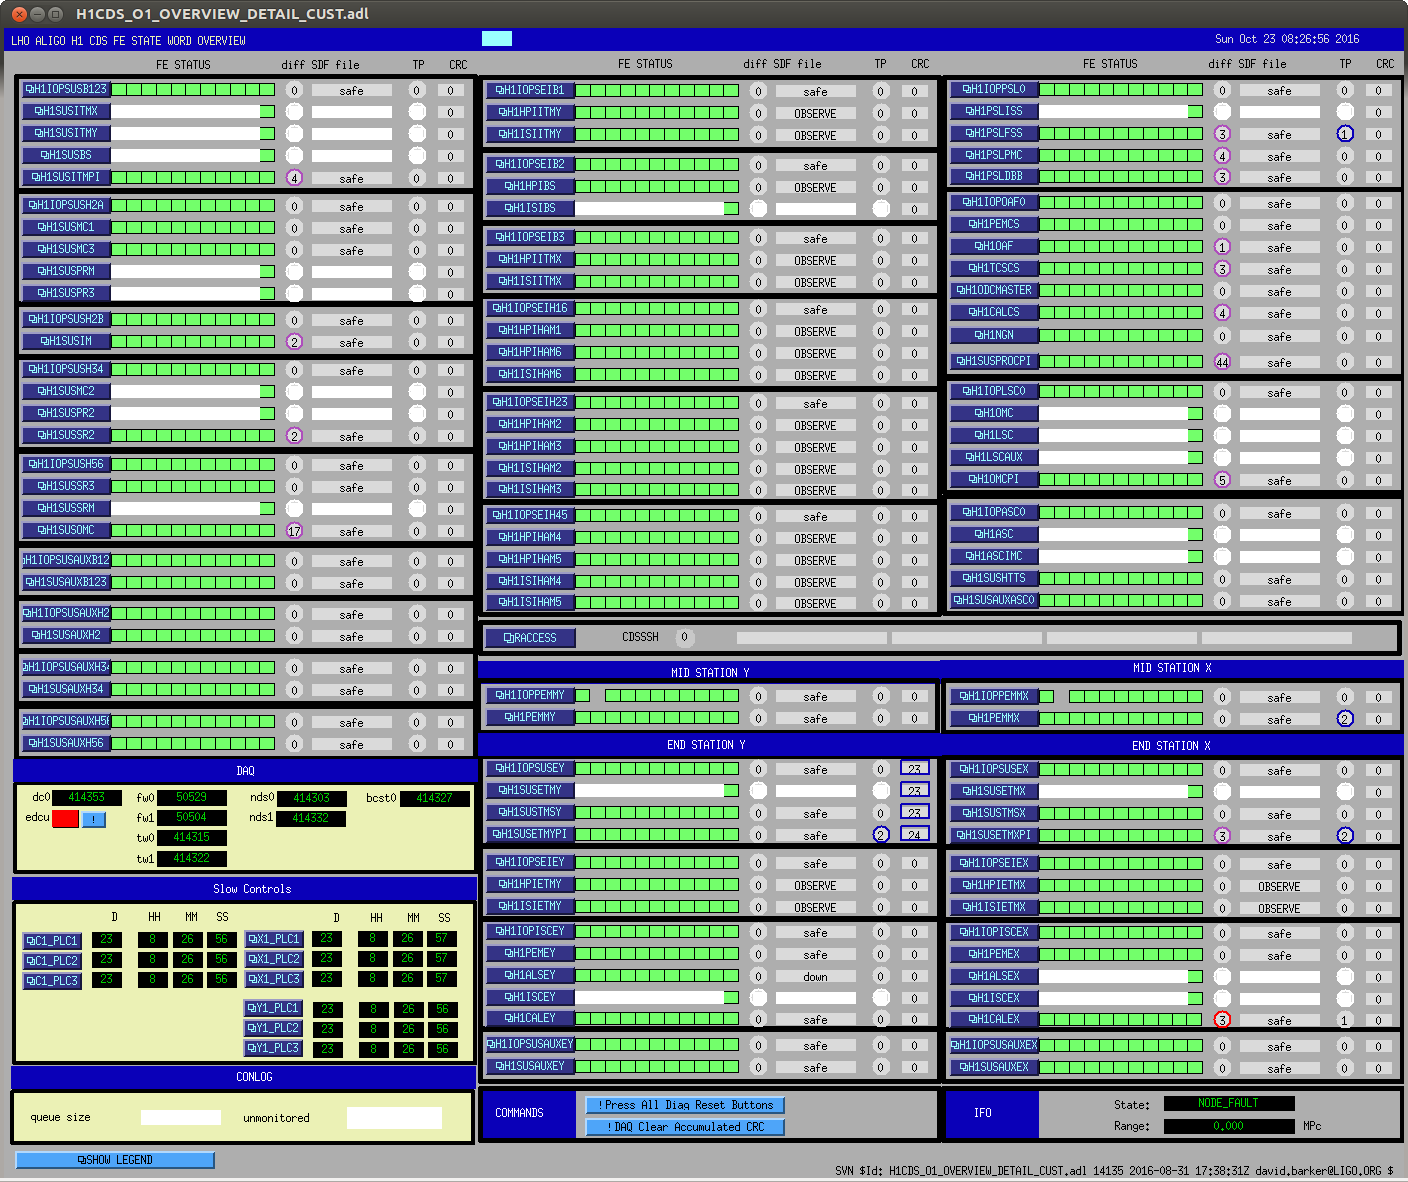
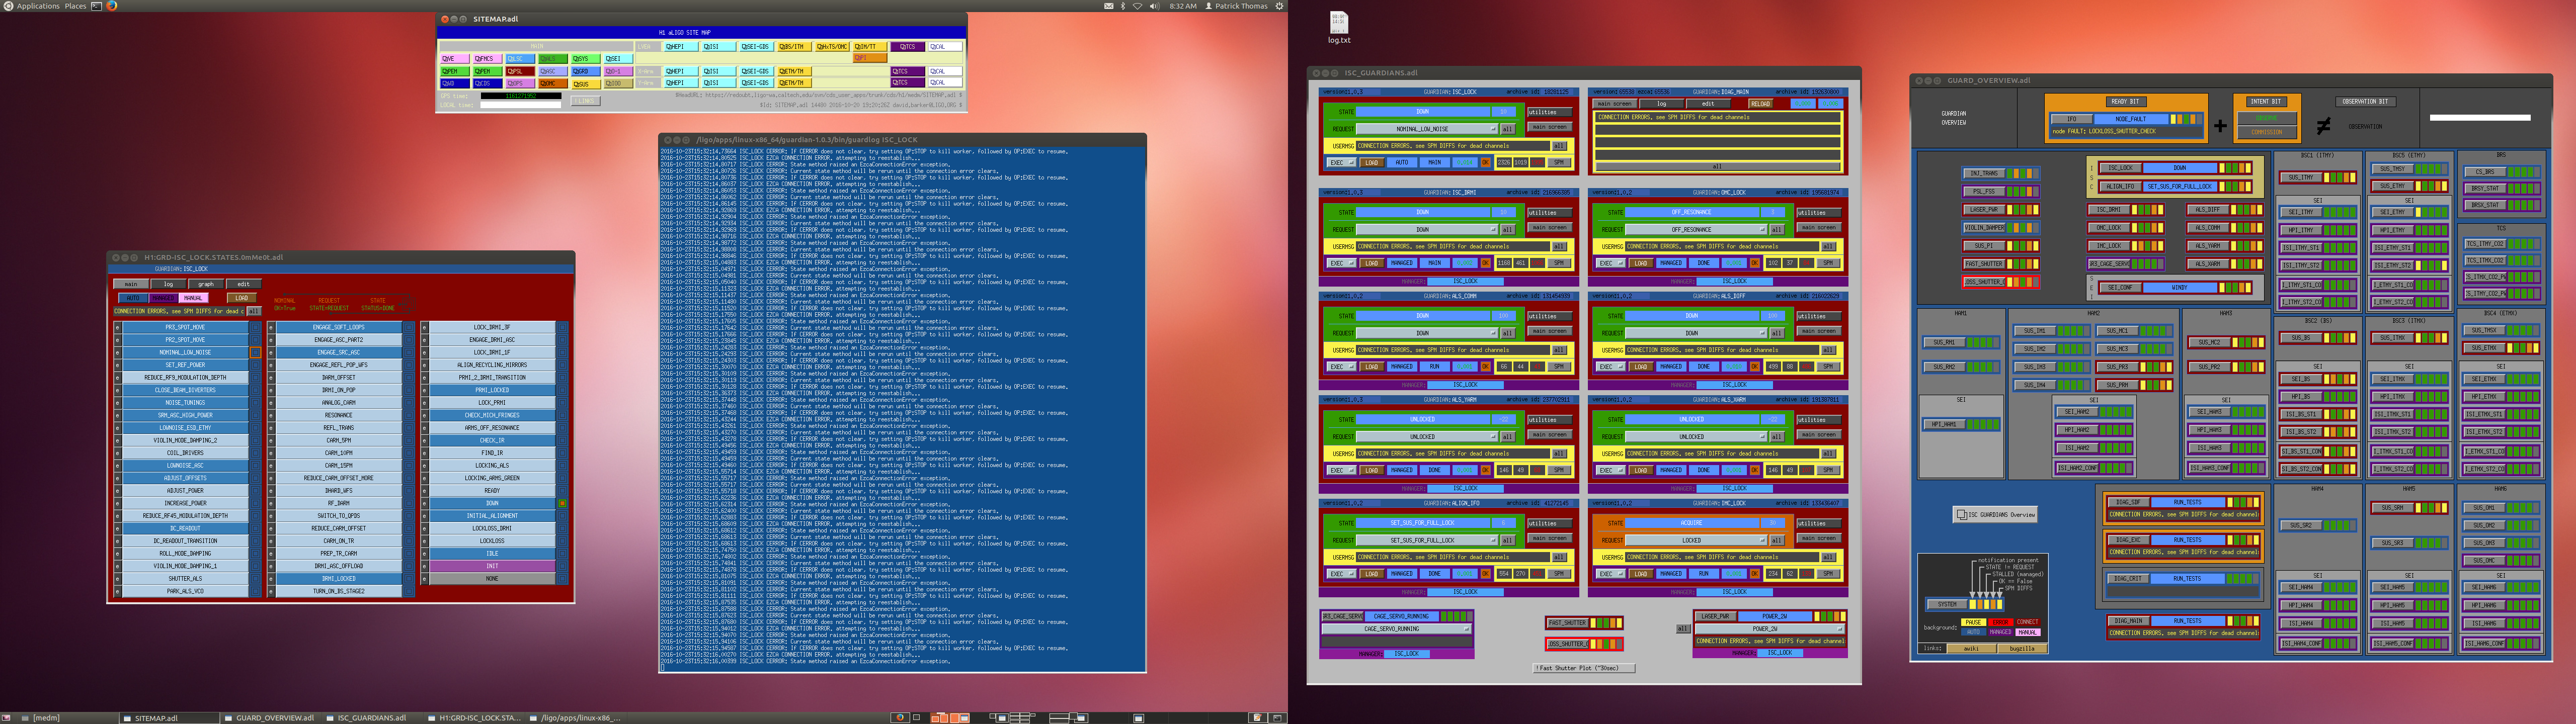
Displaying reports 57501-57520 of 86131.Go to page Start 2872 2873 2874 2875 2876 2877 2878 2879 2880 End
Reports until 02:06, Thursday 01 September 2016
H1 ISC
jenne.driggers@LIGO.ORG - posted 02:06, Thursday 01 September 2016 (29430)
Work toward low noise tonight

[Sheila, Kiwamu, Terra, Jenne]

Next up:  Try dither loop to hold ETMX spot position in yaw to prevent spot position movement on BS.  Separate SOFT loops to X and Y, use offset of XSOFT yaw to hold ETMX spot position constant.  Alternatively (or simultaneously), dither BS and demodulate with several different signals at the same time, to understand better how the spot is moving.

We ended up moving PR2 (our uncontrolled recycling optic), and walking it with the POP_A offset.  This allowed us to get to a PRC gain of 31.6 by the O1 standard, but without the sideband powers tanking.  We think that this was promising, and will come back to it tomorrow.  Once we decide that we're happy, we should re-do the green initial alignment setpoints yet again (including the beatnote PDs, which weren't done earlier today) to set this as our reference alignment.  Attached is a big screenshot of where we were most happy.  Also attached is the PR2 offset screen, time-machined back to before we started moving PR2. 

Images attached to this report
LHO General
thomas.shaffer@LIGO.ORG - posted 00:02, Thursday 01 September 2016 (29429)
Ops Eve Shift Summary

TITLE: 09/01 Eve Shift: 23:00-07:00 UTC (16:00-00:00 PST), all times posted in UTC
STATE of H1: Lock Aquisition
INCOMING OPERATOR: Sep
SHIFT SUMMARY: Lots of commissioning, a PSL trip, and a small earthquake.
LOG:

H1 CDS
david.barker@LIGO.ORG - posted 22:20, Wednesday 31 August 2016 (29427)
h1susprocpi model restarted to fix test point problem

the h1susprocpi model had two entries in the testpoint.par file (dcuids 52 and 71). The correct ID is 71. This was causing a failure to open testpoints on this model. After the testpoint.par file was corrected, I restarted h1susprocpi and testpoints are now available.

H1 PSL
peter.king@LIGO.ORG - posted 20:56, Wednesday 31 August 2016 - last comment - 12:37, Thursday 01 September 2016(29426)
HPO trip
Attached are trends of the various flow sensors in the PSL.  Comparison of the timestamps shows that the high power oscillator
tripped because of a flow rate problem with the AMP circuit.  The problem does not lie within the 4 laser heads, leaving either
the front end power amplifier, or the 4 crystal chambers.

    Unfortunately checking the 4 crystal chambers requires dismantling the laser.  The vortex flow sensor in the AMP circuit
is relatively new.  The other object in that circuit is the power amplifier module.  An inspection mirror might be able to
afford a view of the plumbing underneath the housing.

    One can see that the flow rate in the AMP circuit drops before the output of the front end laser drops, and that the output
power of the front end laser drops before the high power oscillator.  I think the sequence of events is the following:
 1. flow rate problem in the AMP circuit trips the flow watch dog of the front end laser
 2. the switching off of the front end laser breaks the injection locking of the high power oscillator
 3. the loss of injection locking results in a power drop in the high power oscillator which then trips the power watch dog
 4. the power watch dog switches the high power oscillator off
Images attached to this report
Comments related to this report
peter.king@LIGO.ORG - 09:03, Thursday 01 September 2016 (29432)
Jeff spotted this this morning in the crystal chiller circuit filter.  Wasn't there a couple of days ago.
Might be the cause of last night's syncope.
Images attached to this comment
jason.oberling@LIGO.ORG - 12:37, Thursday 01 September 2016 (29439)

Filed FRS #6132.

H1 CDS
david.barker@LIGO.ORG - posted 17:22, Wednesday 31 August 2016 (29425)
Remote Access Control turned on for testing during operator shifts

WP6121: Jonathan, Carlos, Jim, Dave

Tuesday Aug 30, the Remote Access Control system (RACCESS) was turned on during the times we have operator coverage (Mon-Fri, 8am - 4pm Pacific). This is a 'real life' test of the system, and an opportunity for everyone to get familiar with it before it is on full-time during O2. Any problems with the system should be communicated as an LHO-CDS FRS ticket.

To provide more visibility of who is logged into the border machine (cdsssh) I have expanded the RACCESS portion of the CDS_OVERVIEW medm (center right area).

Images attached to this report
H1 CDS (DAQ)
david.barker@LIGO.ORG - posted 17:11, Wednesday 31 August 2016 (29424)
Additional DAQ Frame Writer diagnostics added to DAQ

WP 6131. Jonathan's new daqd code which is running on both h1fw0 and h1fw1 exports more signals via EPICS channels. At 12:42PDT today I restarted the DAQ with a new H1EDCU_DAQ.ini file which includes the full set of EPICS channels. I also added the standard set of channels for the h1fw2 frame writer.

I have extended the DAQ Overview medm to show trend file sizes, and added links to open the detailed screens for fw0 and fw1 which show the full diagnostic suite.

Images attached to this report
H1 ISC
jenne.driggers@LIGO.ORG - posted 16:29, Wednesday 31 August 2016 (29423)
Redid green initial alignment setpoints

I redid our green initial alignment setpoints, in hopes that CHARD won't have such a large input offset when we try to engage the loops.

LHO VE (VE)
gerardo.moreno@LIGO.ORG - posted 16:05, Wednesday 31 August 2016 (29422)
Over-filled CP3 at 21:40 utc

Over-filled CP3 with the exhaust bypass valve fully open and the LLCV bypass valve 1/2 turn open.

Flow was noted after 23 minutes 15 seconds, closed LLCV valve, and 3 minutes later the exhaust bypass valve was closed.

I raised CP3's LLCV from 19% to 20%, due to the time increase for the last two fills.

H1 General
travis.sadecki@LIGO.ORG - posted 16:01, Wednesday 31 August 2016 (29421)
Ops Day Shift Summary

TITLE: 08/31 Day Shift: 15:00-23:00 UTC (08:00-16:00 PST), all times posted in UTC
STATE of H1: Commissioning
INCOMING OPERATOR: TJ
SHIFT SUMMARY:  First half of today was dedicated to Kiwamu's SRC Gouy phase measurements.  After lunch, I did an IA, and after some troubleshooting with Sheila and Jenne of ALS Diff, we are back to locking.
LOG:

16:20 Kissel taking TMSx TFs, Kiwamu starting SRC measurements

16:24 Keita to LVEA making ISS 2nd loop electronics measurements

16:39 Kiwamu to LVEA byu ISCT6 for SRC Gouy meas.

16:44 Karen done at MY

16:48 Cristina done at MX

17:05 Betsy, John, and Chandra to MY

17:35 Betsy, John, and Chandra to MX

18:03 Kissel done with TMSx

19:31 Kiwamu done

19:34 Keita to LVEA for more 2nd loop meas.

20:29 Chandra to LVEA

20:43 Chandra done

21:21 Gerardo to MY

22:22 Gerardo done

22:56 Jim switching ISIs to Earthquake mode for incoming EQ


H1 SEI (SEI)
travis.sadecki@LIGO.ORG - posted 15:13, Wednesday 31 August 2016 (29420)
OPS: reset of HEPI L4C Accumulated WD Counters

Only HAM2 required a WD counter reset.  See attached screenshot.

Images attached to this report
H1 TCS
nutsinee.kijbunchoo@LIGO.ORG - posted 15:03, Wednesday 31 August 2016 - last comment - 16:33, Tuesday 13 September 2016(29419)
Adjusted CO2 heating power based on a new lensing measurement

The CO2 heating power was calculated based on Aidan's CO2 power vs. PSL power plot (alog25932). With the new thermal lensing measurement (alog28799) I fine-tuned the equation.


CO2 power = slope * PSL power + offset

ITMX slope was -0.01, now -0.012

ITMY slope was -0.01, now -0.014

ITMX offset was 0.5, now  0.6

ITMY offset was 0.3, now 0.4

Images attached to this report
Comments related to this report
nutsinee.kijbunchoo@LIGO.ORG - 16:33, Tuesday 13 September 2016 (29677)

Corrected actuation plot. Divided lensing by a factor of 2 to make it a single-pass value.

Images attached to this comment
Non-image files attached to this comment
H1 ISC
kiwamu.izumi@LIGO.ORG - posted 14:54, Wednesday 31 August 2016 (29418)
2nd round of SRC gouy phase measurement

Elli (remotely), Kiwamu,

This morning was a morning for another measurement of the SRC gouy phase. As opposed to the single bounce measurements done yesterday, we proceeded to a round trip beam measurement.

I wanted to measure two different configurations as instructed by Elli, but I could get only one of them done today. We will spend (at least) another morning to measure the other configuration.


[Some background]

A trick in this whole series of measurements is that one can effectively cancel the effect of the output optical train (i.e. the optical path from SRM all the way to the setup on ISCT6 which is not easy to precisely characterize)  by having measurements of single bounce and round trip beams. The round trip beam we mean here is a beam that bounces around the signal recycling cavity only once and comes out to the AS port. We have finished the single bounce measurement yesterday, and therefore the next step today was to measure the round trip beam.

[The setup]

I added an extra component to ISCT6. It is a beam blocking object. Everything else was unchanged on ISCT6. See the picture of the setup shown below.

The blocking object (a black rectangular piece in the middle) is dedicated to block the single bounce beam which would cause undesired interference with the round trip beam. To split the beam into single and round trip beams, I introduced an intentional misalignment in SRM by 700 urad in pitch as suggested by Elli. In addition, I found that the separation of the two beams became even better with additional misalignment (~ 100 urad) in pitch of PR2 as well. This misaligned configuration is one of two configurations we wanted to test. The other configuration will introduce misalignment in another combination of optics, ITM and IM4, instead of SRM.

As I introduced misalignment in SRM, it made a clean beam separation on CAM17 (see the previous log) while ASAIR did not as expected. I manually steered a mirror and beam splitter that were in front of the cameras to center the round trip beam on both cameras. The blocking object was removed when I finished the measurement this morning.

- - - - some other settings.

PSL power into IMC = 25 W

ITMY ring heater = 0.5 W (0.25 W for upper and lower segments each)

CO2Y = 286 mW

The interferometer configuration = single bounce (with ITMY aligned) + SRM almost aligned (see the second and third attachment for the specific alignment values)

The camera settings = same as the previous measurements (alog 29389)

ASAIR exposure time = 4400 usec

CAM17 exposure time = 7000 usec

[The measurement]

The measurement itself is the same as what we did yesterday -- excite BS or PR2 in yaw at a certain frequency and measure the centroid positions on the two gigE cameras. I ended up doing four sets of measurements as described below because I was worried that a high excitation may have introduced a large enough clipping somewhere which may confuse the later analysis. By the way, later Jenne told me that there were some angular excitation signals unintentionally left on throughout the measurements on BS and all the SR mirrors (in both pitch and yaw) at frequencies around 20 Hz, which I don't think an issue because they are small compared to my measurement excitation and also the frequencies are different than my excitation.

- measurement #1

 18:06:40 - 18:16:40 UTC

 BS yaw excitation by 6 urad at 0.2 Hz (ASAIR camera showed a clipping-type behavior)

- measurement #2

 18:19:53 - 18:29:53 UTC

 BS yaw excitation by 3 urad at 0.2 Hz

- measurement #3

 18:34:15 - 18:44:15 UTC

 PR2 yaw excitation by 20 urad at 0.2 Hz (ASAIR camera showed a clipping-type behavior)

- measurement #4

 18:47:15 - 18:57:15 UTC

 PR2 yaw excitation by 10 urad at 0.2 Hz

[The data]

A thorough analysis will be remotely performed by Elli. The data are saved in kiwamu.izumi/Public/measurements/20160831_SRCgouy2/data1

Images attached to this report
H1 SUS (CDS, ISC)
jeffrey.kissel@LIGO.ORG - posted 14:47, Wednesday 31 August 2016 (29416)
Investigating TMSX LF & RT OSEM Gain Loss
J. Kissel

While perusing the list of FRS tickets / Integration issues that had been opened and related to me, I found an old issue -- now FRS #3246 -- that cites LHO aLOG 19208. The story from that aLOG : after the vent in the summer of 2015, the LF & RT OSEM signal chains had shown a factor of a few less gain than their values prior to the vent.

I was tempted to close the issue, claiming the cop out "well, we detected gravitational waves with TMSX like this..." but there happened to be some time this morning, where then end stations were free. Also, given the typical-forgetten-about state of the TMTS, this transfer function had not been remeasured since just after the pump-down of the chamber -- not at final vacuum levels.

As such, I've remeasured the standard top-to-top transfer function of H1SUSTMSX, and found even further a drop in transfer function magnitude. The transfer functions confirm that V and P -- transfer functions show a factor of 4 drop in response from the 2014 to 2016 measurements. Additionally, and not mentioned in the original fault (although present in the 2015 transfer functions) report R also shows a drop from 2014 to 2016 of a factor 2. See first pdf  attachment (alltmtss_2016-08-31_Phase3b_H1SUSTMSY_M1_ALL_ZOOMED_TFs.pdf).

The drop in plant gain leaves the R, P and especially V DOFs with little to no damping on resonance.

Digging even further, recall that TMTS top masses (M1) are rotated 90 deg to that of the QUAD, so the DOF mapping (for the relevant DOFs in question) is 
    V --> LF and RT
    R --> F1, F2, and F3
    P --> LF and RT
Since L (= SD), T, and Y (= F2 and F3) look the same, we can rule out problems with F2, F3, and SD. This leaves LF, RT, and F1 as our suspect OSEMs.

Unlike suspected before, I'm not sure if this is an external electronics chain issue. Why? Because, typically electronics chain problem show up clustered in an entire satellite amplifier or coil driver. The TMTS OSEMs are group in the typical six-osem stage fashion of F1, F2, F3, LF on one cable chain, and RT, SD on another (see pg 3 of D1002741).

I've also attached some new figures (which are standard output of the transfer function scripts, but posting them had fallen out of fashion) that compares the response in the OSEM basis to Euler basis drive. This isolates the individual sensor composition of each DOF. See the rest of the .pdf attachments (
H1SUSTMSX_M1_*.pdf), which compare the 2014 and 2016 data sets in this manner. This shows a consistent story, that
    - F1 alone (as opposed to F2 and F3) has dropped in sensitivity by a factor of 2. 
    - LF has dropped in sensitivity by a factor 6, and RT has dropped by a factor of 3.

I then went on to wonder -- seeing the trend from 2014 to 2016 -- have the OSEM LEDs just slowly decayed in sensitivity over time? This launched the data viewer mining exercise for all of the attached .pngs, H1SUS${OPTIC}_${TOPSTAGE}_OSEMINF_3yr_Trend.png. These are hourly trends of the mean value for each OSEM over the past three years. I was hoping to see the H1SUSTMSX's F1, LF, and RT OSEMs showed a slow, but substantial, downward decay in raw input ADC voltage over time, with the hypothesis that this represented a slow failure of those OSEM's LEDs or PDs. Sadly, evidence from other suspensions I checked showed that a random smattering of BOSEMs scattered around all BSC SUS show either flat or a slow decay of at most ~3000 [ct]; the rest are flat in time. This drop in PD current is only about 10% of the full range (~30000 [ct]), so it cannot explain the factors of 2 to 6. 

In conclusion, I've recommended that we close this ticket with the LONGTERMFIX, and open up a proper Integration Issue about it, marking it WHEN VENT, because I have a feeling this will be easier to debug when we have access to the entire signal chain. In the mean time, we can band-aid the problem by increasing the overall gain the V, R, and P damping loops by the amount of plant sensitivity that has been lost.
Images attached to this report
Non-image files attached to this report
H1 ISC
terra.hardwick@LIGO.ORG - posted 12:55, Wednesday 31 August 2016 - last comment - 01:33, Friday 02 September 2016(29408)
PI work

Unsuccessful at damping ITMX 15520 Hz PI several times tonight (previously seen here and here). We find that larger damping drive does not equal greater damping: When this mode was test driven and damped after the thermal transient at 50 W, a best gain and phase was found for damping. When the mode began to ring up later, increasing gain (by some large amound but still under saturation) or flipping sign and/or changing phase only resulted in faster ringup. This is true when still far below DAC saturation levels. It seems as if there is some gain sweet spot that must be found. 

--- --- ---

We had three occasions to damp ITMX 15520 Hz mode during the night. During the first, I successfully damped and it then rerang up (perhaps due to offset adjustments?) and lost lock. During the second and third I was not able to damp the mode and avoided lockloss only by decreasing power 50 W --> 25 W.

Below you see the mode first ring up and my gain trial and error response until I settle at 10000 and the mode is fully damped. Soon after, you see the mode ring up again right after the yaw offset step from ~ -0.02 --> -0.01. Note we started with a small negative gain so I just assumed we had actually been ringing up the mode the past few days.

During the second 50 W lock, damping was already running at the gain and phase settings that were effective at damping the first ring up above (+10000 gain, -60deg). Despite this, you see the mode slowly rising ~3 hours into the 50 W lock and my gain adjustments trying to damp. Note that here I start with some mostly successful positive gain (i.e. shallow slope) yet both raising the gain and flipping the gain sign cause the mode to ring up. I tried phase changes at this point too but existing was best. I avoided lockloss by decreasing power to 25 W, allowing mode to ring down enough to damp, then powering back up. I also rechecked my gain and phase at 50 W (post thermal transient time) and it would still drive and damp with a very steep slope. Still, an hourish later the mode began to ring up. I found similar behavior in the third attempt as the second and had to decrease power to avoid lockloss. 

Things to note: 

Things to try:

Images attached to this report
Comments related to this report
aidan.brooks@LIGO.ORG - 12:11, Thursday 01 September 2016 (29437)

I've plotted the HOM spacing (H1:TCS-SIM_IFO_XARM_HOM_SPACING_HZ_OUTPUT) from the TCS simulator vs the RMS of the 15520Hz PI mode. It seems to be ringing up consistently when the simulated HOM spacing edges up over 5034Hz.

The first plot shows the HOM spacing at the same time that Terra sees and tries to damp the mode. You can see the HOM spacing edge up over three hours as the surface curvature is becoming flatter. The 15520 mode starts to ring up and then Terra is able to damp it. It looks like the subsequent yaw offset increased the power in the arm very slightly which has, in turn, increased the heating of the optic. The estimated HOM spacing increases, most likely increasing the parametric gain of the 15520Hz mode in the process.

The second plot shows the HOM spacing over a larger time frame (19 hours) and the associated RMS of the 15520Hz mode. Every time the HOM spacing reaches 5034Hz, the mode starts to ring up.

Some notes:

  • The HOM spacing is an estimate that shows the correct linear behaviour but is, currently, not scaled correctly. The calculation uses the dynamic ROC of the optics to dead-reckon the cavity Gouy Phase. There's two parts:
    • The cold cavity value (with the RHs on) is around 4964Hz. This is based on the measured ROC and the estimated response of the surface curvatures to the RH. Essentially, this is an offset.
    • The change in the HOM spacing with power is dependent on the total absorbed power in the ITM and ETM. Currently, the calculated arm powers in the TCS_SIM model (H1:TCS-SIM_XARM_POWER) are dependent on the TR_X_SUM values but are not calibrated correctly. The estimated peak power in the arms at around 90kW which is probably low. Also, the absorbed power is dependent on the absorption coefficient for each optic.
  • Nevertheless, the change in the HOM spacing will still show the correct behaviour. 

In fact, it's not too much of a stretch to use the parametric gain of the modes in conjunction with the simulated HOM spacing to continually update the total absorbed power in the arms.

Images attached to this comment
Non-image files attached to this comment
terra.hardwick@LIGO.ORG - 01:33, Friday 02 September 2016 (29456)

Thanks Aidan. 

I've attached a look at the HOM spacing during two times that this same mode rang up while no damping was being applied (DAMP_GAIN = 0), unlike the times you looked at. First time the mode rang up when HOM spacing was about the same as you found, 5035. Second (indicated with red arrow), rang up around 5025. Both locks were 50 W. 

Images attached to this comment
H1 SEI
thomas.shaffer@LIGO.ORG - posted 22:12, Tuesday 30 August 2016 - last comment - 11:59, Wednesday 31 August 2016(29403)
Switched to and from EQ and windy configurations during EQ

6.7 in Papua New Guinea shook us about for a few hours. We put the SEI configuration to EarthQuake and then tried locking after a handful of minutes and it looked like it was doing well, getting us to SWITCH_TO_QPDS before losing lock. When the seismometers looked low enough and we still could not lock, we tried switching back to WINDY and then we immediately noticed a difference and made it all the way to DC_READOUT.

Perhaps the EarthQuake configuration is not as good as we previously thought.

Comments related to this report
sheila.dwyer@LIGO.ORG - 11:59, Wednesday 31 August 2016 (29414)

Here is a screenshot of some ALS signals durring the times TJ described.

Images attached to this comment
H1 ISC (ISC)
chris.whittle@LIGO.ORG - posted 21:23, Tuesday 30 August 2016 - last comment - 13:39, Thursday 01 September 2016(29400)
ITMX charge measurement tests

Jeff K, Chris Whittle

We used the interometer uptime to test the ITM charge measurement script by taking data for ITMX. With the previously used excitation frequency of 20.1 Hz being used for other measurements, we opted for an excitation at 11.5 Hz. At this frequency, we found an excitation amplitude of 1k counts to be sufficient for a good SNR. We have taken data at bias voltages between -10k and 10k counts, but have yet to perform post-processing.


We additionally tested whether flipping the analog voltage out switches to the quadrants had any effect on the locked interferometer. No effects were observed for flipping on/off quadrant voltages in various orders. This test was performed on just ITMX and with no actual output voltage to the quadrants.

Comments related to this report
chris.whittle@LIGO.ORG - 12:12, Wednesday 31 August 2016 (29415)

Plotting the PSD for each of the tested bias voltages (see here) shows almost identical peaks in DARM for each bias voltage. I confirmed that the voltages being driven at the time were as expected (see here).

Zooming in on the PSD (see here) shows a peak ordering that seems consistent with a zero crossing at a large negative bias voltage. This is inconsistent with previous measurements, which found a zero crossing at 3k for ITMX. I will repeat these measurements later, covering the full range of bias voltages.

Images attached to this comment
chris.whittle@LIGO.ORG - 13:39, Thursday 01 September 2016 (29443)

The same measurement was repeated sweeping over a larger range of bias voltages (up to ±100k counts). Attached are plots of the DARM response as a function of bias voltage for both sets of measurements. Both are consistent with a zero crossing at a large negative bias voltage.

Images attached to this comment
H1 SUS (ISC)
jeffrey.kissel@LIGO.ORG - posted 20:49, Tuesday 30 August 2016 - last comment - 13:03, Wednesday 31 August 2016(29397)
ETM ESD Bias Signs Flipped -- Let's Hope It Sticks This Time!
J. Kissel

In short: The ETM ESD bias signs have now been flipped.

After whining about it since ER9, I've commissioned why the bias sign flipping had caused the ALS DIFF control to go unstable (and subsequently DARM once we get onto ETMY): controlling the loop gain sign beyond the ESD linearization just doesn't work. As such, I've restored all settings for both test masses to their successful settings back in April -- namely that from LHO aLOG 26826. As such, we've returned to the aesthetically displeasing but functional method of controlling the DARM loop sign in the DRIVEALIGN matrix. 

We still have yet to assess the impact on PI damping.

----------------------

Explicit details for the next time this becomes confusing:
ETMX
(1) Changed H1:SUS-ETMX_L3_LOCK_INBIAS from -9.5 [V] to +9.5 [V]
(2) Changed 
       H1:SUS-ETMX_L3_DRIVEALIGN_L2L_GAIN from +1.0 to -1.0
       H1:SUS-ETMX_L3_DRIVEALIGN_L2P_GAIN from +0.021 to -0.021 
       H1:SUS-ETMX_L3_DRIVEALIGN_L2Y_GAIN from +0.007 to -0.007
(3) Changed H1:SUS-ETMX_L3_ESDOUTF_LIN_FORCE_COEFF from -124518.4 to +124518.4
(4) Made sure all H1:SUS-ETMX_L3_ESDOUTF_??_GAIN fields are +1 always, all the time, as before.

(No changes need to the calibration model since we don't use ETMX in our lowest noise state.)

ETMY
(5) Changed H1:SUS-ETMY_L3_LOCK_INBIAS from +9.5 [V] to -9.5 [V]
(6) Changed H1:SUS-ETMY_L3_DRIVEALIGN_L2L_GAIN from +30.0 [V] to -30.0 [V]
(7) Changed H1:SUS-ETMY_L3_ESDOUTF_LIN_FORCE_COEFF from +124518.4 to -124518.4 (even though ETMY doesn't use linearization).
(8) Made sure all H1:SUS-ETMX_L3_ESDOUTF_??_GAIN fields are +1 always, all the time, as before.

(9) Changed H1:CAL-CS_DARM_FE_ETMY_L3_DRIVEALIGN_L2L_GAIN from +30 to -30
(10) Changed H1:CAL-CS_DARM_FE_ETMY_L3_ESDOUTF_UL_GAIN from -1 to +1, where it should remain always, all the time, as before.
(11) Changed H1:CAL-CS_DARM_FE_ETMY_L3_ESDOUTF_LIN_FORCE_COEFF from +124518.4 to -124518.4 (even though ETMY doesn't use linearization).

I've also redone (essentially reverted) the DOWN state in the ISC_LOCK guardian with respect to the ETM ESD settings, such that steps 2-3, and 6-11 are done automatically if a user does steps 1 and 5. Once we figure out the impact on PI damping, we'll code these up in the DOWN state of the ISC_LOCK guardian as well. 

Finally, I've accepted these changes into the 
H1SUSETMX down.snap (to which its safe.snap is a soft link)
H1SUSETMY down.snap (to which its safe.snap is a soft link)
H1CALCS   safe.snap and OBSERVE.snap.
SDF systems.
Comments related to this report
terra.hardwick@LIGO.ORG - 13:03, Wednesday 31 August 2016 (29417)

I have flipped PI ETM damping gain signs and confirmed successful damping many many times now. I've added a bias flip check to the SUS_PI guardian under the PI_DAMPING state; this will choose sign of gain based on sign of ETM bias. 

H1 General (SUS)
edmond.merilh@LIGO.ORG - posted 13:29, Tuesday 30 August 2016 - last comment - 12:08, Wednesday 31 August 2016(29386)
ETMY OpLev maintenance

This morning at about 16:00UTC I made some adjustment to ETMY oplev as per WP #6123. I've included some photos of a 5day trend as well as a before and after 5 the AA reset. THe output power was increased by 7mV in an attempt to stop glitches. I don't know if the after reset pic is of any use as the suspension hadn't quite settled down.

Images attached to this report
Comments related to this report
jason.oberling@LIGO.ORG - 12:08, Wednesday 31 August 2016 (29413)

1st attachment is a 1.5-day second trend of the ETMy SUM signal.  It is clearly seen that after Ed reset the oplev AA chassis the signal is much quieter.  Residual noise is likely caused by laser glitches.  The glitching has improved with Ed's adjustment of the laser power, but it appears a further tweak is necessary (see the last 2 attachments; 1st is before adjustment, 2nd is after.  Taken from the DetChar summary pages.).

Images attached to this comment
H1 DetChar
keith.riles@LIGO.ORG - posted 21:20, Tuesday 12 July 2016 - last comment - 08:01, Thursday 01 September 2016(28364)
Narrow lines in ER9 H1 DARM
Executive summary: 

* Good news - as expected, the 16-Hz comb due to the OMC length dither is gone (at least at this sensitivity level)
* Bad news - low-frequency 1-Hz combs remain, and some new low-frequency combs & lines have appeared 

Some details:
  • I initially looked at 15 hours of 30-minute FScan DELTAL_EXTERNAL SFTs (30 SFTs) generated during ER9 and was aghast at how bad the low-frequency spectrum looked, with a pervasive 0.485308-Hz comb ranging up to its 446th harmonic at 216.4 Hz, but when I exclude the three hours of SFTs when the 2-second ALS- glitches were present, things don't look quite so bad (see figure 1 for a sample without removal and figure 4 with removal). I dewhiten according to the new 6-pole / 6-zero, 0.3 / 30 Hz algorithm.
  • The infamous 16-Hz comb due to the OMC length dither tracked down and killed here is gone (at least at this sensitivity level and these SFT statistics). As a result the high-frequency band (up to 2 kHz) is remarkably smooth with only violin modes and sporadic isolated artifacts.
  • The 1-Hz comb with 0.5-Hz offset remains pervasive, but other prior 1-Hz or near-1-Hz combs with different offsets (e.g., 0.25 Hz) are not strong.
  • On the other hand, there is a new near-1-Hz comb (0.996798-Hz spacing) visible to its 204th harmonic at ~203.3 Hz.
  • There is also a new near-2-Hz comb (1.999951-Hz spacing) visible on approximate odd-integer-Hz frequencies, starting from ~9 Hz and visible up to ~175 Hz. This is likely the same 2-Hz comb reported in May by Bryn Pearlstone (which Ansel Neunzert kindly reminded me about today).
  • There is a "new" 56.8406-Hz comb visible to its 11th harmonic at ~625.25 Hz, which in hindsight I can see was buried in the O1 spectrum (I overlooked the pattern and indicated the teeth as isolated lines). This time the pattern was strong enough to jump out at me and to jog my memory that this comb was seen in H2 1-arm data in 2012 in both the arm feedback channel and a quiet sensor-noise-dominated OSEM channel. This seemed to indicate a DAQ system problem at the time. I can see from O1 NoEMi line lists that this comb is pervasive in ISI, SUS and PEM channels at the corner station and both end stations.
  • The old "K" comb-on-comb (0.088425-Hz fine comb attached to teeth of a coarse 76.3235-Hz comb) has more 11 more fine teeth visible on the lowest-frequency coarse-tooth comb.
  • The old calibration line at 35.9 Hz has been moved to 35.3 Hz. The new excitation lines at 33.7 and 34.7 Hz are easily visible, but not as strong as the primary calibration lines. I found these changes documented here.
  • There are sporadic new isolated lines here and there (indicated in line list - see below)
  • There is a "crab-killer" broad bump centered at about 58.6 Hz which degrades sensitivity in the Crab Pulsar band of interest (~59.3 Hz). On the other hand, the whole noise floor is elevated w.r.t. O1, anyway. So it may be premature to worry about the bump.
Figure 1 - spectrum for 50-100 Hz when the 3-hour 2-second-glitches stretch is included (~0.5 Hz lines marked with 'h' for 'half') Figure 2 - 0-2000 Hz (removing 3-hour bad stretch from here on) Figure 3 - 20-50 Hz sub-band Figure 4 - 50-100 Hz sub-band Figure 5 - 100-200 Hz sub-band Figure 6 - 1300-1400 Hz sub-band (illustration of how clean the high-frequency band is) Also attached are a larger set of zipped sub-band spectra and a lines list (excluding the bad 3-hour stretch). Note that because the statistics here are two orders of magnitude smaller than used for the full O1 run report, I am not yet removing lines seen then that may yet re-emerge with more accumulated post-O1 data. So many of the line labels in these figures are buried in the noise fuzz for now. Line label codes in figures: b - Bounce mode (quad suspension) r - Roll mode (quad suspension) Q - Quad violin mode and harmonics B - Beam splitter violin mode and harmonics C - Calibration lines M - Power mains (60 HZ) O - 1-Hz comb (0.5-Hz offset) o - weaker 1-Hz and near-1-Hz combs (various offsets, including zero) H - 99.9989-Hz comb J - 31.4127 and 31.4149-Hz combs K - 0.088425-Hz comb-on-comb t - 1.999951-Hz, 2.07412-Hz and 2.07423-Hz combs D - 56.8406-Hz comb x - single line (not all singlets in the vicinity of quad violin modes are marked, given the known upconversion)
Images attached to this report
Non-image files attached to this report
Comments related to this report
duo.tao@LIGO.ORG - 12:04, Monday 25 July 2016 (28619)DetChar

I analyzed the 56.8406Hz comb with coherence tool and here are the results. The same structure is found to be significant in 35 channels in ER9, distributed in ISI, SUS, PEM and LSC subsystems. Among all the 35 channels, 22 of them does not have a range up to its 11th harmonic, 625.25 Hz.


Keith indicated in his slog entry that a DAQ malfunction is suspected to be the ultimate source of this, and these findings suggest it's in an EX electronics crate.


Here are a few interesting observations:

  • The 9th harmonic at 511.56Hz is the weakest in most channels, sometimes buried in noises.

  • In some PEM channels, there are missing lines at low frequency (< 200 Hz) and high frequency (> 500 Hz).

  • In PEM and ISI channels, there seems to be another comb structure with a frequency slightly larger than 56.8406Hz coexists. That one is usually most significant at its third harmonics.

  • Generally, the structure is more clearly seen in LSC, SUS and ISI channels


Sample plots from each subsystem:

Figure 1: We can see the 56.8406Hz comb structure exists with its 9th harmonic weakest in ISI.

Figure 2: PEM channels have more noises and, as in ISI channels, the other comb structure coexists.

Figure 3: SUS channels do not have enough range up its 11th harmonic but we can see its first and second harmonic here.

Figure 4: There is only one channel from LSC but the structure is very clear.


All plots and a list of channels are attached in the zip file.

Images attached to this comment
Non-image files attached to this comment
nelson.christensen@LIGO.ORG - 11:14, Tuesday 26 July 2016 (28642)DetChar, PEM
Just to be clear. Here are the channels that the coherence tool is finding the comb. This is what is supporting Keith's assumption that the problems could be in an EX electronics crate.

Channels List:
H1:ISI-ETMX_ST2_BLND_RX_GS13_CUR_IN1_DQ_data
H1:ISI-ETMX_ST2_BLND_RY_GS13_CUR_IN1_DQ_data
H1:ISI-ETMX_ST2_BLND_RZ_GS13_CUR_IN1_DQ_data
H1:ISI-ETMX_ST2_BLND_X_GS13_CUR_IN1_DQ_data
H1:ISI-ETMX_ST2_BLND_Y_GS13_CUR_IN1_DQ_data
H1:ISI-ETMX_ST2_BLND_Z_GS13_CUR_IN1_DQ_data
H1:LSC-X_TR_A_LF_OUT_DQ_data
H1:PEM-EX_ACC_BSC9_ETMX_Y_DQ_data
H1:PEM-EX_ACC_BSC9_ETMX_Z_DQ_data
H1:PEM-EX_ACC_ISCTEX_TRANS_X_DQ_data
H1:PEM-EX_ACC_VEA_FLOOR_Z_DQ_data
H1:PEM-EX_MIC_VEA_MINUSX_DQ_data
H1:PEM-EX_MIC_VEA_PLUSX_DQ_data

H1:ISI-ETMX_ST1_BLND_Y_T240_CUR_IN1_DQ_data
H1:ISI-ETMX_ST1_BLND_Z_T240_CUR_IN1_DQ_data
H1:ISI-GND_STS_ETMX_X_DQ_data
H1:ISI-GND_STS_ETMX_Y_DQ_data
H1:PEM-EX_MAINSMON_EBAY_1_DQ_data
H1:PEM-EX_MAINSMON_EBAY_2_DQ_data
H1:PEM-EX_MAINSMON_EBAY_3_DQ_data
H1:PEM-EX_SEIS_VEA_FLOOR_X_DQ_data
H1:PEM-EX_SEIS_VEA_FLOOR_Y_DQ_data
H1:SUS-ETMX_L1_WIT_Y_DQ_data
H1:SUS-ETMX_L2_WIT_L_DQ_data
H1:SUS-ETMX_L2_WIT_P_DQ_data
H1:SUS-ETMX_L2_WIT_Y_DQ_data
H1:SUS-ETMX_M0_DAMP_L_IN1_DQ_data
H1:SUS-ETMX_M0_DAMP_P_IN1_DQ_data
H1:SUS-ETMX_M0_DAMP_T_IN1_DQ_data
H1:SUS-ETMX_M0_DAMP_V_IN1_DQ_data
H1:SUS-ETMX_M0_DAMP_Y_IN1_DQ_data
duo.tao@LIGO.ORG - 18:55, Thursday 28 July 2016 (28717)DetChar

I chased Comb 23 (type K) in Keith’s post, shown in Keith's original post as

https://alog.ligo-wa.caltech.edu/aLOG/uploads/28364_20160712211751_CombPlots_H1-CAL-DELTAL-EXT_ER9-Cleaned_100_200_Hz.png


This comb has an offset of 153.3545 Hz and a fundamental frequency of 0.0884Hz. It starts at 153.3545 Hz and goes up to its 11th harmonic, 154.3272 Hz. As is listed in Keith's txt file:

Comb 23 (type K, offset=153.354500):
Frequency (offset + harmonic x fund freq) Ampl (m/rtHz)  Bar (logarithmic)
K  153.3545 (   0  X    0.0884) 1.844961e-19   ****
K  153.4429 (   1  X    0.0884) 1.949756e-19   ****
K  153.5314 (   2  X    0.0884) 2.165192e-19   *****
K  153.6198 (   3  X    0.0884) 2.181833e-19   *****
K  153.7082 (   4  X    0.0884) 2.457840e-19   *****
K  153.7966 (   5  X    0.0884) 2.243089e-19   *****
K  153.8851 (   6  X    0.0884) 2.709562e-19   *****
K  153.9735 (   7  X    0.0884) 2.499596e-19   *****
K  154.0619 (   8  X    0.0884) 2.562208e-19   *****
K  154.1503 (   9  X    0.0884) 1.945817e-19   ****
K  154.2388 (  10  X    0.0884) 1.951777e-19   ****
K  154.3272 (  11  X    0.0884) 1.703353e-19   ****


I found the comb structure in two channels of ISI subsystem.

Figure 1 shows the plot of channel H1:ISI-HAM6_BLND_GS13RZ_IN1_DQ. Descriptions of this channel can be found here:

https://cis.ligo.org/channel/314371

Figure 2 shows the plot of channel H1:ISI-HAM6_BLND_GS13Z_IN1_DQ. Descriptions of this channel can be found here:

https://cis.ligo.org/channel/314374

In the plots of both channels, we can see a comb structure stands out at the positions of harmonics. We are wondering about the reason for this:


Why these seismic isolation channels?


Images attached to this comment
duo.tao@LIGO.ORG - 00:15, Friday 29 July 2016 (28721)

This post is supplementary to the first post about coherence analysis result for the 56.8406Hz Comb at

https://alog.ligo-wa.caltech.edu/aLOG/index.php?callRep=28619

The first post is addressing the 56.8406Hz comb found in Keith's original post (marked as D comb):

https://alog.ligo-wa.caltech.edu/aLOG/index.php?callRep=28364

Information about this comb from the txt file in Keith's post:

Comb 35 (type D, offset=0.000000):
  Frequency (offset + harmonic x fund freq) Ampl (m/rtHz)  Bar (logarithmic)
D   56.8406 (   1  X   56.8406) 3.968800e-17   ***********
D  113.6811 (   2  X   56.8406) 1.773964e-17   **********
D  170.5217 (   3  X   56.8406) 7.121580e-18   *********
D  227.3622 (   4  X   56.8406) 3.232935e-18   ********
D  284.2028 (   5  X   56.8406) 1.166094e-18   *******
D  341.0433 (   6  X   56.8406) 1.007273e-18   *******
D  397.8839 (   7  X   56.8406) 5.962059e-19   ******
D  454.7245 (   8  X   56.8406) 3.752194e-19   *****
D  511.5650 (   9  X   56.8406) 2.577108e-19   *****
D  568.4056 (  10  X   56.8406) 1.964393e-19   ****
D  625.2461 (  11  X   56.8406) 1.891774e-19   ****
--------------------------------------------------------------

Besides the 35 channels found in the original post, 7 more channels are found to be relevant to the 56.8406Hz Comb. Two new subsystems, ASC and HPI are involved.

These new channels are:

H1:ASC-X_TR_A_NSUM_OUT_DQ

H1:ASC-X_TR_B_NSUM_OUT_DQ

H1:HPI-ETMX_BLND_L4C_Y_IN1_DQ

H1:HPI-ETMX_BLND_L4C_Z_IN1_DQ

H1:PEM-EX_ACC_BSC9_ETMX_X_DQ

H1:SUS-ETMX_L1_WIT_L_DQ

H1:SUS-ETMX_L1_WIT_P_DQ

So updated channel list is (42 channels in total):

H1:ASC-X_TR_A_NSUM_OUT_DQ
H1:ASC-X_TR_B_NSUM_OUT_DQ
H1:HPI-ETMX_BLND_L4C_Y_IN1_DQ
H1:HPI-ETMX_BLND_L4C_Z_IN1_DQ
H1:ISI-ETMX_ST1_BLND_RX_T240_CUR_IN1_DQ
H1:ISI-ETMX_ST1_BLND_RY_T240_CUR_IN1_DQ
H1:ISI-ETMX_ST1_BLND_RZ_T240_CUR_IN1_DQ
H1:ISI-ETMX_ST1_BLND_X_T240_CUR_IN1_DQ
H1:ISI-ETMX_ST1_BLND_Y_T240_CUR_IN1_DQ
H1:ISI-ETMX_ST1_BLND_Z_T240_CUR_IN1_DQ
H1:ISI-ETMX_ST2_BLND_RX_GS13_CUR_IN1_DQ
H1:ISI-ETMX_ST2_BLND_RY_GS13_CUR_IN1_DQ
H1:ISI-ETMX_ST2_BLND_RZ_GS13_CUR_IN1_DQ
H1:ISI-ETMX_ST2_BLND_X_GS13_CUR_IN1_DQ
H1:ISI-ETMX_ST2_BLND_Y_GS13_CUR_IN1_DQ
H1:ISI-ETMX_ST2_BLND_Z_GS13_CUR_IN1_DQ
H1:ISI-GND_STS_ETMX_X_DQ
H1:ISI-GND_STS_ETMX_Y_DQ
H1:LSC-X_TR_A_LF_OUT_DQ
H1:PEM-EX_ACC_BSC9_ETMX_X_DQ
H1:PEM-EX_ACC_BSC9_ETMX_Y_DQ
H1:PEM-EX_ACC_BSC9_ETMX_Z_DQ
H1:PEM-EX_ACC_ISCTEX_TRANS_X_DQ
H1:PEM-EX_ACC_VEA_FLOOR_Z_DQ
H1:PEM-EX_MAINSMON_EBAY_1_DQ
H1:PEM-EX_MAINSMON_EBAY_2_DQ
H1:PEM-EX_MAINSMON_EBAY_3_DQ
H1:PEM-EX_MIC_VEA_MINUSX_DQ
H1:PEM-EX_MIC_VEA_PLUSX_DQ
H1:PEM-EX_SEIS_VEA_FLOOR_X_DQ
H1:PEM-EX_SEIS_VEA_FLOOR_Y_DQ
H1:SUS-ETMX_L1_WIT_L_DQ
H1:SUS-ETMX_L1_WIT_P_DQ
H1:SUS-ETMX_L1_WIT_Y_DQ
H1:SUS-ETMX_L2_WIT_L_DQ
H1:SUS-ETMX_L2_WIT_P_DQ
H1:SUS-ETMX_L2_WIT_Y_DQ
H1:SUS-ETMX_M0_DAMP_L_IN1_DQ
H1:SUS-ETMX_M0_DAMP_P_IN1_DQ
H1:SUS-ETMX_M0_DAMP_T_IN1_DQ
H1:SUS-ETMX_M0_DAMP_V_IN1_DQ
H1:SUS-ETMX_M0_DAMP_Y_IN1_DQ
 

Attached images are sample plots from ASC and HPI subsystem.

Full results are also attached.

Images attached to this comment
Non-image files attached to this comment
duo.tao@LIGO.ORG - 08:01, Thursday 01 September 2016 (29431)

Coherence Search Results of All the Single Lines in ER9 Data

Here are the coherence search results of all the single lines in ER9 data, which are listed in Keith’s post. I found 29 of all the 198 lines on the list and posted the results on my homepage here:

https://ldas-jobs.ligo-wa.caltech.edu/~duo.tao/ER9_single_lines/index.html

H1 CDS
david.barker@LIGO.ORG - posted 14:15, Wednesday 16 December 2015 - last comment - 23:58, Wednesday 31 August 2016(24264)
Verbal Alarms code changed to log to the logging directory
the Verbal Alarms code was logging to the ops home directory. Prior to the move of this home directory (WP5658) I have modified the code to log to a new directory:

/ligo/logs/VerbalAlarms

We restarted the program at 14:04 and verified the log files are logging correctly.
Comments related to this report
jeffrey.kissel@LIGO.ORG - 14:45, Friday 26 August 2016 (29336)DetChar, GRD, ISC, SYS
These verbal log files actually live one level deeper, in
/ligo/logs/VerbalAlarms/Verbal_logs/

For the current month, the log files live in that folder. 
However, at the end of every month, they're moved into the dated subfolders, e.g.
/ligo/logs/VerbalAlarms/Verbal_logs/2016/7/

The text files themselves are named "verbal_m_dd_yyyy.txt".

Unfortunately, these are not committed to repo where these logs might be viewed off site. Maybe we;ll work on that.

Happy hunting!
thomas.shaffer@LIGO.ORG - 23:58, Wednesday 31 August 2016 (29428)

The Verbal logs are now copied over to the web-exported directory via a cronjob. Here, they live in /VerbalAlarms_logs/$(year)/$(month)/

The logs in /ligo/logs/VerbalAlarms/Verbal_logs/ will now always be in their month, even the curent ones.

Displaying reports 57501-57520 of 86131.Go to page Start 2872 2873 2874 2875 2876 2877 2878 2879 2880 End