Krishna
Summary:
1. Closing the valve for the vacuum can of cBRS makes it very sensitive to pressure through an unknown mechanism. With the valve open, pressure coupling is not visible.
2. cBRS sees signficant ground tilts at wind speeds of ~20 mph, which are coherent with ITMX Stage 1 rY sensor but not very coherent with ITMY ground seismometer. As we suspected, ITMX sees larger ground tilts than the ITMY seismometer. For some peculiar reason, the ITMY seismometer seems to be in a null zone for tilt. This is the reason it works well for sensor correction for the corner.
Details:
As discussed in my SWG log last week, cBRS sees excess ground tilts below ~50 mHz which are not expected given it's 'd' value. It's 'd' value can be inferred from it's translation coupling visible as the height of the microseism peak along x-direction.
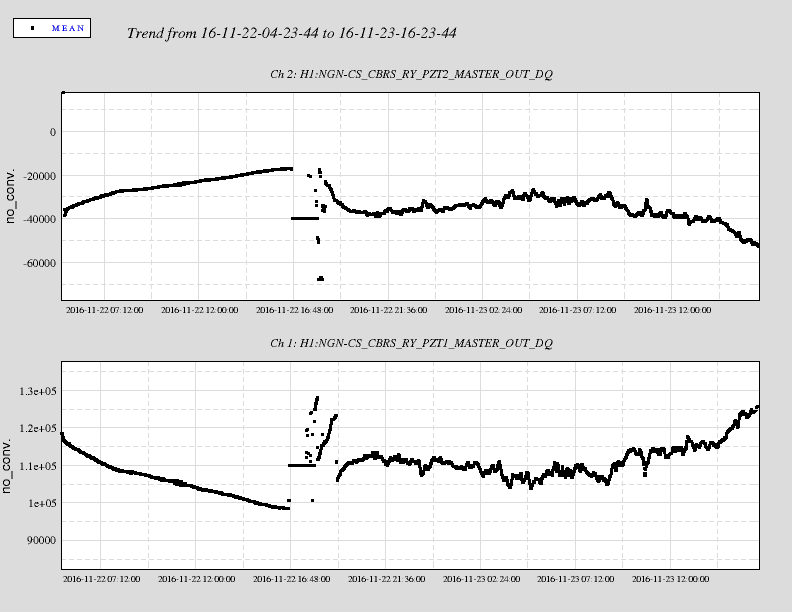
1. I wondered if there was some other effect that was causing the increase in the cBRS signal below ~50 mHz. In an effort to understand this, I closed the valve to the vacuum can. I had hoped to supress air pressure/density changes in the beam-path which would give a phase shift signal through index of refraction effect. To my surprise, the pressure sensitivity got signficiantly worse as seen in the first attached file - PZTControl_ValveClosed.png. The second file cBRS_PressCorr_ValveClosed.pdf shows the time trace of the scaled pressure, angle and temperature signal with some scaling. The pressure correlation is quite clear.
Two possible ways it could have gotten worse are - a) mechanical effects, such as pressure change producing stress on the vacuum can base producing tilt etc and b) stress on the vacuum can base affecting the fiber feedthrough.
Since this was clearly worse than before, I reopened the valve fully.
2. The third file (cBRS_Quiet.pdf) shows data under low wind speeds. I have shown cBRS angle data, the inferred tilt from cBRS, the PEM tiltmeter (fancy bubble level) and the ITMY seismometer acceleration/g (to convert to angle). The next page shows coherence between cBRS angle and Stage 1 rY, ITMY STS-X and Stage 1 X. The coherence at the microseism is due to the translation coupling.
The last file shows the same set of data under wind-speeds of ~20 mph. Note that regardless of the cBRS transfer function, the signal above resonance is trustable and shows a large increase in tilt which is similar to what we see at the end-stations. The PEM tiltmeter and the ITMY STS see an increase as well but they are smaller than the cBRS tilt in the 80-100 mHz region by a factor fo ~3. The coherence plot also shows signficiant broadband coherence between cBRS and Stage 1 rY (except at the microseism, likely due to an incorrect scale factor for the T240). The shape of the inferred tilt looks odd below ~50 mHz and indicates an incorrect transfer function. It looks like there is an additional systematic effect that I'm missing (I think it is not temperature or pressure so far). I'll continue to investigate.