J. Kissel, E. Merilh, J. Warner, T. Hardwick, J. Driggers, S. Dwyer
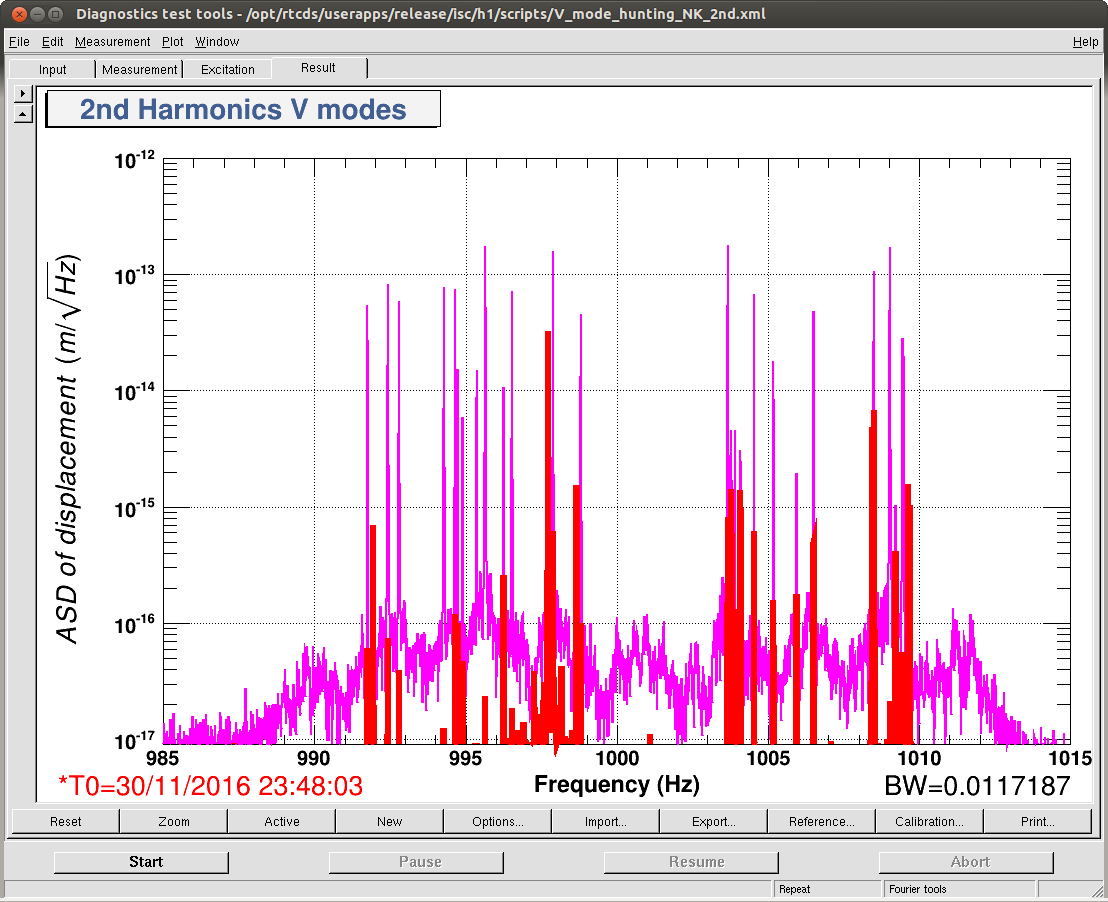
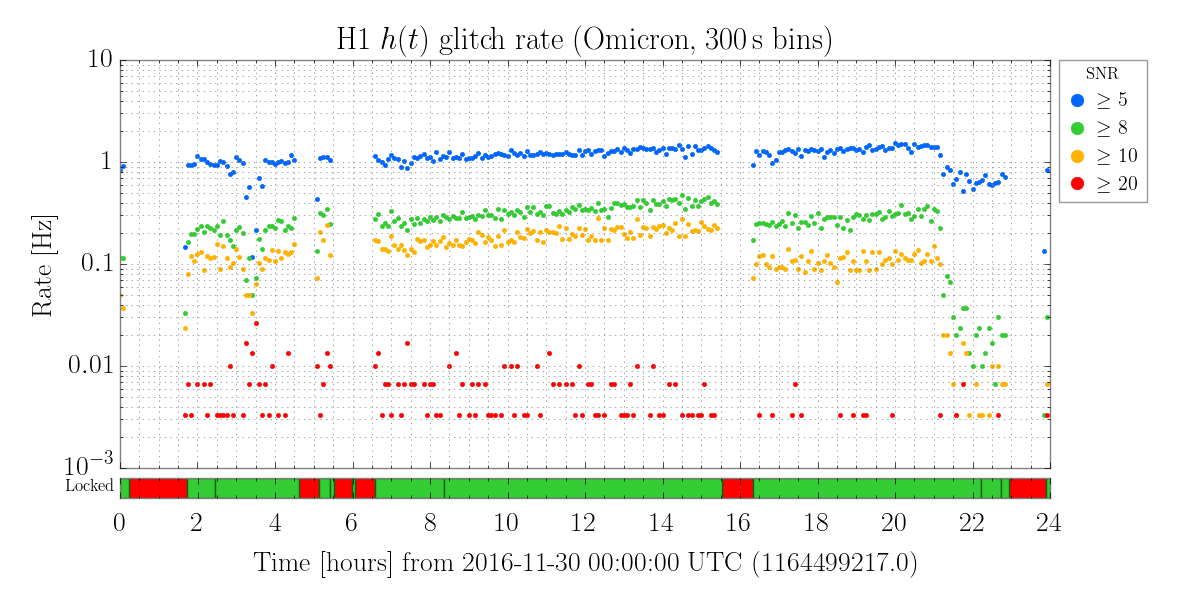
Prompted by DetChar worries about glitching around the harmonics of violin modes, Ed, Jim, and I went on an epic campaign to damp the ~1kHz, 2nd harmonic violin modes. These are tricky because not all modes had been successfully damped before, and one has to alternate filters in two filter banks to hit all 8 modes for a given suspension.
We've either used, or updated Nutsinee's violin mode table, with the notable newly damped entries being
994.8973 ITMY -60deg, +gain MODE9: FM2 (-60deg), FM4 (100dB), FM9 (994.87)
997.7169 ITMY 0deg, -400gain MODE9: FM4 (100dB), FM6(997.717) VERY Slow
997.8868 ITMY 0deg, -200gain MODE10: FM4 (100dB), FM6(997.89)
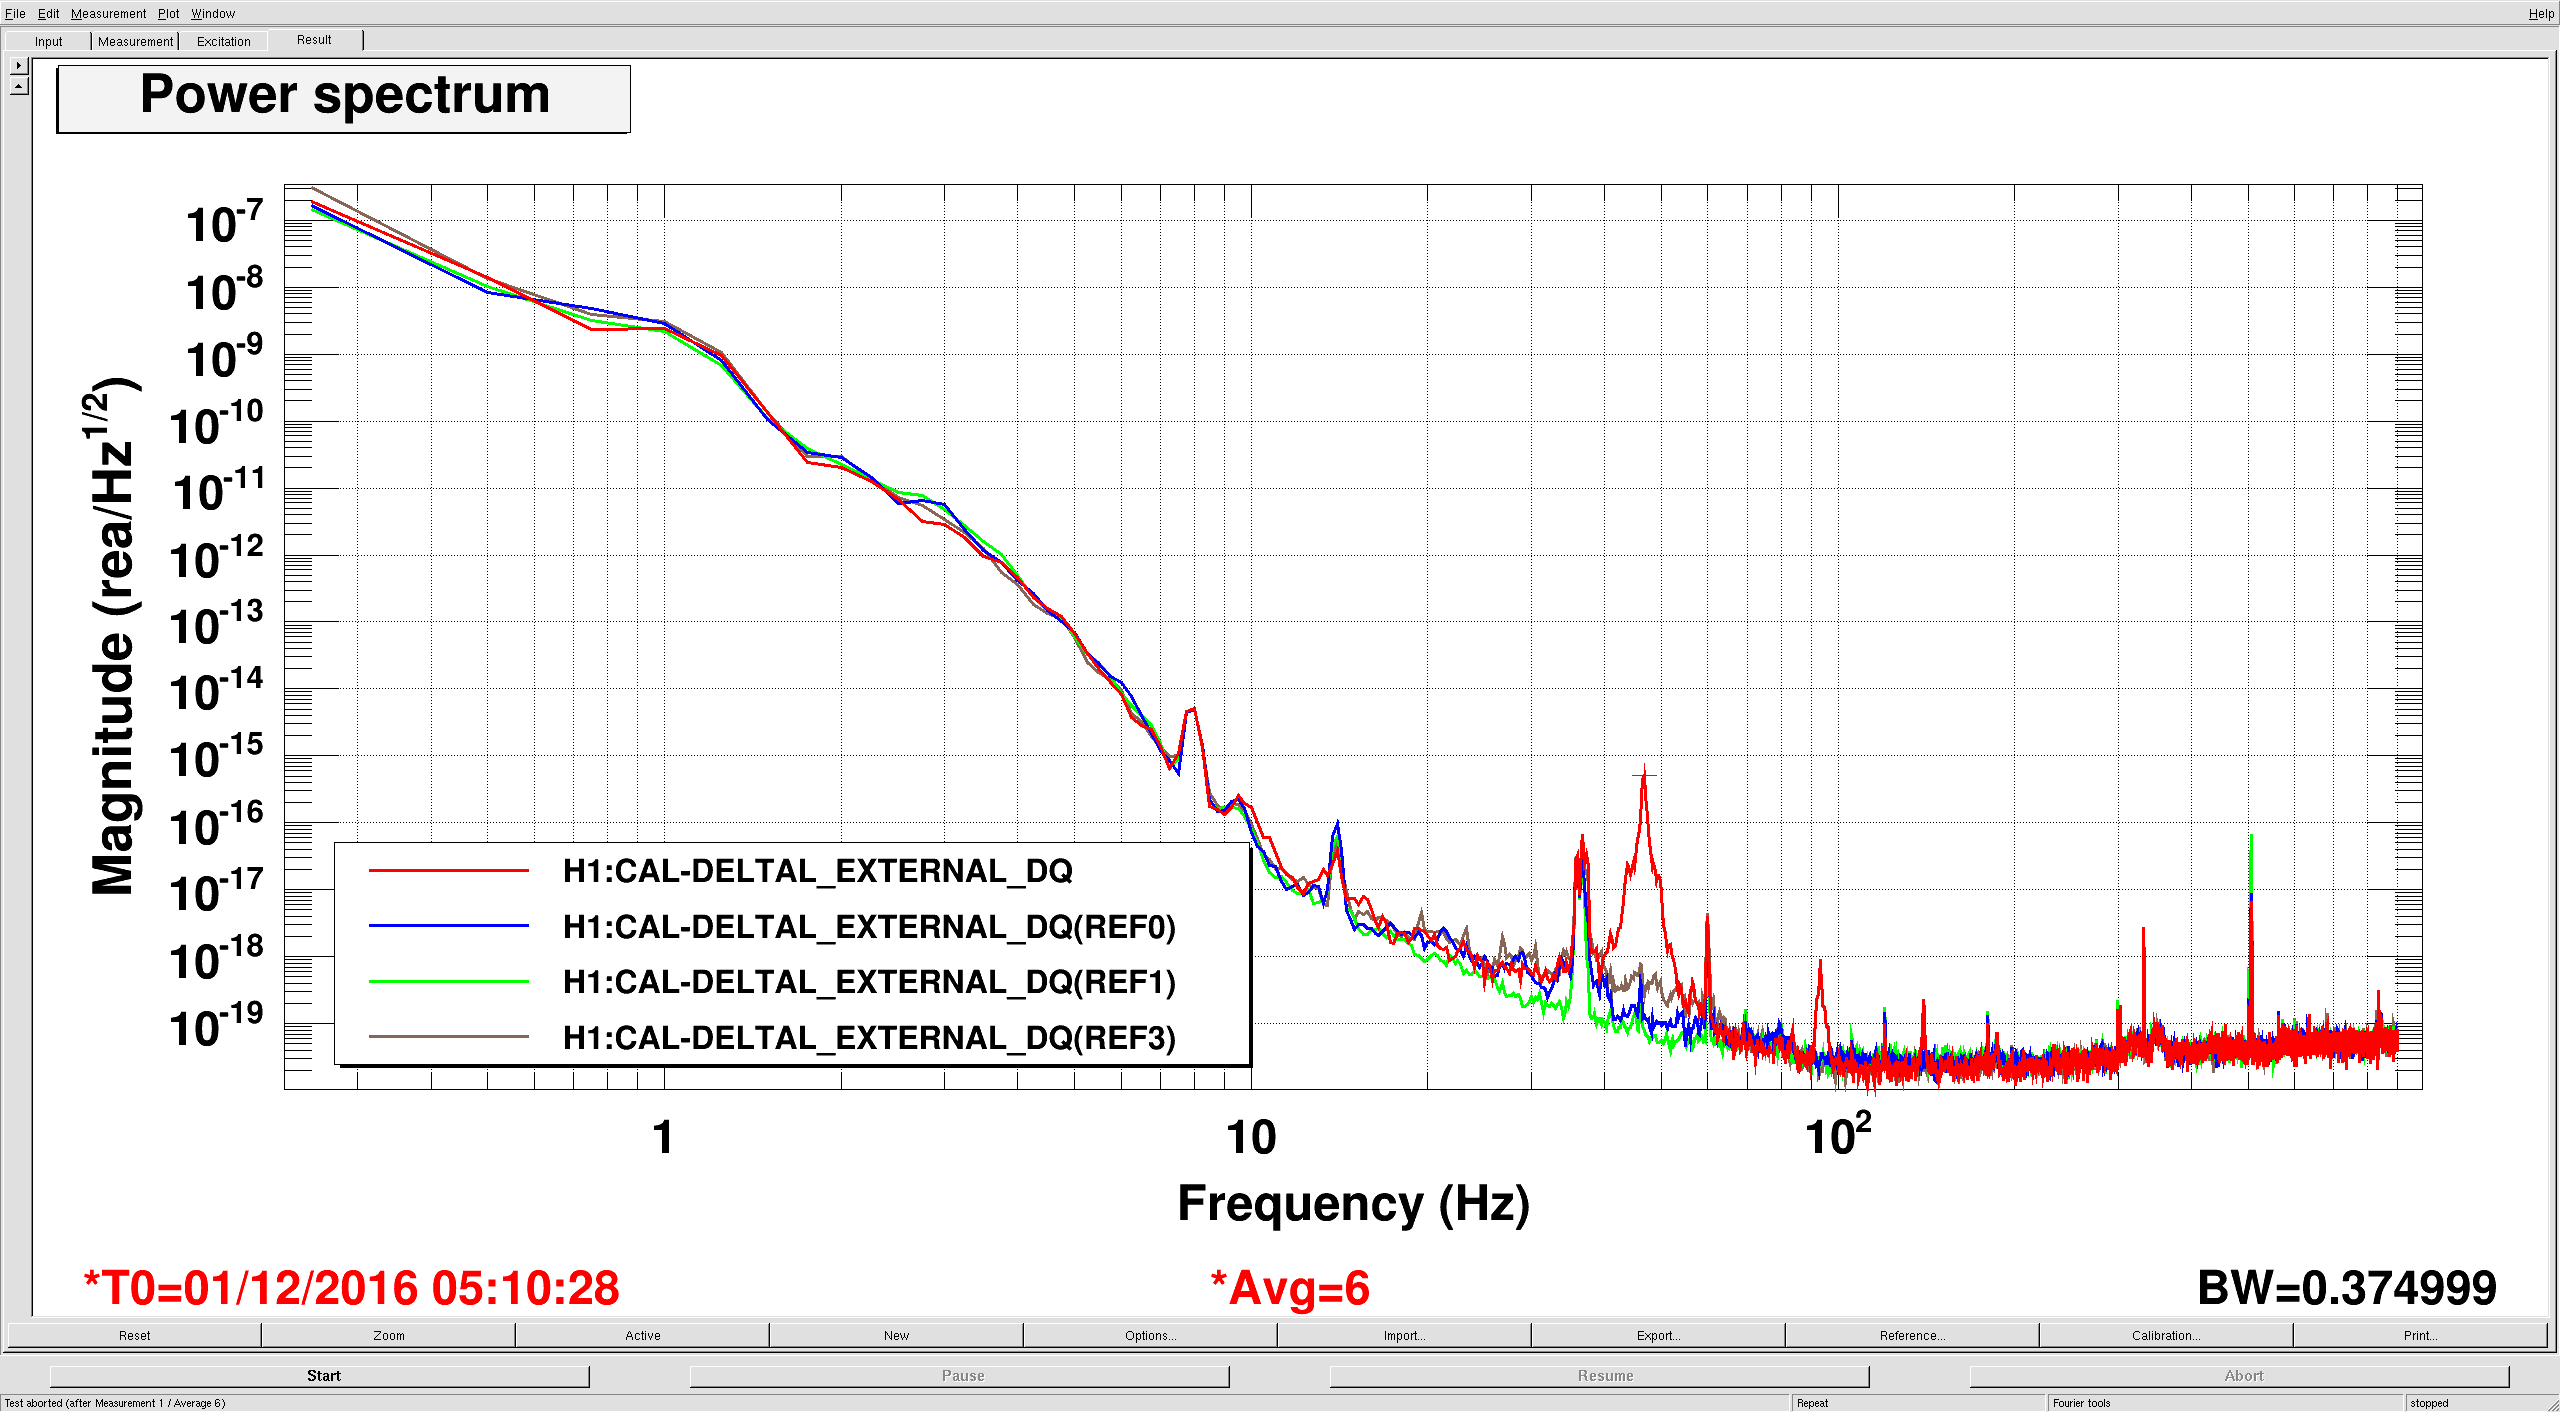
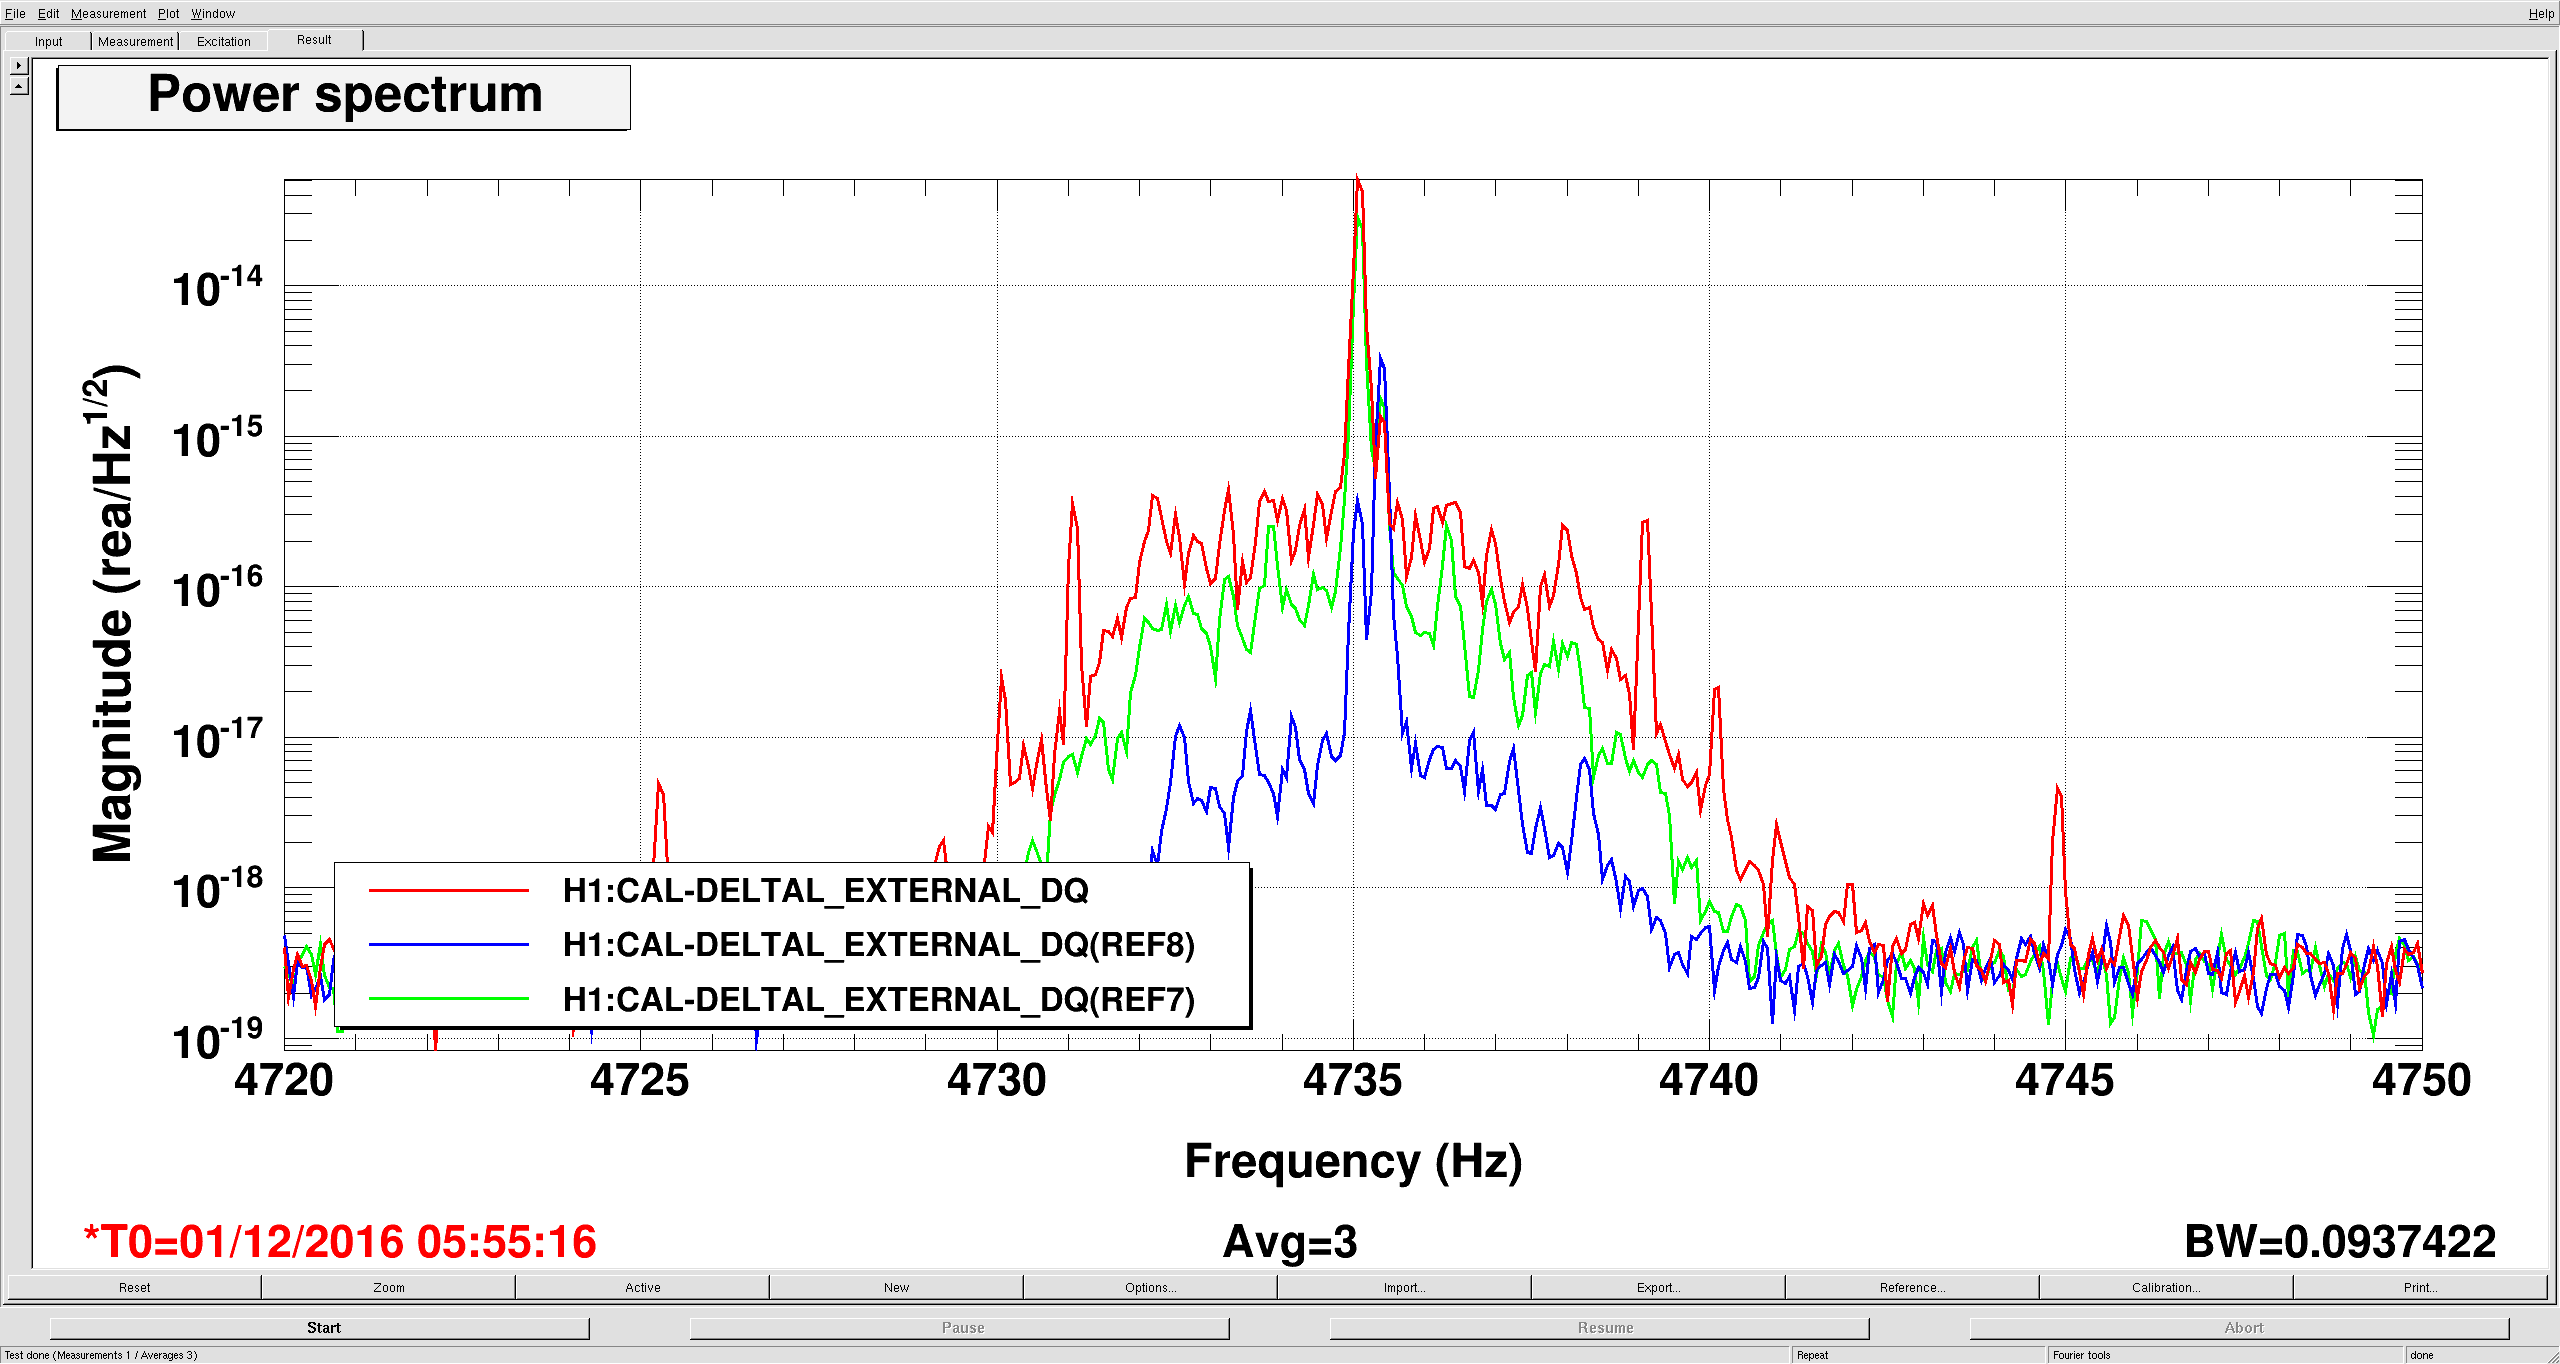
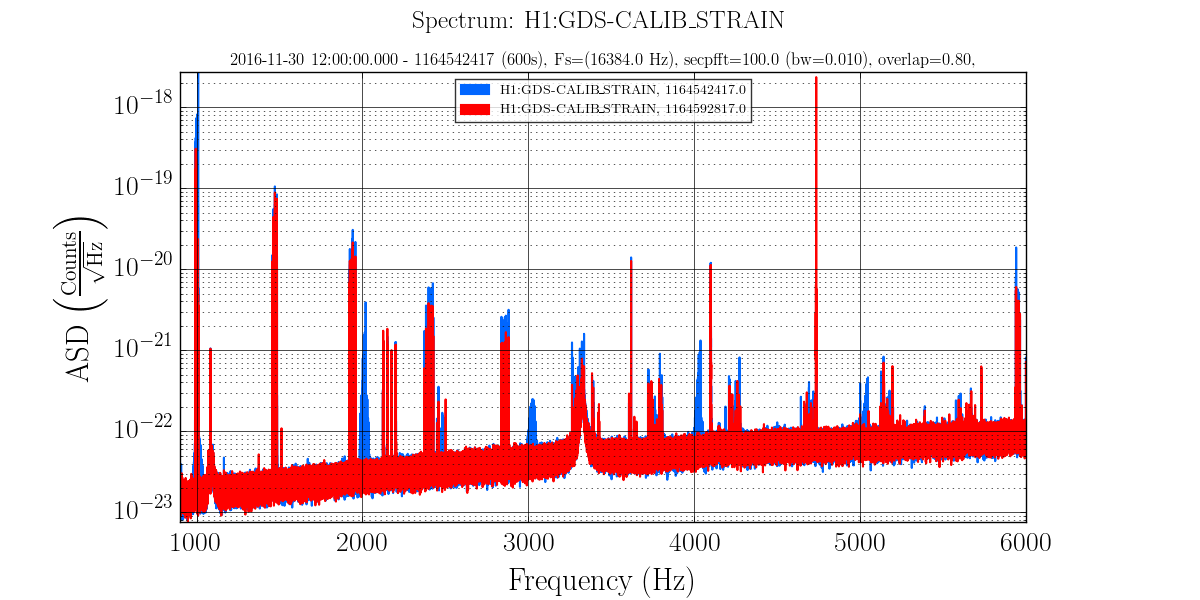
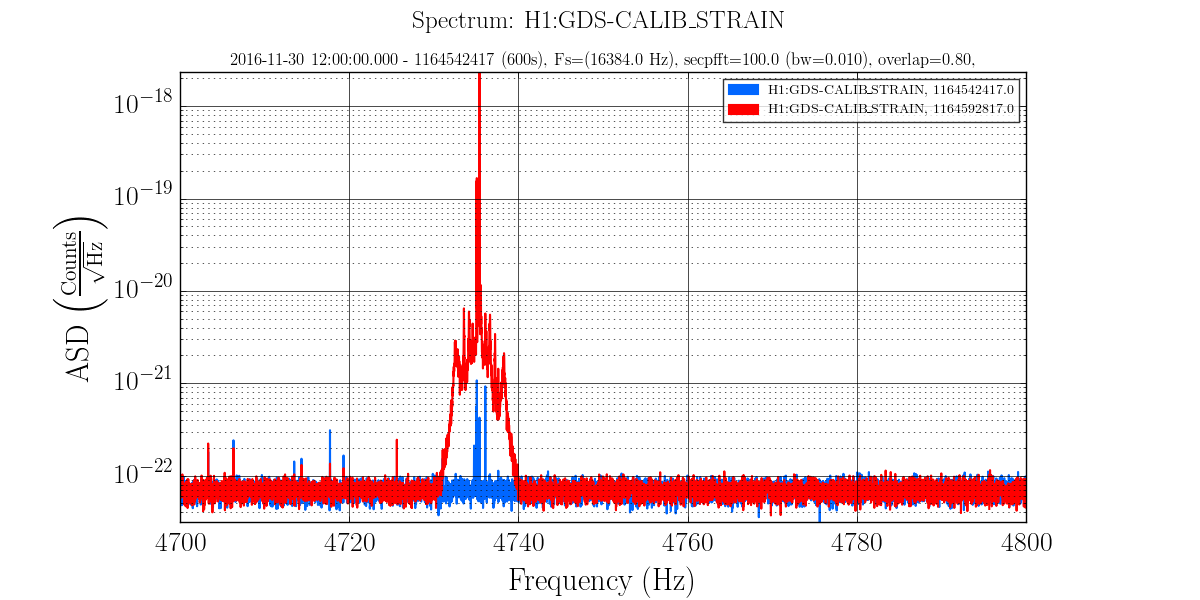
Also, we inadvertently rung up modes around 4735 Hz, so we spent a LONG time trying to fight that. We eventually won by temporarily turning on the 4735Hz notch in FM3 of the LSC-DARM2 filter bank and waiting a few hours. I had successfully damped the ETMY mode at 4735.09 Hz by moving the band-pass filter in H1:SUS-ETMY_L2_DAMP_MODE9 's FM10 from centered around 4735.5 to centered around 4735 Hz exactly, and using positive gain with zero phase. However, there still remains a mode rung up at 4735.4 Hz but it's from an as-of-yet unidentified test mass, and we didn't want to spend the time exploring. These 4.7 kHz lines have only appeared once before in late October (LHO aLOG 31020).
Attched is a before vs. after ASD of DELTAL_EXTERNAL. I question the calibration, but what's important is the difference between the two traces. Pretty much all modes in this frequency band have been reduced by 2 or 3 orders of magnitude -- better than O1 levels. Hopefully these stick through the next few lock losses and acquisitions.
Thanks again to the above mentioned authors for all their help!