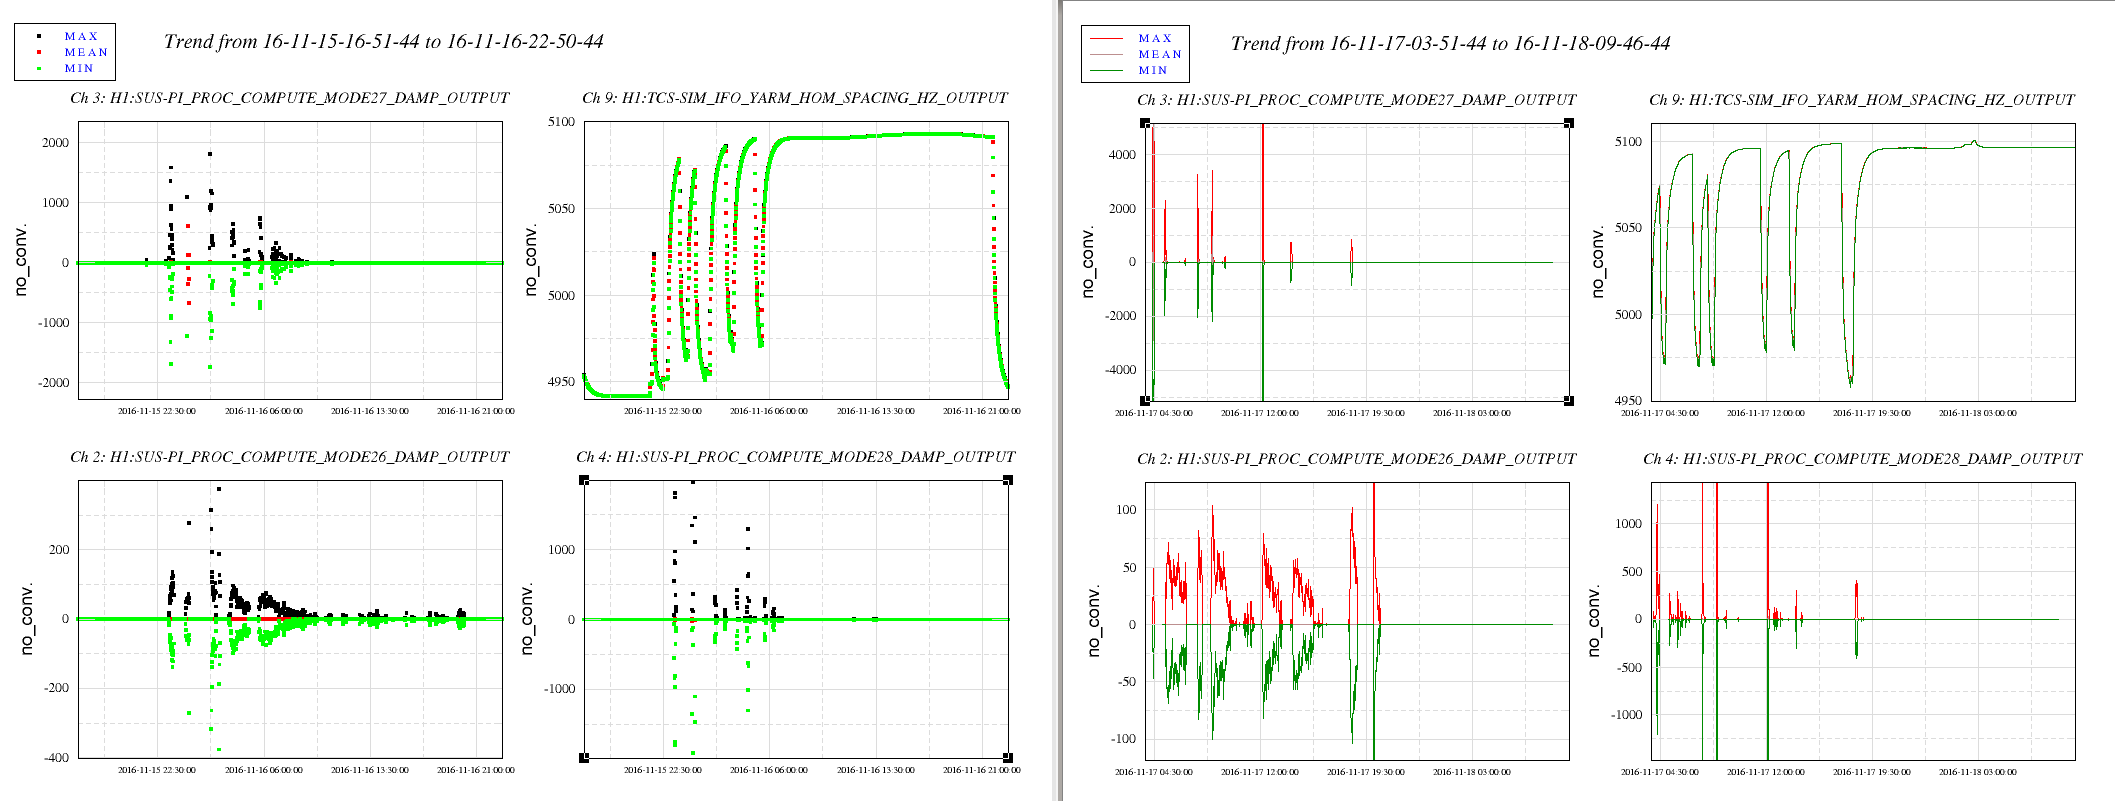
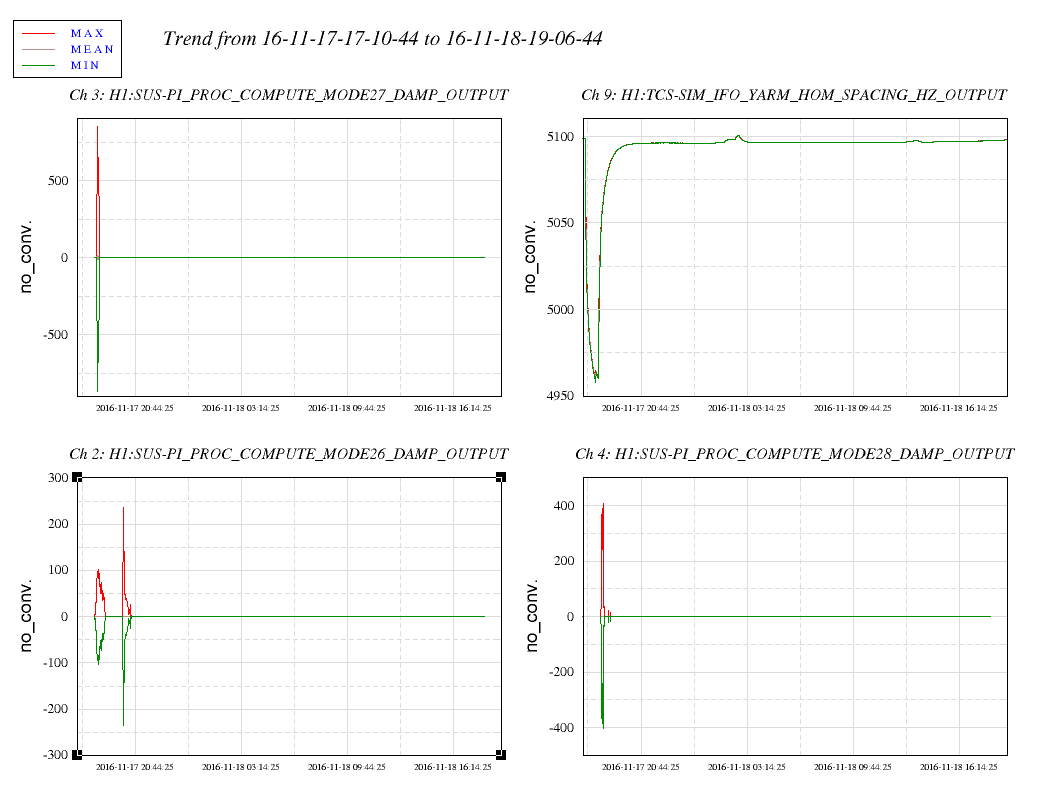
State of H1: OMC PD electroincs pulled for testing - issues are ongoing, OMC suspension issues are resolved
Activities: all times UTC
Dust:
Alignment:
J. Warner Jim has put gathered some data on the wind fence. Check out SEI aLOG 1050.
Chandra, Gerardo, Patrick Degassed the two nude ion gauges in corner station - PT170 & PT180 on BSC 7 & BCS 8. First degassed PT170 (700degC for 3 min. according to manual). We monitored the adjacent PT120 CC gauge, where pressure barely rose (8.48e-9 Torr to 8.52e-9 Torr). Pressures at the two ion gauges rose significantly and caused a verbal alarm at the operator console; pressures spiked to ~2e-7 Torr and then settled down to base pressures. Note: degassing draws ~ 70 W and thus caused PT120 pirani to flat line and CC to read bogus pressure reading during degassing. This happened during PT180 degas, but not with PT170. We also noticed that PT140A periodically flat lines - linked to PT110 (?).
System Check-In and issues discussed:
OMC:
All other systems / issues:
Visitors next week: Aug. 8-12
The OMC scan was performed last night after the chamber was covered. While the scan showed noimnal resonant features of the slightly misaligned cavity, I saw negative trips of the DCPD outputs (both) when the photocurrent is of the order of ~0.1mA.
The attched plot shows the refl QPD sum (CH1), scanned PZT Voltage (CH2), and the DCPD A/B outputs (CH3/4). The output of the DCPDs are usually positve, while they trip to negative occasionally when the cavity hit the major resonances. The positive voltage segments show nice resonant features when they are plotted in a logscale.
The refl QPD sum shows that the light was nicely absorbed by (transmitted through) the OMC. So it seems it is not optical.
I quickly checked the power supply condition of the field rack and confirmed that the related chassis are on.
We want to figure out this feature by the time we close the dorrs next week as the DCPD preamps are located in HAM6.
First thing that comes to mind would be to check the status and operation of the OMC piezo shutter for anything spurious... The dips are perfectly common to both diodes, so I would also look at the Split Whitening for: Bias to the PDs, DC power as supplied by the OMC Split Whitening Interface, and give special scrutiny to the most recent changes to the split whitening involving AC coupling of the OMC DCPD Chain for PI use.
Robert, Richard, Koji, Stefan
Bottom line: We think that this is simply the due to acousting vibrations modulating the OMC transmission in air - leading to ADC saturations. We thus decided to go ahead with the install.
Details;
We noticed that the drop to negative voltages is due to ADC saturations. When reducing the light to avoid saturations, we find that the RIN on the light is ~0.25 RMS. It is dominated by a peak around 1 kHz, and is coherent with the microphone.
Note that the OMC fringe width is only on the order of 1 nm, and its body mode is around 1kHz. It is not surprising that the thing vibrates more than that when in the horrendous acoustic environment of an open HAM chamber.
==============================
We verifyed with a light bulb that the electronics woks well up 0.3mA of current, which is higher than the previously observed problem. Case closed.
State of H1: progress with OMC, other work continues
Activities: all times UTC
LHO ALOG 28765 said: "We reached 30 (as measured by LSC-PR_GAIN - Evan claims this is more like 35)."
I have the same impression based on the IFO visibility (reflectivity) estimation from the power recycling gain. My rough estimation says LSC-PR_GAIN is ~15% underestimated, which is quite consistent with Evan's claim. His estimation of the PRG is based on the difference of the transmitted light level between the single arm lock and the full IFO.
The first attached plot shows the comparison of the measured and estimated IFO reflectivity (or visibility). The data was taken from four lock stretches on Jul 26. The measured value (magenta) was normalized to have the unity when the IFO was not locked. Also it was normalized by the incident power. This visibility includes the power of the modulation sidebands and the rejected junk light. So even if the IFO is critically coupled, it does not go down to zero. In stead, it goes to 0.018, which is an empirical number came from the second analysis.
Basically, I couldn't reproduce the measured visibility with the power recycling taken from LSC-PR_GAIN. The red curve was estimated from LSC-PR_GAIN using a Fabry-Perot model formed by the PRM (T=0.031) and the perfect mirror with a loss between them. The blue curve is the estimated loss (or say, the reflectivity defect of the compound mirror by FPMI+SR). When the incident power (not shown here) was increased in every lock stretch, the power recycling gain went down and thus the estimated loss went up. But more reflection was expected because of severe undercoupling. In reality, we didn't have such amout of reflection. Also during the power up, it seemed that the IFO was still undercoupled, while the estimation showed less reflection.
If the power recycling gain is scaled by +15% (times 1.15), we can explain the measured visibility better. The second attachment is the same analysis with the PRG scaled. We have better explanation of the initial overcoupling part, the dip at the critical coupling, and the low reflectivity at high power.
The same effect can be obtained by changing the PRM transmissivity from 0.031 to 0.036. However, it is an unlikely assumption.
We probably can imprve the model by taking the sideband recycling gains and the modulation depths into account. If the model is made precise enough, we might become able to estimate the ammount of the junk light due to thermal lensing, for example. Also this analysis gives us realtime monitor of the internal loss in the IFO and this gives us more sensitive measure how good the IFO alignment/lensing is, compared to looking at the power recycling gain which is a small change of a high number like 30.
Krishna, Michael
While noise hunting for the cBRS, we noticed that our piezos were singing at a high frequencies. After further investigation, we found ~8 kHz noise on all four of our channels coming out of the PEM anti-imaging chassis whenever we assert a value to the DAC. We ended up installing some 100 Hz low pass filters just before the cBRS electronics box to fix the issue on our end.
Attached is a scope view of the noise. The signal is on channel 2 of the scope.
J. Kissel Betsy and Koji have left the chamber this evening with what they though should be a freely suspended collection of SUS in HAM6 (see more details of their work in LHO aLOG 28882), so I volunteered to run a health check, comparing transfer functions to the reference measurements I'd taken just before the vent. In short: - the OMs all look identical to how they looked before the vent: free and with resonance frequencies and Qs where expected. - The OMC looks to have its top mass locked up in the Transverse / Roll direction (probably just a forgotten set of earthquake stops), but otherwise all modes look to have nicely high Qs. The resonant frequencies of all modes of the L, P, and V DOFs have all decreased slightly. It's as of yet unclear if this is because of the tiny addition of mass (6 [g] out of the old 7161 [g], or new 7167 [g]), or because of some other mechanism (like the top mass being locked in Transverse). I've informed Koji of this assessment, but there's still plenty of in-chamber work to do, so we can continue to iterate to improve / restore the suspension dynamics. I attach screenshots of the OMC transfer functions from DTT showing the locked M1 mass. BLACK is reference in-air measurements, and RED is the current state of the suspension. The PDF attachments are comparing the OMs with previous results; as mentioned above, nothing exciting in there. Data templates: /ligo/svncommon/SusSVN/sus/trunk/OMCS/H1/OMC/SAGM1/Data/ 2016-08-05_0128_H1SUSOMC_WhiteNoise_L_0p2to50Hz.xml *** 2016-08-05_0128_H1SUSOMC_WhiteNoise_P_0p2to50Hz.xml *** 2016-08-05_0128_H1SUSOMC_WhiteNoise_R_0p2to50Hz.xml *** 2016-08-05_0128_H1SUSOMC_WhiteNoise_T_0p2to50Hz.xml *** 2016-08-05_0128_H1SUSOMC_WhiteNoise_V_0p2to50Hz.xml *** 2016-08-05_0128_H1SUSOMC_WhiteNoise_Y_0p2to50Hz.xml *** OM1/SAGM1/Data/2016-08-05_0133_H1SUSOM1_M1_WhiteNoise_L_0p2to50Hz.xml OM1/SAGM1/Data/2016-08-05_0133_H1SUSOM1_M1_WhiteNoise_P_0p2to50Hz.xml OM1/SAGM1/Data/2016-08-05_0133_H1SUSOM1_M1_WhiteNoise_Y_0p2to50Hz.xml OM2/SAGM1/Data/2016-08-05_0145_H1SUSOM2_M1_WhiteNoise_L_0p2to50Hz.xml OM2/SAGM1/Data/2016-08-05_0145_H1SUSOM2_M1_WhiteNoise_P_0p2to50Hz.xml OM2/SAGM1/Data/2016-08-05_0145_H1SUSOM2_M1_WhiteNoise_Y_0p2to50Hz.xml OM3/SAGM1/Data/2016-08-05_0201_H1SUSOM3_M1_WhiteNoise_L_0p2to50Hz.xml OM3/SAGM1/Data/2016-08-05_0201_H1SUSOM3_M1_WhiteNoise_P_0p2to50Hz.xml OM3/SAGM1/Data/2016-08-05_0201_H1SUSOM3_M1_WhiteNoise_Y_0p2to50Hz.xml All have been committed to the svn. *** I don't recommend using the 2016-08-05_0128 templates for the OMC transfer function, because I paid no attention to drive strength or frequency resolution. They were older in-air templates, so I wanted to make sure I was comparing in-air references to the current in-air state. But unfortunately they have different requested frequency resolutions so matlab post-processing analysis is painful, and the drive has no low-frequency boost so coherence is less than it could be. In the future, I would use the templates that I tuned for in-vacuum from LHO aLOG 28736.
[Betsy, Corey, TJ, Koji]
- Now the OMC cavity is flashing!
- The OM1~3 and OMC suspensions have been debiased, and the OSEMs were tweaked to have the flags at the center of them.
- The optical paths such as the OMC incident path, OM1 transmission path, OMC refl path ahve been aligned.
We still need to align the WFS and OMCT paths and confirm viewport paths if the beams are hitting the viewport.
- Currently the OMC PZT HV is ON.
Shutter mirror inspection
The surface of the shutter mirror was checked with the green lantern. We didn't observe any sign of degradation.
Mass balance
- We adjusted the weight of the new OMC to match with the old one as much as possible. Then the mass was moved to have reasonable flag positions in the OMC suspension.
|
OLD OMC OMC ASSY-D1201439-002 Balance mass arrangement (Topview)
OMC (6960g) + Mass (201g) = 7161g |
New OMC OMC ASSY-D1201439-3_2 Balance mass arrangement - final (Topview)
OMC (6978g) + Mass (189g) = 7167g |
- The lateral position of OMCS RT OSEM was adjusted to have the flag at the center in the OSEM.
- The centering of the OMCS OSEMs were checked to be within the tolerance range.
- Along with the mass balancing, the positions of the EQ stops for the OMC breadboard were checked. We found several EQ stops were too close or too far. The EQ stop holders were adjusted to have them reasonable gaps to the glass breadboard.
Electrical functionality check
- The DCPDs were illuminated by a white flash light to check which DCPD responds to which channel. DCPDA and DCPDB are related to the DCPD on the transmission anfd reflection sides of the BS prism, respectively. (DCPD(T) = DCPDA, DCPD(R) = DCPDB). This seemed opposite to the case with the previous OMC. It was found that the difference in the internal cabling on the OMC caused this difference. This will be noted in the OMC testing procedure document (T1500060) athough this does not affect the calibration.
- The OMC QPDs were illuminated by the flash light. QPD1 (short arm) and QPD2 (long arm) correspond to QPDA and QPDB, as nominal.
Incident beam alignment & suspension debiasing
- Prep: IMC was locked at 2W. The beam was aligned on to the center of AS_C QPD.
- At this point, we already could observe the beams were on the OMC QPDs. Very good reproducibility.
The signal ratios between OMC_QPD_A/B_SUM and AS_C_QPD_SUM (0.56 and 0.59 today) were confirmed with the ones with the numbers on Jul 28 (0.48 and 0.45).
These ratios were enough similar to convince ourselves that they are the real spots.
From this point, we could follow the procedure in T1400588 (sec 2.3.3 and later).
- OMCS and OM3 were debiased to have (0,0), and used OM1 and 2 to align the spots on the OMC QPDs.
- This made OM1 Yaw ~-2000, and the OMC2 Pitch ~1500.
- The OM1 suspension cage was twisted to remove the OM1 Yaw bias.
- The OM2 suspension pitch adjustment screw was adjusted to remove the OM2 Pitch bias.
- The resulting offsets were: OM1 (116.9, -229.0), OM2 (94.5, 113.0), OM3 (0,0), OMCS (0,0) => Requirement <250 = 1/10th of the full scale => OK!
- We quickly checked some suspension transfer functions for OM1/OM2 and OMCS. OM1 and OM2 showed consistent TFs as the previous measurements. OMCS had the same resonant structures as before except for the resonant frequency of the lowest frequency mode. JeffK is checking the TFs more carefully.
- We turned on the PZT HV and scanned the PZT2 voltage. We confirmed that the OMC DCPDA and DCPDB were observing the OMC flahses.
Optical path check
- Main path: The spot positions on OM1/2/3 were checked. They looked fine.
- Shutter path: The mechanical shutter path was checked. It is still nicely aligned.
- OM1 trans path: The beam alignment in the OM1 transmission was checked. They looked fine. We still need to check the AS AIR viewport path with the viewport emulator.
- OMCR path: The beam spots on the OMCR steering mirrors were checked. The beam was not on the center of the steering mirrors. The first steering mirror (so-called M8) in the OMCR path was moved. The reflection path for 90:10 BS and the beam diverter path was checked. They looked just fine. M10 and M11 were used to align the spots on the OMCR QPDs. We didn't use M9 this time. We'll check this path again once the viewport emulator is attached on the chamber tomorrow.
- WFS path / OMCT path: We will work on these paths tomorrow.
Next steps
- Restore OMC blackglass shroud if the OMCS TFs look OK.
- Restore OMCT steering mirror
- Place the viewport emulator
- Confirm spot locations on the viewport
- We want to check the calibration between AS_C QPD SUM, the incident power on OM1, and the incident power on the OMC breadboard.
- Ground loop check
- Other SUS/SEI exit check
More detailed assessment of the OMC and OM SUS can be found here: LHO aLOG 28883. The OMC is locked up in Transverse / Roll, otherwise all SUS look healthy.
Assuming this is the case, we need to check the upper mass EQ stops to make sure the upper mass gets completely free.
Also this action will change the position of the OMC glass breadboard. Therefore the beam alignment should be revisited again.
(Photos From Yesterday's Work)
Not many taken with alignment/optic work mainly on the plate. Photos can be found here:
https://ligoimages.mit.edu/?c=1702
9:30 AM THUR AUG 4th, 2016 - Chamber entrance Particle counts with hand held CC counter:
| Particle size | Outside of chamber cover, in CR | In chamber above table |
| 0.3um | 10 | 10 |
| 0.5um | 0 | 10 |
| 1.0um | 10 | 10 |
J. Kissel I've processed yesterday's measurements, found that the ETMX data was junk anyway, so I retook both test mass charge measurements. Attached are the result. The trend of charge accumulation continues, without fail. I wish I had thought of this sooner, but for the duration of the vent, I've turned the BIAS on both end station's ESDs OFF. This way they at least won't accumulate any more charge for a ~week. It won't make a big difference but it's something. Immediately after we've recorvered the IFO and we're satisfied with its operation, we *need* to flip the BIAS sign to begin to mitigate what charge has accumulated. Also -- it would be really nice if we identified the source of the residual free ions in the chambers and reduced the accumulation that way. A while back, I'd started to work with the VE team to identify the remaining potential sources (see LHO aLOG 23906), but it feel off my radar to continue to push when I found so little documentation of the gauge array. Also, though we'd ruled out photoelectric emmission from the ALS system early on, it might be worth a reconfirmation, but I'm not sure we can go as long as we'd need to see an effect without the ALS system. Anyways, here's hoping someone out there gets re-excited about this.
-------------------------------------------
Quick conclusion: We swapped all the silver coated mirrors on HWS X and Y table (18 total, 9 per table). Stream images now look better compared to what we used to have (alog28624)
-------------------------------------------
Details:
Livingston found their mirrors to be contaminated (alog27041) so we went out to check ours and discovered similar (if not the same) issue (alog28624). Today we swapped out all the silver coated mirrors and realign them following procedure in T1600329. The old mirrors are covered with dust and tiny particulates that won't get blown away by compressed air. Some mirrors are covered with scratches that couldn't have happened naturally (not just by sitting on the table). Some have tiny holes that almost look like damages from laser. Tomorrow Jason will try to drag wipe some of the mirrors to see if the particulates can be cleaned.
Below are some pictures of the old mirrors we pulled out.


We inspected every new mirrors for dust and scratches. They didn't come perfect. Some have tiny holes in them and dust that couldn't be blowned away. But overall the new mirror set is a huge improvement of what we pulled out.
Here are some photos of the new mirrors. These defects pretty much represent the whole batch. Only a few came without any defects at all.

Below are screenshots of the stream images after the mirror swap. Much better compared to alog28624
ITMX

ITMY

-------------------------------------------
Since I will be gone for a whlie and the thinning code isn't quite ready for action, I removed a bunch of old ETMS data to make room enough for 3+ weeks. None of the HWS codes are running right now since it wouldn't be writing useful data. Somebody will have to restart the code once the IFO is ready to go again.
At 15:00 PDT all the user models on h1susey stopped running. They showed DAC errors. The IOP model continued to run, so SWWD did not trip. We suspect power cycling of the optical lever system which was occuring around this time could be the culprit. I restarted all the models, they all restarted with no problems.
J. Kissel I was able to grab some charge measurements yesterday afternoon. Will process in good time. Only 4 and 3 of the data points for ETMX and ETMY were free of problems, so though there are 5 and 4 folders, I suspect only the first for will process correctly. Folders are quoted below lest we forget: /ligo/svncommon/SusSVN/sus/trunk/QUAD/H1/ETMX/SAGL3/Data/ data_2016-08-03-19-47-12 data_2016-08-03-19-59-06 data_2016-08-03-20-10-54 data_2016-08-03-20-22-36 data_2016-08-03-20-34-21 /ligo/svncommon/SusSVN/sus/trunk/QUAD/H1/ETMY/SAGL3/Data/ data_2016-08-03-19-55-57 data_2016-08-03-20-07-41 data_2016-08-03-20-19-26 data_2016-08-03-20-31-11
Charge measurements have been processed and/or retaken. See LHO aLOG 28881.
The HV power cable for the Y2-8 ion pump has been repaired. The damaged section was cut off, and the cable was spliced together. Cable was tested with the HI-POT tester to 5KV.
Connected cable to controller and turned ion pump on. Pump is pumping now, see attached for 3 hour trend data.
Thank you!!
Work done under WP #6047 and FRS ticket 5992 closed
The shot noise level from last night seems higher (worse) than the O1 level by 6%. Here is the spectrum:
You can see that the red trace (which is the one from the last night) is slightly higher than the (post-) O1 spectrum. The 6% increment was estimated by dividing the two spectra for frequencies above 1200 Hz and taking a median of it.
Evan H. suggested looking at the null and sum channels to see if the excess in shot noise is from an addition technical noise or not. The attached shows the spectrum of the null and sum channels at the same duration as the spectrum in the above entry.
From this plot, it is evident that the excess is not due to technical white noise.
I have checked the calibration of the DARM signal by comparing it against the Pcal excitation signals. I used the same lock stretch as the above entry. The height of the Pcal line at 331.9 Hz in the DARM spectrum was found be too high by 13% relative to the Pcal TR and RX PDs. See the attached. This means that we have overestimated the DARM signal at 331.9 Hz due to a calibration error. If we assume this is all due to an inaccurate optical gain, actual shot noise level should be smaller by the same factor of 13% that what we thought, corresponding to a ~7% smaller shot noise level than that in O1. We need to nail down whether this is an error in the optical gain or cavity pole in order to further evaluate the calibration error.
Note that the Pcal Y uses a fresh set of the calibration factors that was updated a month ago (27983). The ratio of RX PD over TX PD was found to be 1.002 at 331.9 Hz and this makes me think that the Pcal Y calibration is reliable.
Here I have attached plots of the optical gain during this lock as well a few locks randomly picked during the month of July. I used O1 model as reference (wasn't not quite sure whether there was new time zero reference after O1 with all kappas set to 1). The first plot showing kappa_C over a few locks during July show that kappa_C values were close to 1. However here we note that the gain in the inverse sensing function during July was set to 1.102e-6 compared to 8.834e-7 during O1 (the referene model has changed). At high frequencies, the relation between corrected h(t) and h(t) recorded in front-end is,
corrected h(t) ~ h(t) / kappa_C ~ inv_gain * DARM_ERR / kappa_C
So for same DARM_ERR, kappa_C of 1 during July 2016 corresponds to 0.8 * h(t) (= 8.834e-7 / 1.102e-6) as that of during O1. This assumes that there wasn't any change in the gain of the electronic chain on the OMC side. The second plot show trend of kappa_C during the lock Kiwamu was looking at. An interesting thing to note here that there was ~10% change in the optical gain during this lock. Kiwamu's plot correspond to time of the second peak we see in the plot (a coincidence!). The kappa_C value of 1.15 suggests that the measured h(t) in the above a-log would correspod to 0.70 ( = 8.834e-7/1.102e-6/1.15) times that of h(t) we would be measured during O1. Since the trend plot show that there were times in the same lock during which the kappa_C values were different, I tried to compare the power spectrum between those times. The third plot show that comparison. The mystery is that eventhough the ratio between the 331.9 Hz photon calibrator line and DELTAL_EXTERNAL line is ~10 % different between the times compared (and hence corresponding to ~10% different optical gain), the shot noise level looks same! We couldn't get the exact cavity pole frequencies because at this point I don't have the new LHO DARM model function, but the trend indicated that it didn't change during the lock. For completeness we also added the acutation strength variation during this time. The values are close to what we expect. Since 35.9 Hz ESD line we used during O1 wasn't available, for actuation strength comparison we used 35.3 Hz ESD line.
EDIT: We corrected the earlier estimate of high frequency h(t) level change.
Also advertising a comment to Jim's log with the detchar tag: SEI log 1052