Sheila and Daniel pointed out that we could try using the uncontrolled IMC degree of freedom to mimic the WFS offset, without actually misaligning the cavity. I was able to do this for pitch, but was unsuccessful for yaw. Also, I didn't seem to affect the PZT excitation much, but I did get rid of much of the 260 Hz peak.
To DC couple the ISS, I held the output of the 2nd loop: H1:PSL-ISS_SECONDLOOP_AC_COUPLING_DRIVE hold switch on.
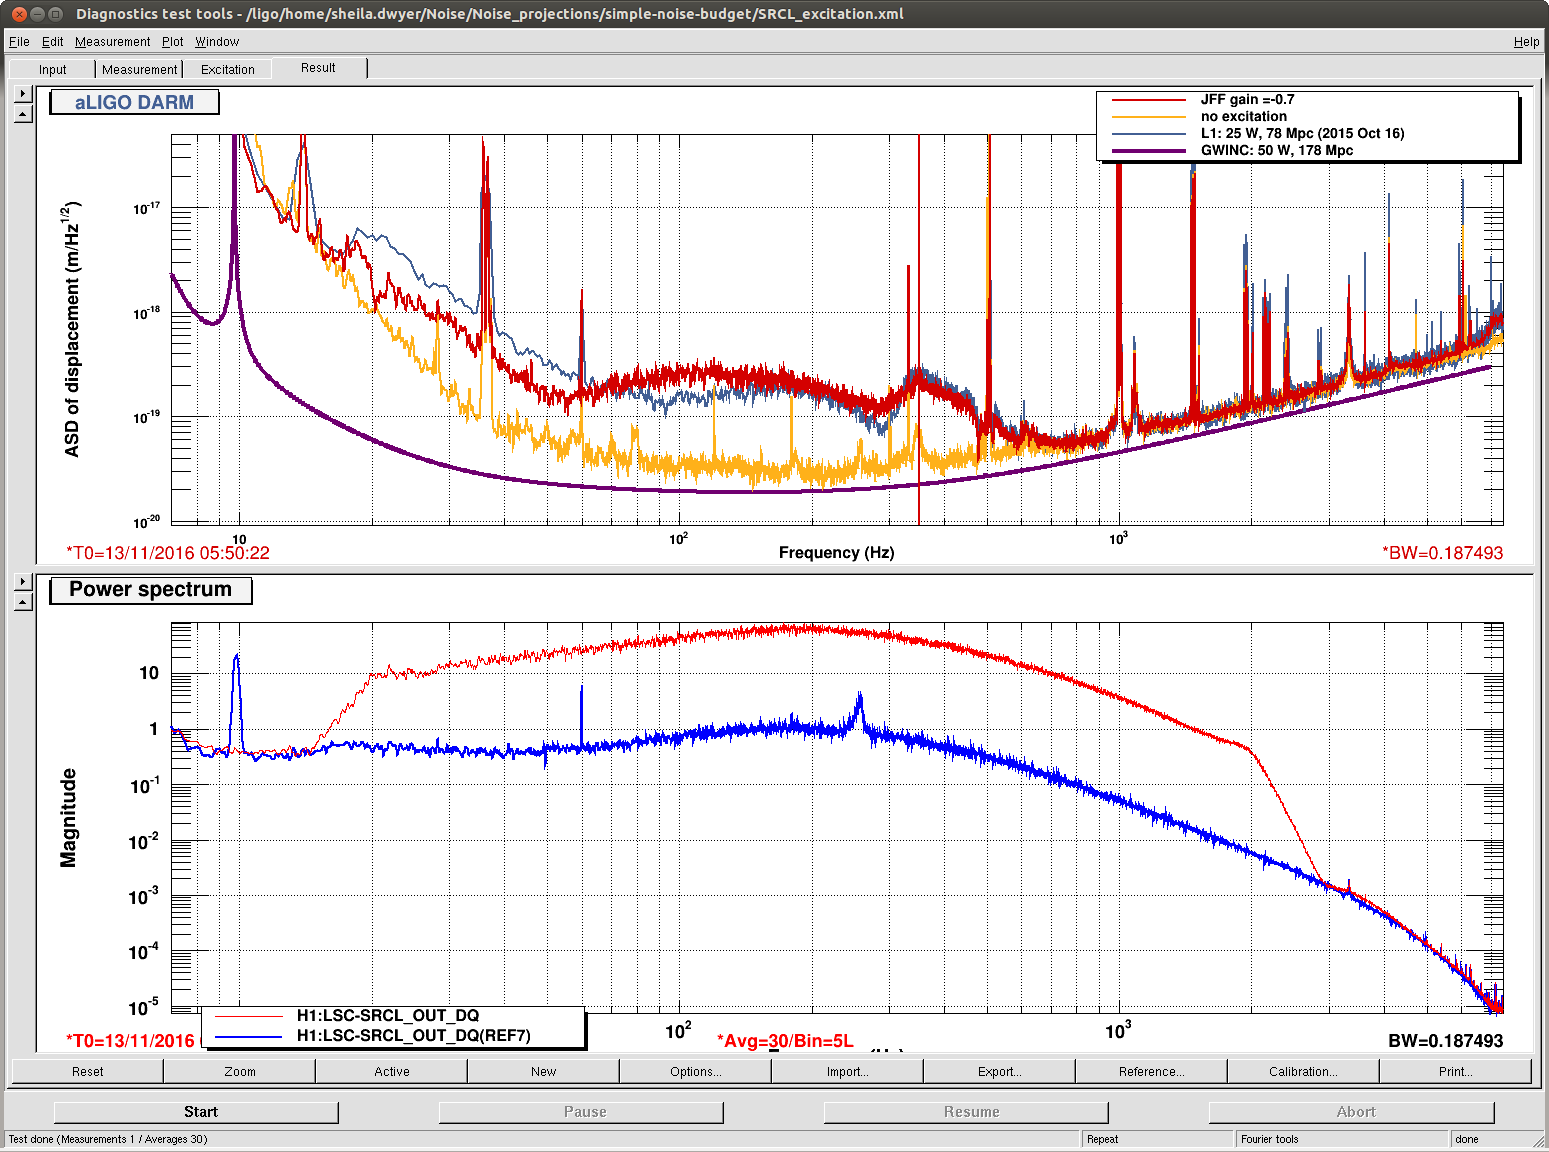
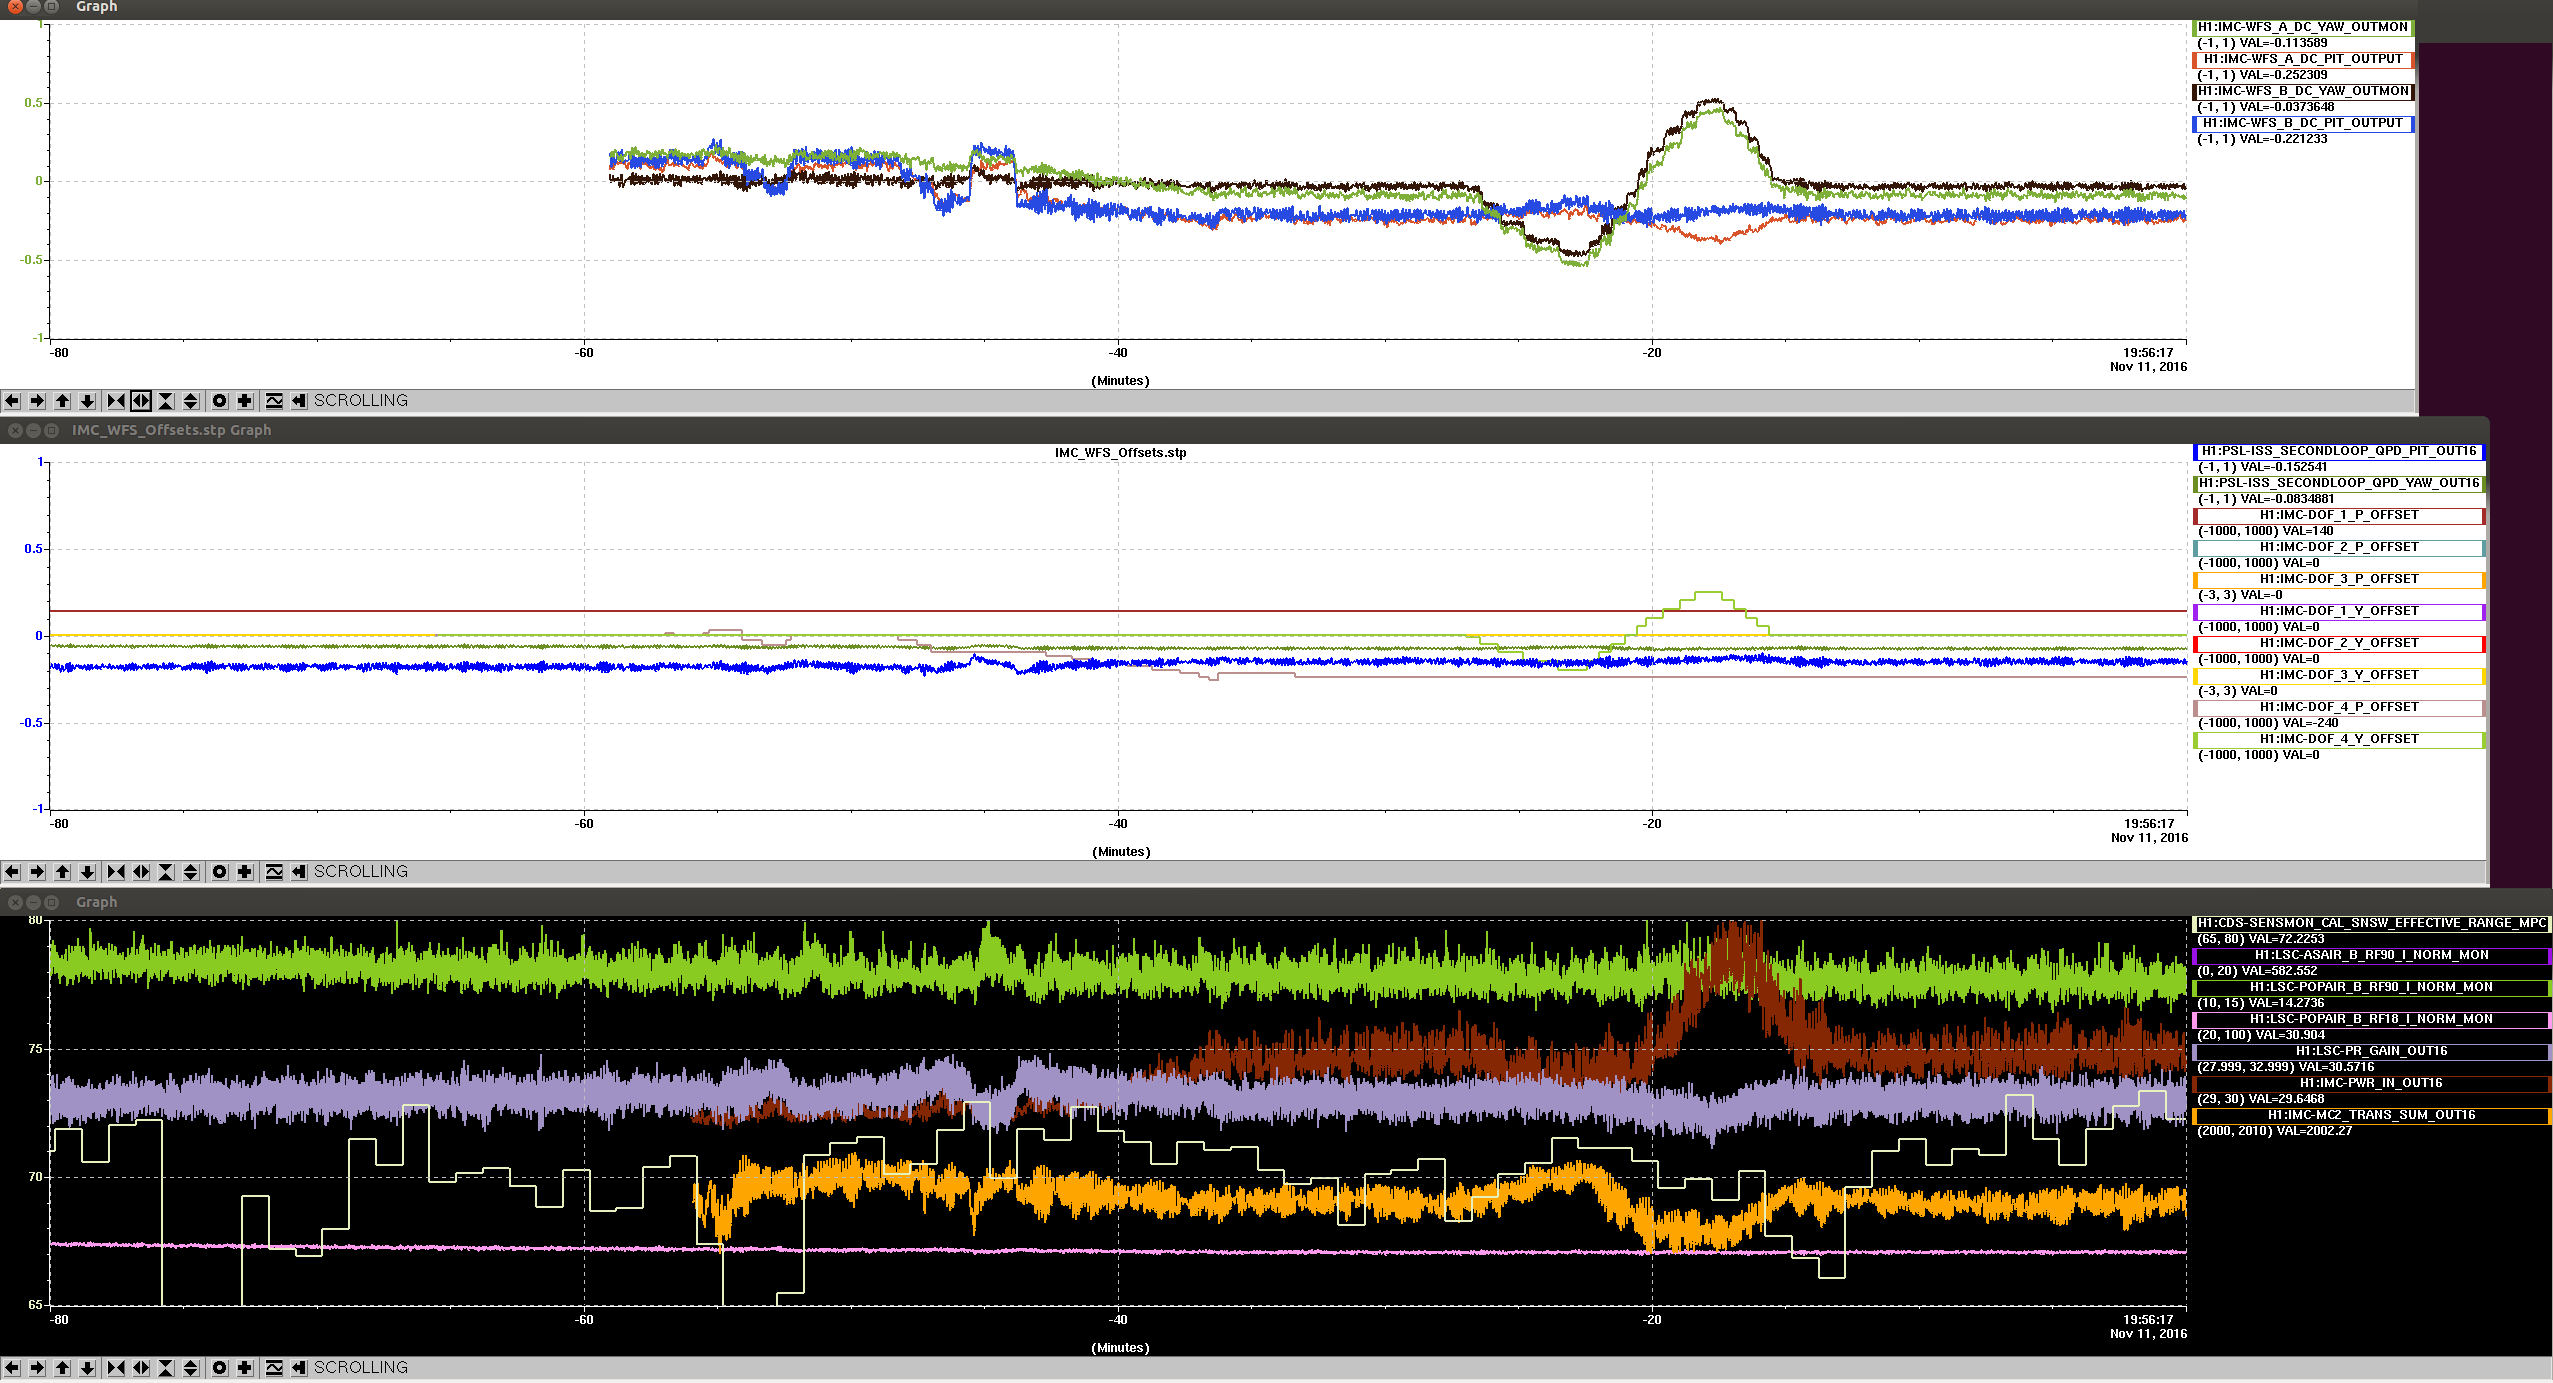
In the end, I have an offset in H1:IMC-DOF_4_P_OFFSET of -240. I tried offsets for the equivalent yaw from -200 to +250, and never saw a noticeable change in the ~150 Hz peak, ~350 Hz peak, or my PZT yaw excitation. The input to both DOF4's is off, no filter modules are engaged, and the filter modules have a gain of 1. These settings are accepted in SDF.
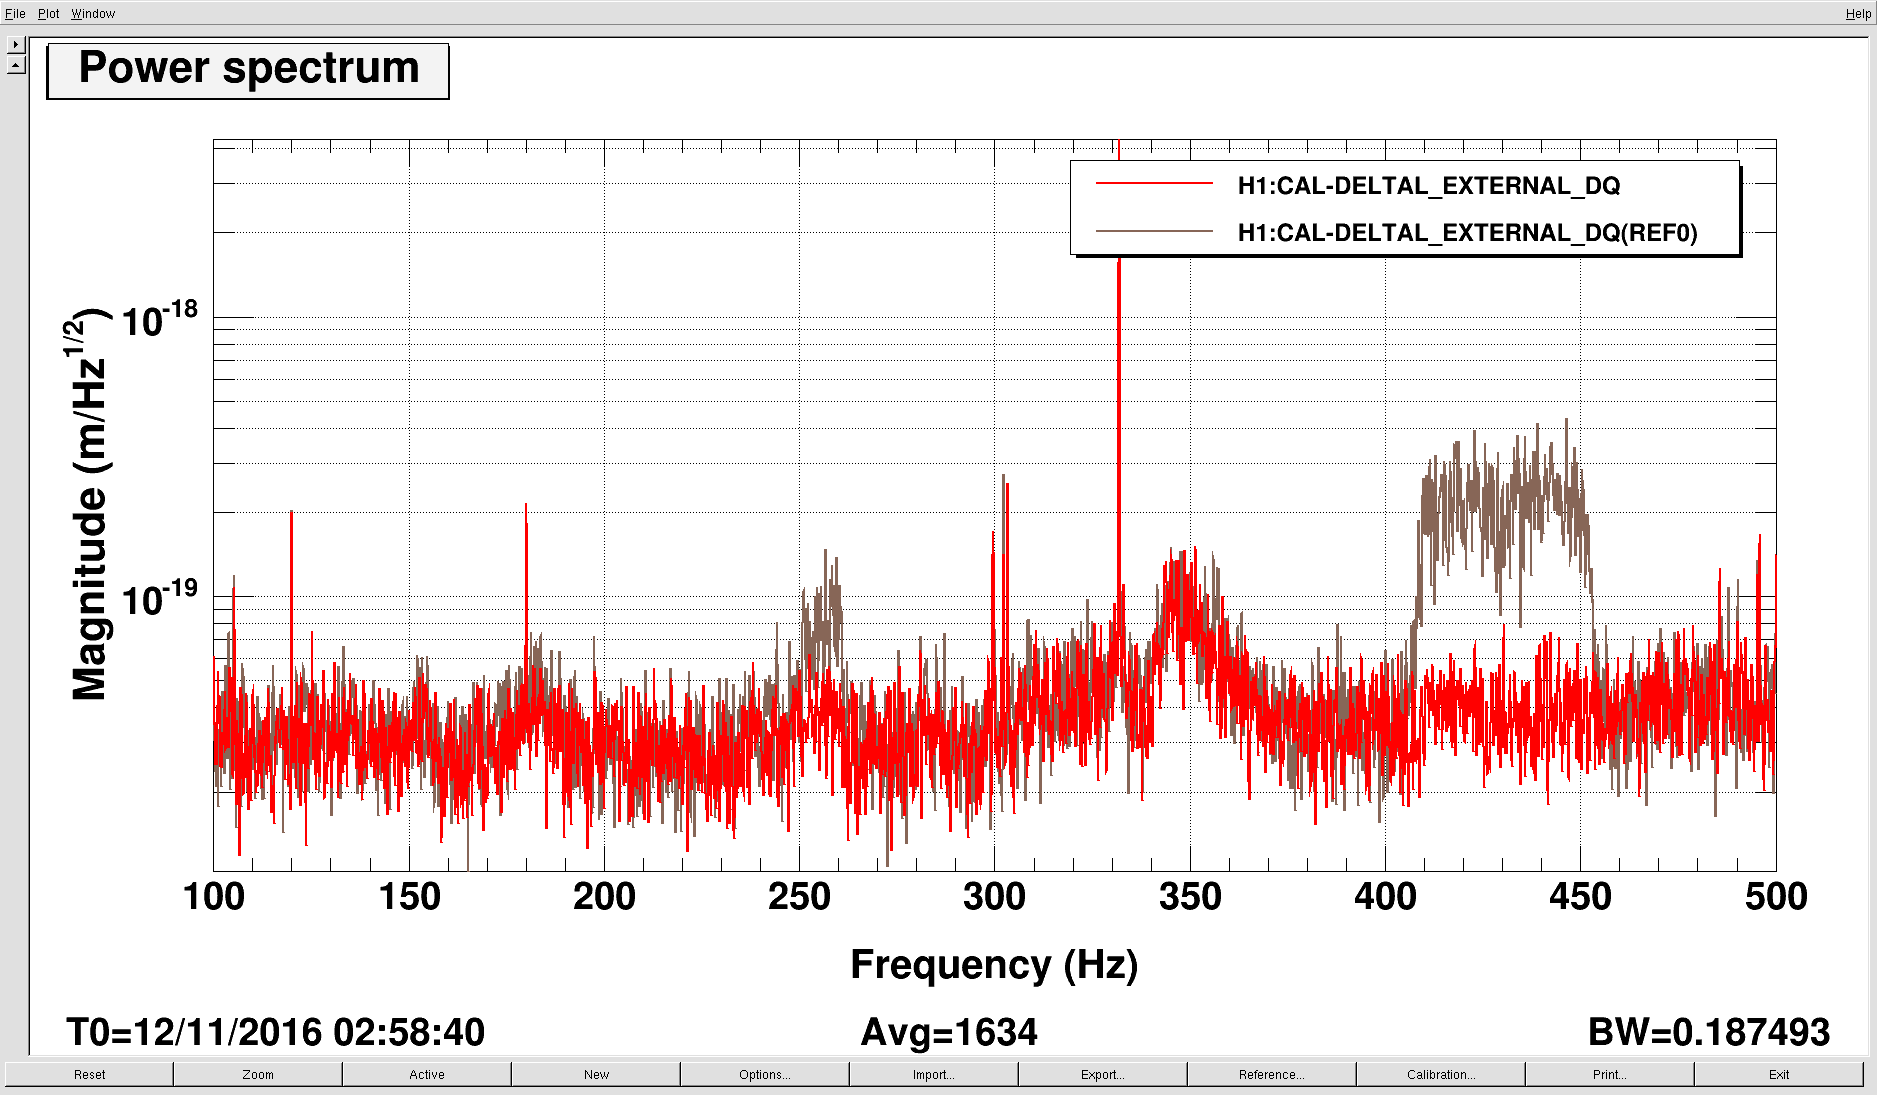
In the attached screenshot, Ref0 in green is with no offsets, but a pitch excitation on the PSL PZT from 400-450Hz. The live red trace is about half an hour after tuning the offset, so the offset still seems pretty good, although it's very slightly worse than the very best. The difference is almost imperceptible in the spectrum though, so I'm not worried about it.
The IMC WFS aren't as well centered now as they normally are, so at some point we should go in and center them. Since I have never been on the table where the WFS are, I'm not going to do this right now.
This is the output of the move monitor script. I modified a version for myself slightly such that it is looking at the OSEM witnesses, so these are different numbers than what Sheila has been reporting.
START:
SUS-MC1_M1 -77.7139982167 -1402.28670285
SUS-MC2_M1 621.824242608 -413.66036576
SUS-MC3_M1 -295.471270998 -1542.00494924
SUS-IM1_M1 182.246573766 1119.70220065
SUS-IM2_M1 606.630602164 -207.775211709
SUS-IM3_M1 1934.44031578 150.121067417
SUS-IM4_M1 -3856.74268732 -393.785840775
SUS-PR3_M1 -814.949561082 234.55559486
SUS-PR2_M1 2282.16934135 3242.24543291
SUS-PRM_M1 -1409.3910444 385.240469094
SUS-SR3_M1 -99.7398765539 587.461403381
SUS-SR2_M1 2972.21277609 317.397060269
SUS-SRM_M1 -1729.03418399 1251.99422647
SUS-ITMX_M0 344.119433308 -16.9095533593
SUS-ITMY_M0 996.548899622 83.349298391
SUS-ETMX_M0 -43.4443293476 12.7830931998
SUS-ETMY_M0 -113.192781573 -74.8803343133
SUS-BS_M1 418.802101563 -304.67337983
PIT: SUS-MC1_M1 -84.4985341486
PIT: SUS-MC2_M1 6.57551296647
PIT: SUS-MC3_M1 84.6476471949
PIT: SUS-IM1_M1 0.176299200236
PIT: SUS-IM2_M1 0.159609803854
PIT: SUS-IM3_M1 0.0532221860708
PIT: SUS-IM4_M1 -2.72033242382
PIT: SUS-PR3_M1 -0.482648507537
PIT: SUS-PR2_M1 -4.51434128357
PIT: SUS-PRM_M1 -2.14778485358
PIT: SUS-SR3_M1 -0.307467265582
PIT: SUS-SR2_M1 1.69735082572
PIT: SUS-SRM_M1 -4.77278126446
PIT: SUS-ITMX_M0 0.266663186344
PIT: SUS-ITMY_M0 0.50801149203
PIT: SUS-ETMX_M0 1.04999779019
PIT: SUS-ETMY_M0 0.445617164846
PIT: SUS-BS_M1 1.27672698516
YAW: SUS-MC1_M1 0.762530780343
YAW: SUS-MC2_M1 0.684821504178
YAW: SUS-MC3_M1 -1.60849376182
YAW: SUS-IM1_M1 -0.0294054532108
YAW: SUS-IM2_M1 0.322776681474
YAW: SUS-IM3_M1 0.103454831846
YAW: SUS-IM4_M1 1.48293048173
YAW: SUS-PR3_M1 -0.150923145111
YAW: SUS-PR2_M1 -0.0132833502485
YAW: SUS-PRM_M1 0.341160068319
YAW: SUS-SR3_M1 0.243808779206
YAW: SUS-SR2_M1 -1.30058543927
YAW: SUS-SRM_M1 0.199403791284
YAW: SUS-ITMX_M0 -0.139022372494
YAW: SUS-ITMY_M0 0.105286976283
YAW: SUS-ETMX_M0 0.201915126583
YAW: SUS-ETMY_M0 0.160323724745
YAW: SUS-BS_M1 -0.0897574699579