peter.king@LIGO.ORG - posted 12:53, Monday 24 October 2016 (30801)
pre-modecleaner measurements
Whilst prepping for installation of the Picomotor equipped mirror mounts, we took the opportunity to measure
the powers in/out of the pre-modecleaner. As with the previous measurement, both the input and output windows
are on. The ISS was off with the offset slider at 20. The 300W water cooled power meter was used for the
measurements using a 10s average.
Pincident = 141.5W
Ptrans = 105.8
Preflected = 31.0
transmission = 105.8 / 141.5 * 100
= (74.8 +/- 0.1) %
visibility = (1 - 31.0 / 141.5) * 100
= (78.1 +/- 0.2) %
Which would imply losses of (3.3 +/- 0.3) % including the input and output windows.
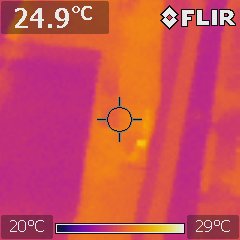
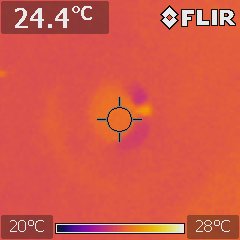
Also attached are two thermal images; one of the pre-modecleaner PZT and the other of the output window.
The PZT did not appear to be any hotter than the body of the pre-modecleaner. Ambient room temperature was
nominally 23 degC.
Jason/Peter
Images attached to this report

