Our noise at 35W is now similar to the noise at 25Watts, and the extra power might be giving us some range.
ILS gain helped:
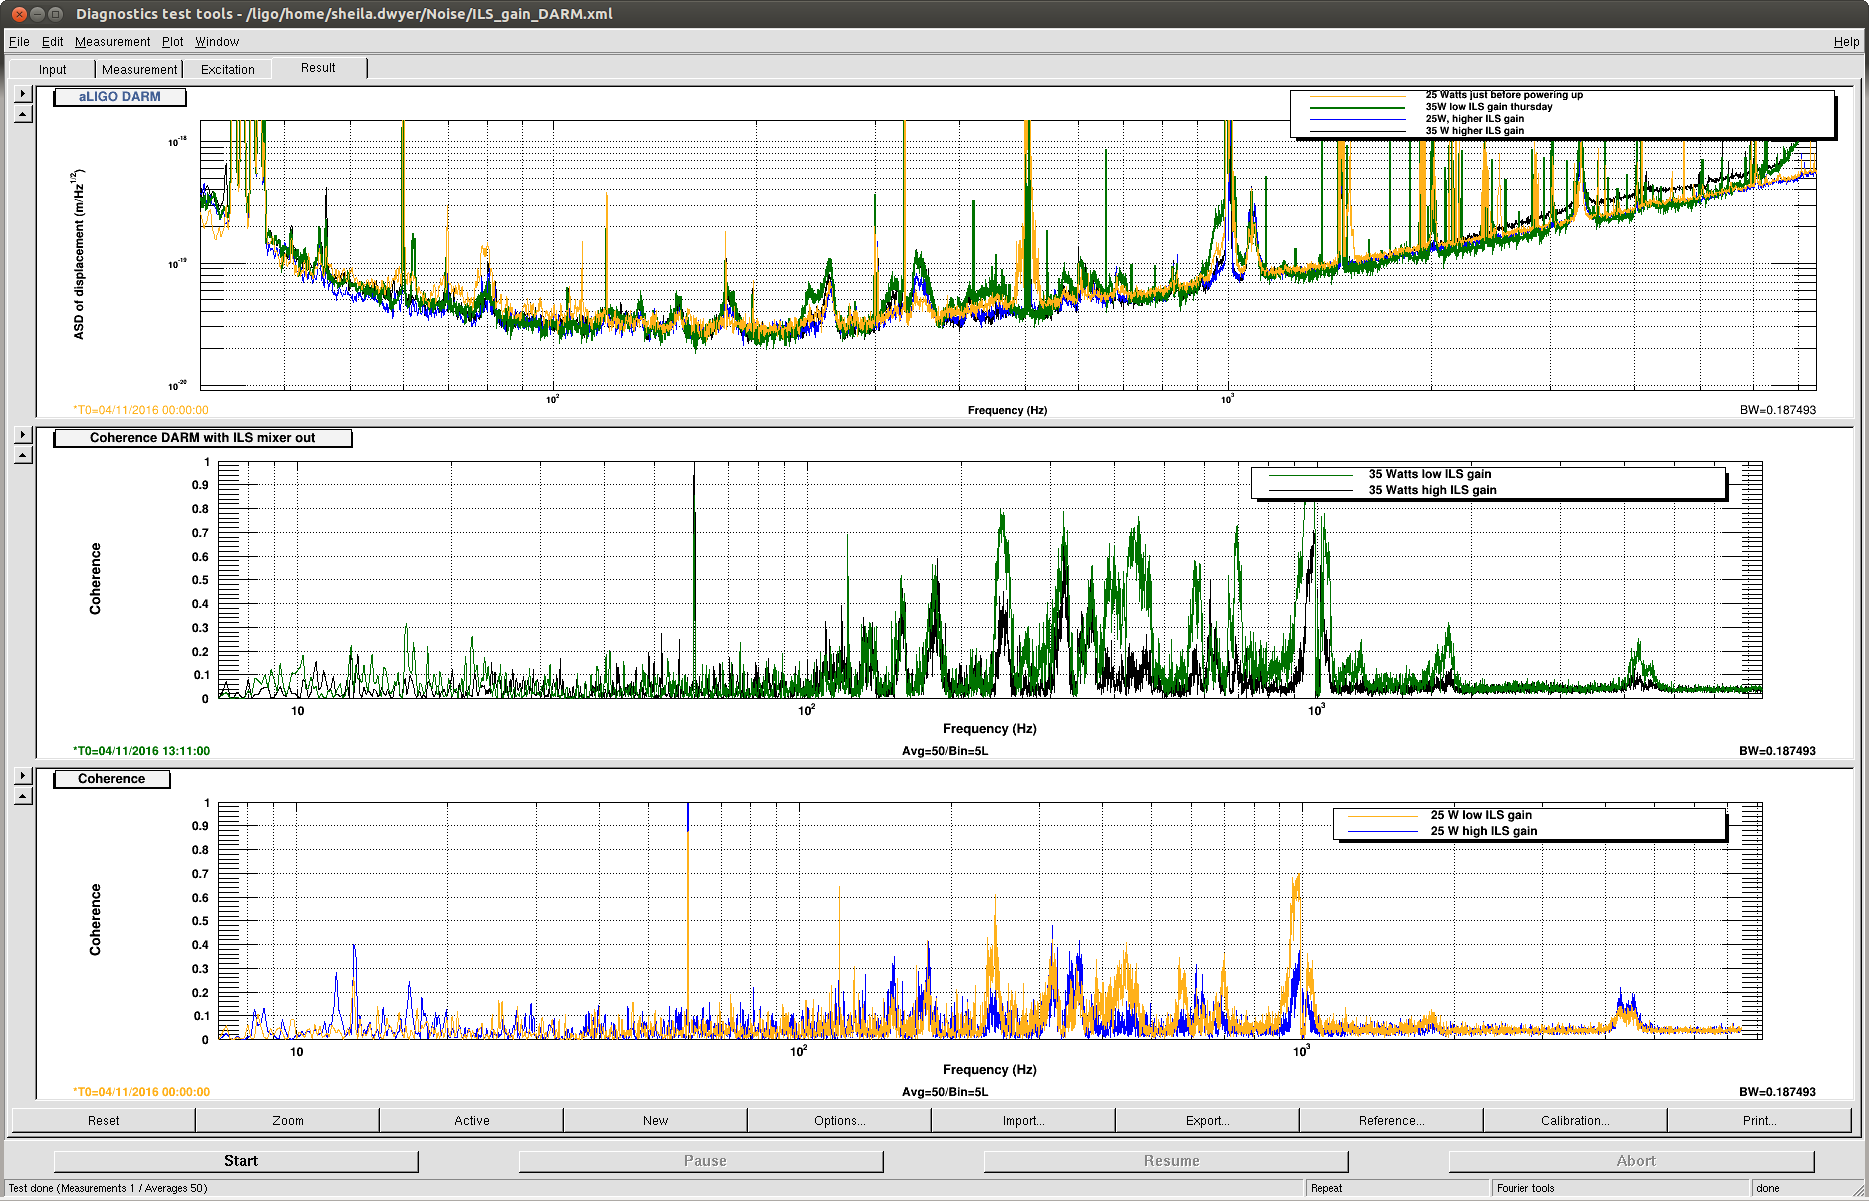
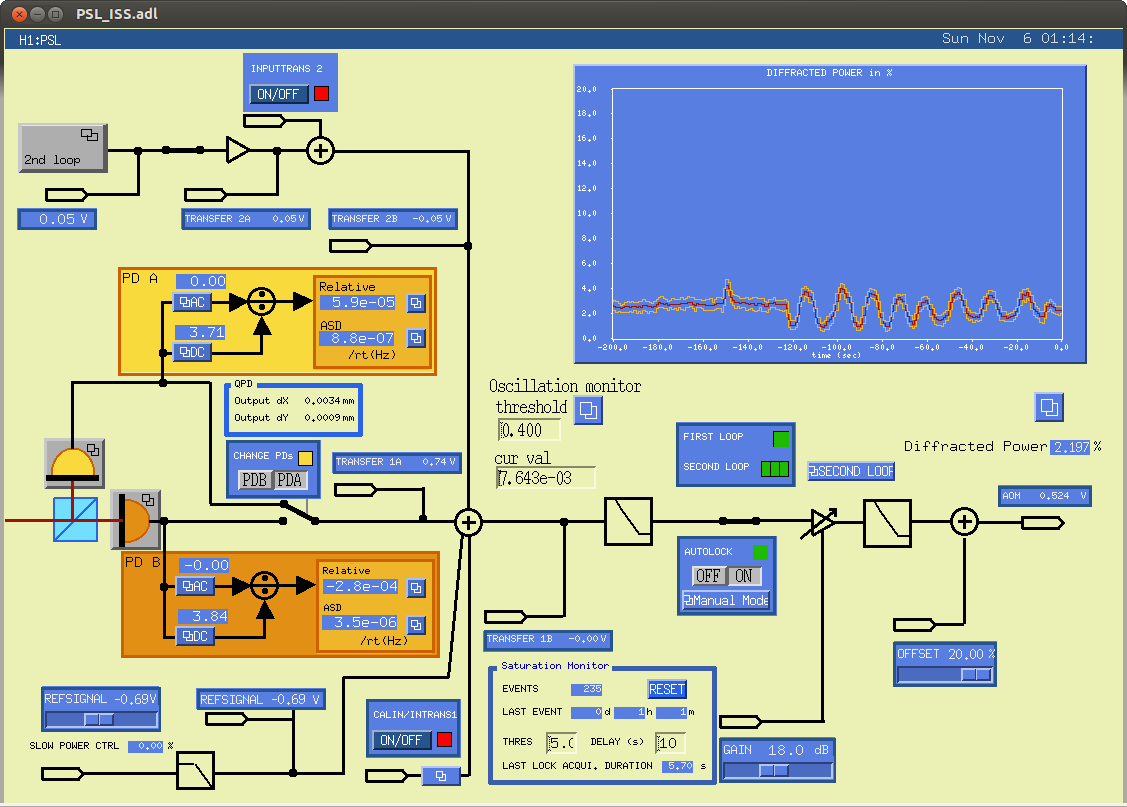
The first screenshot shows that the ILS gain has a more dramatic impact at 35 Watts than at 25W (31223). If it is possible to boost the gain in this servo more at frequencies below 1kHz, this will help our noise at 35W and higher.
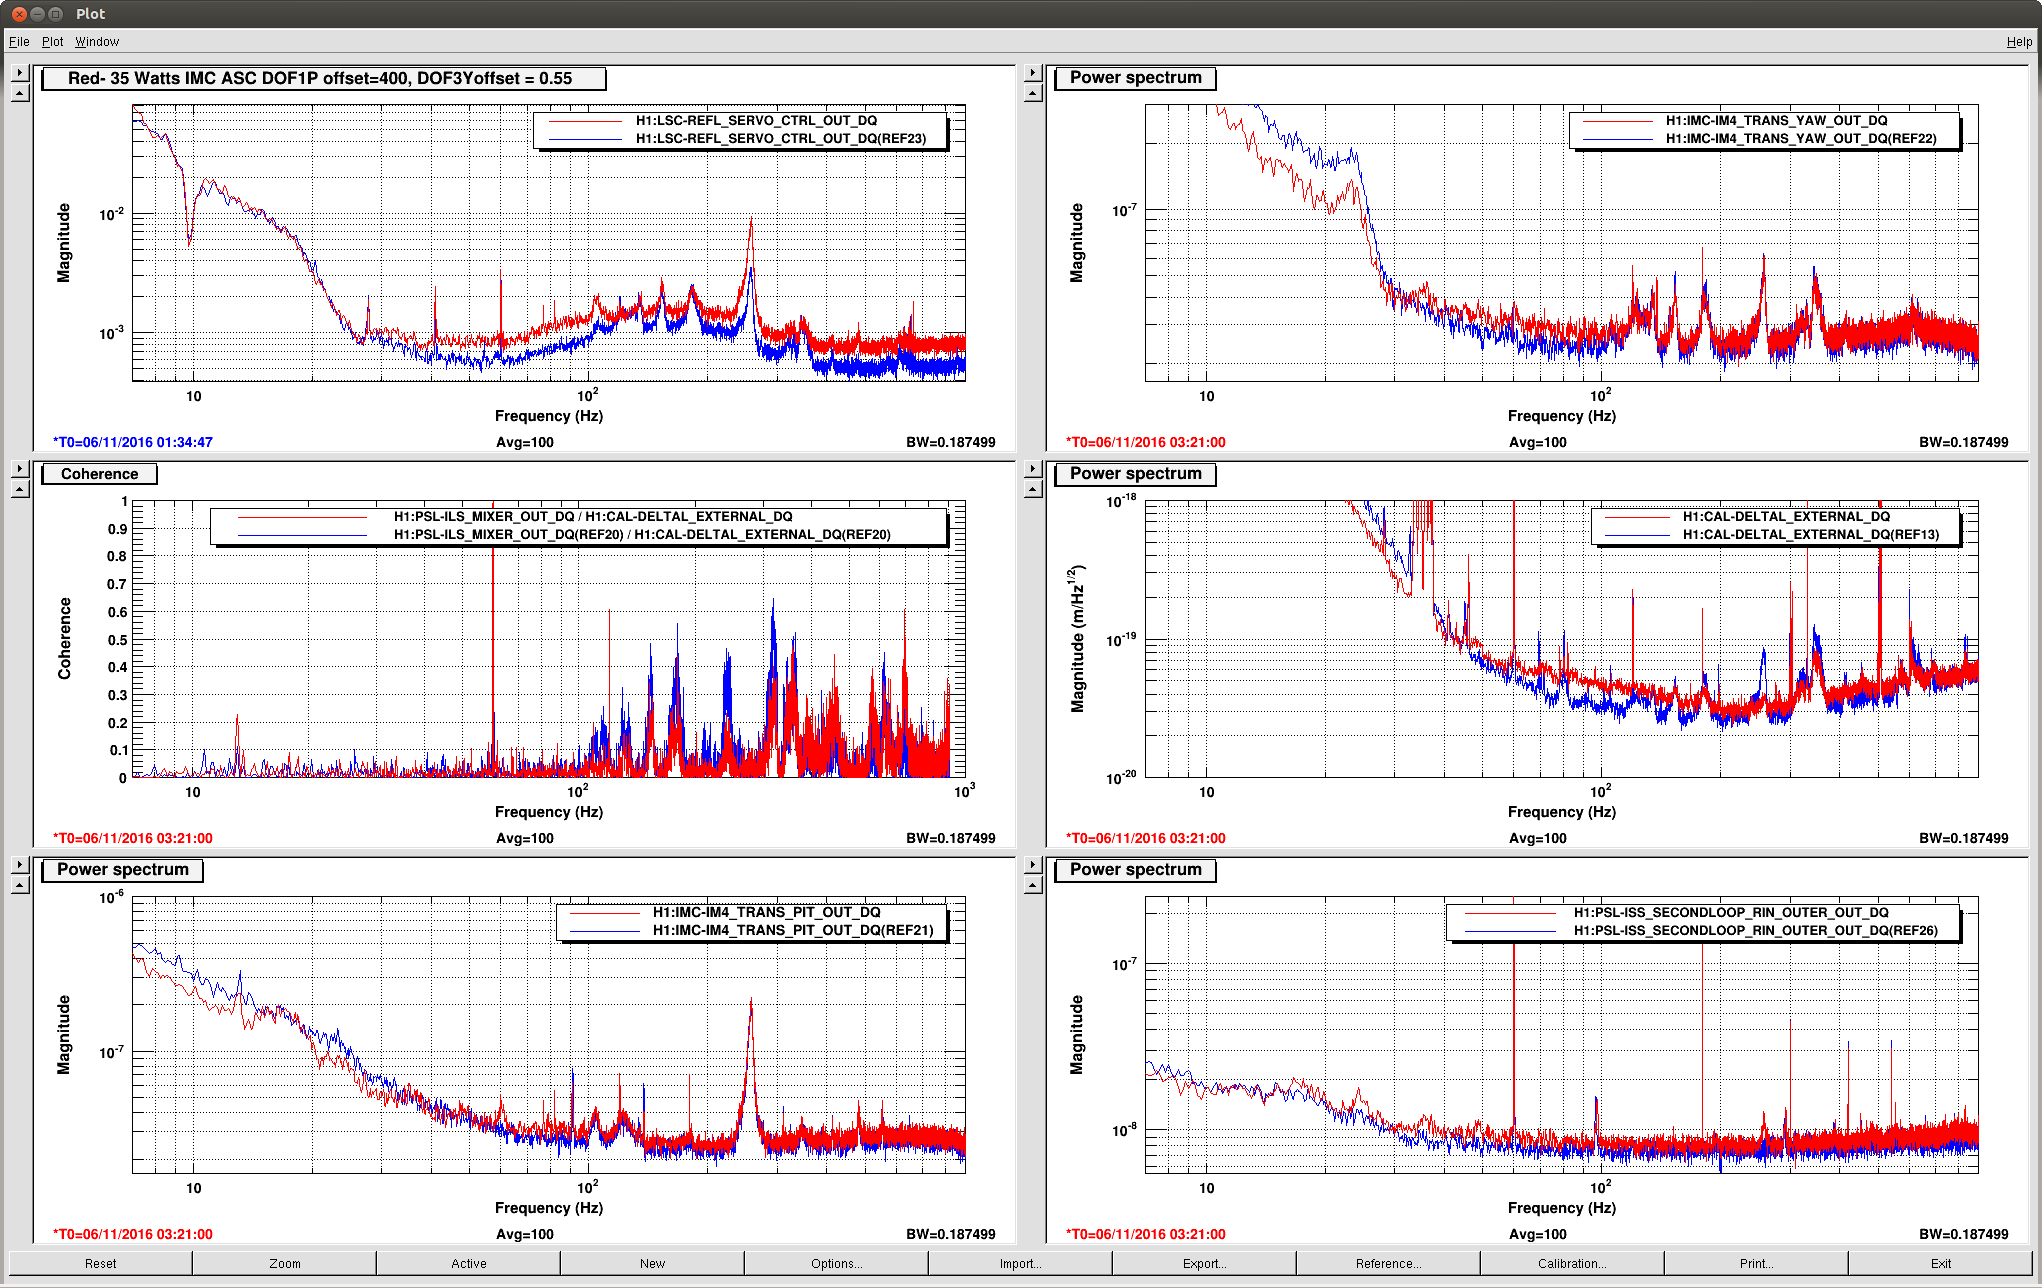
IMC WFS offsets
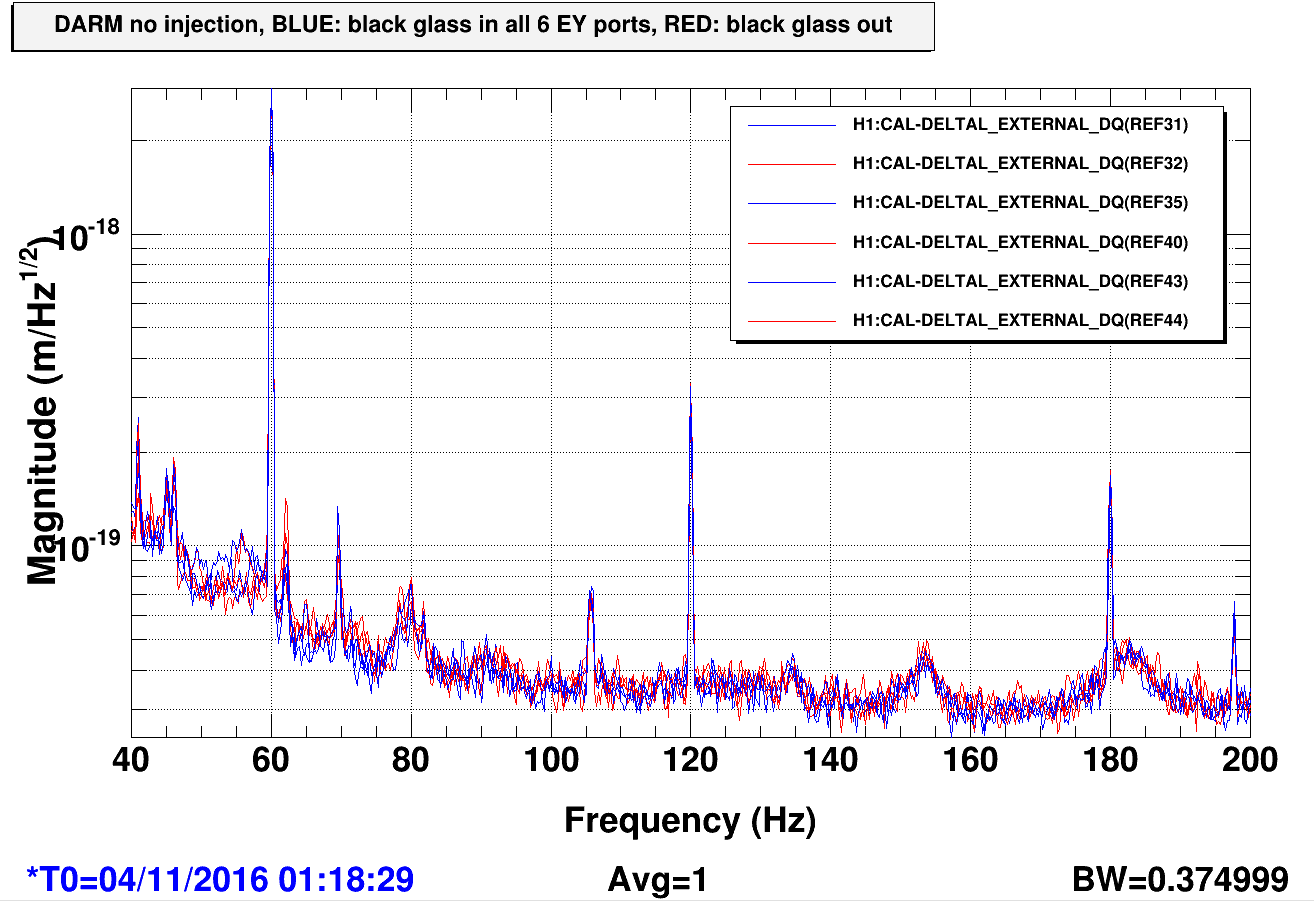
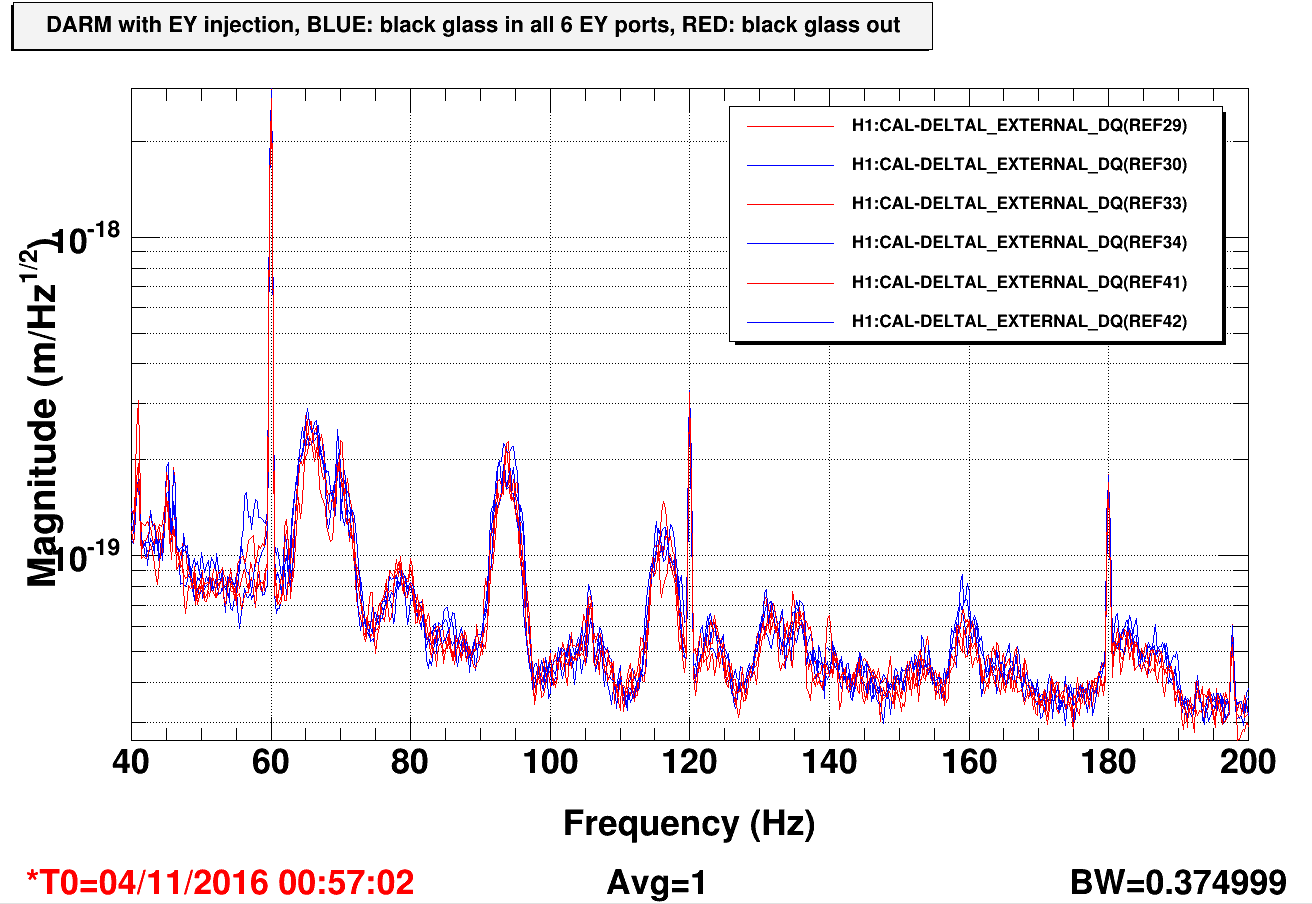
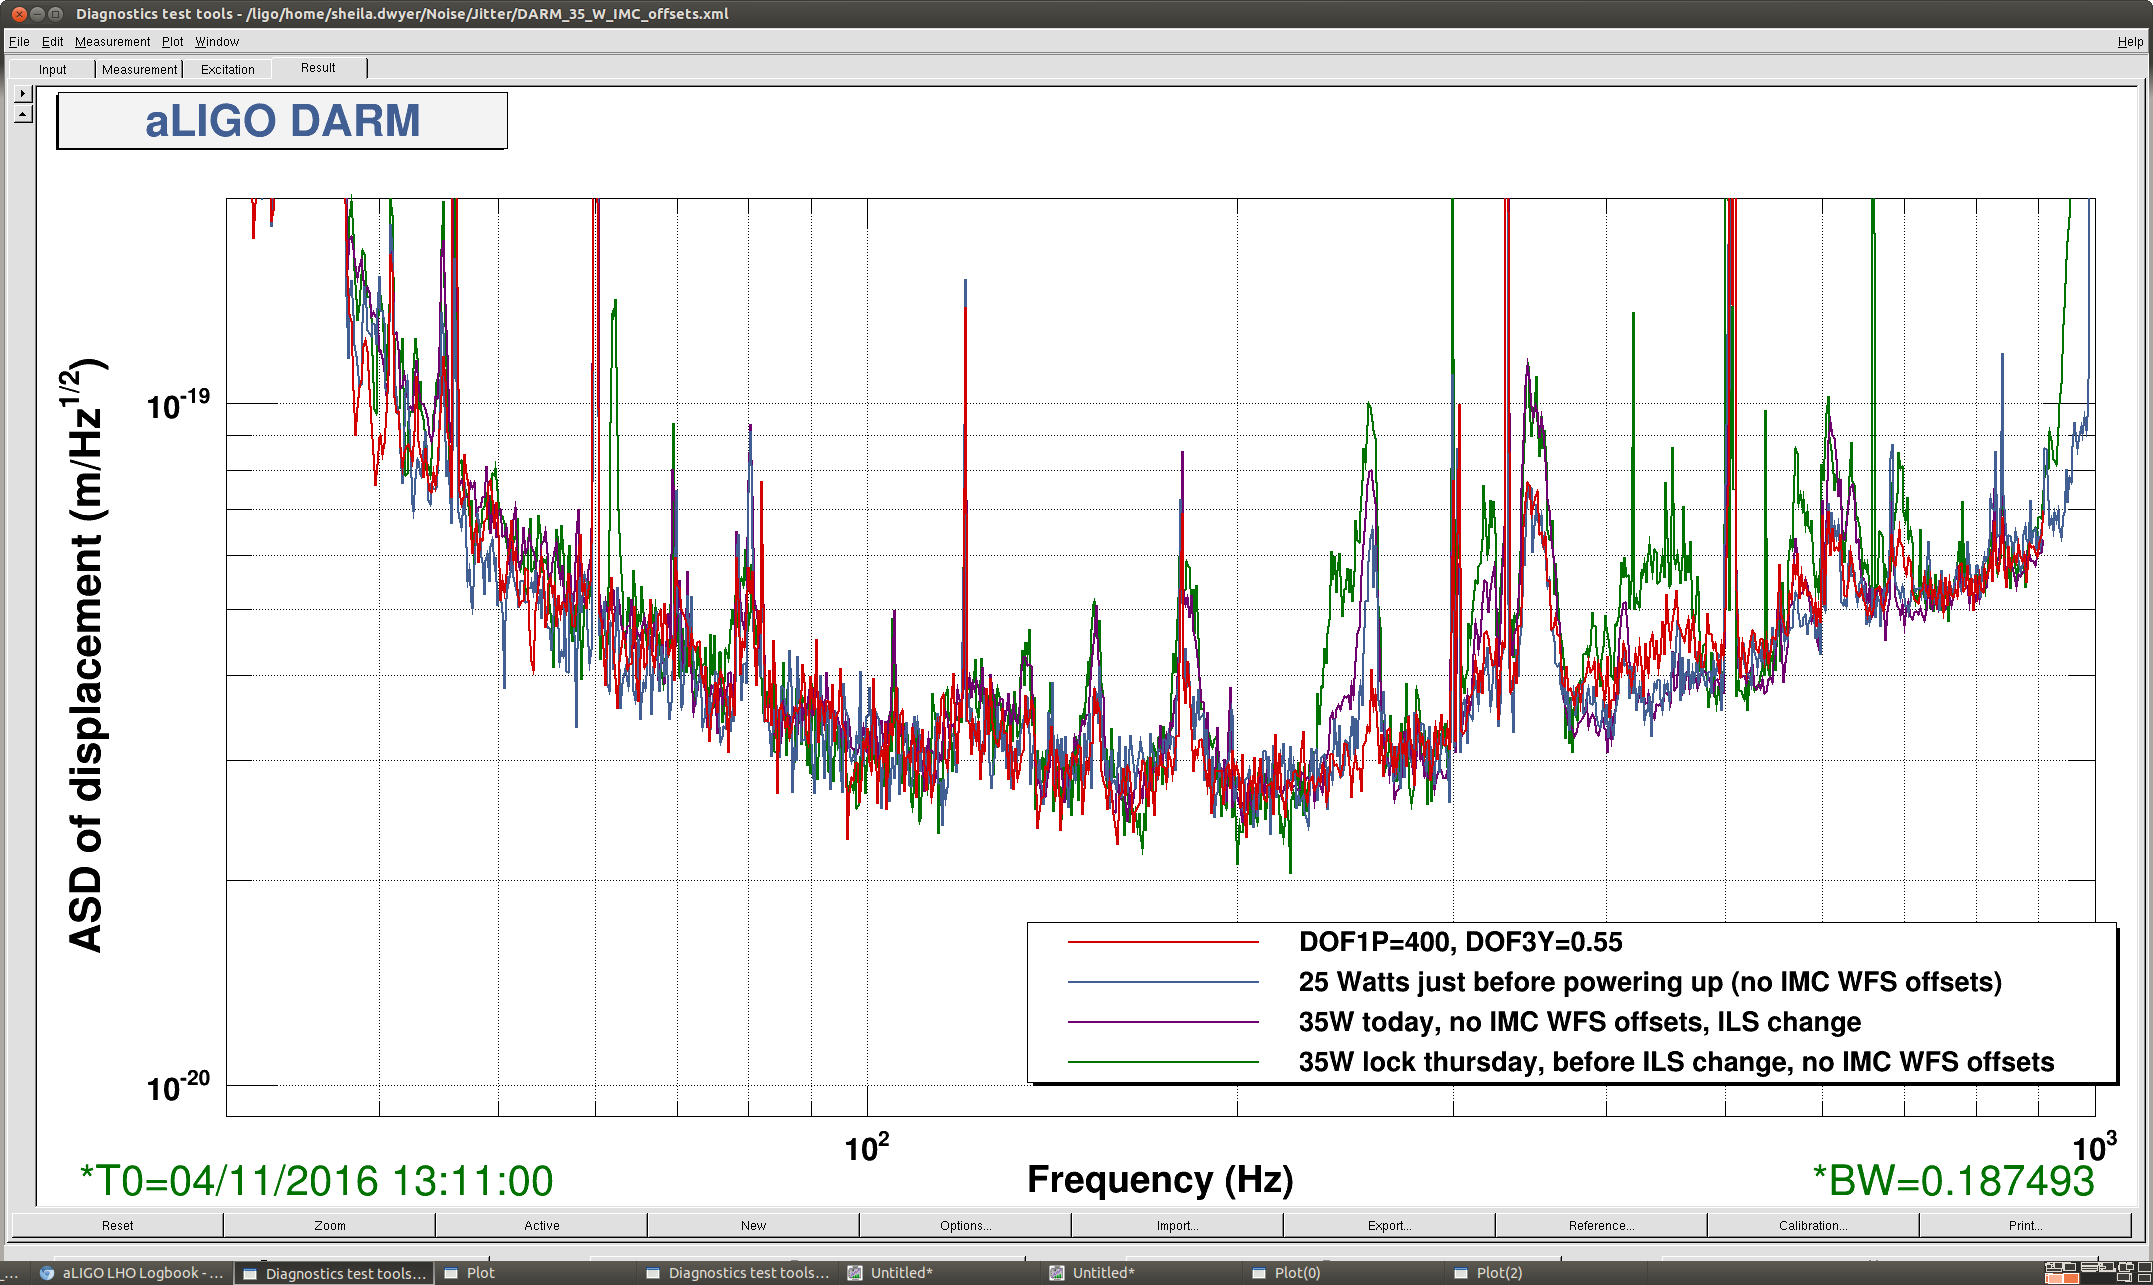
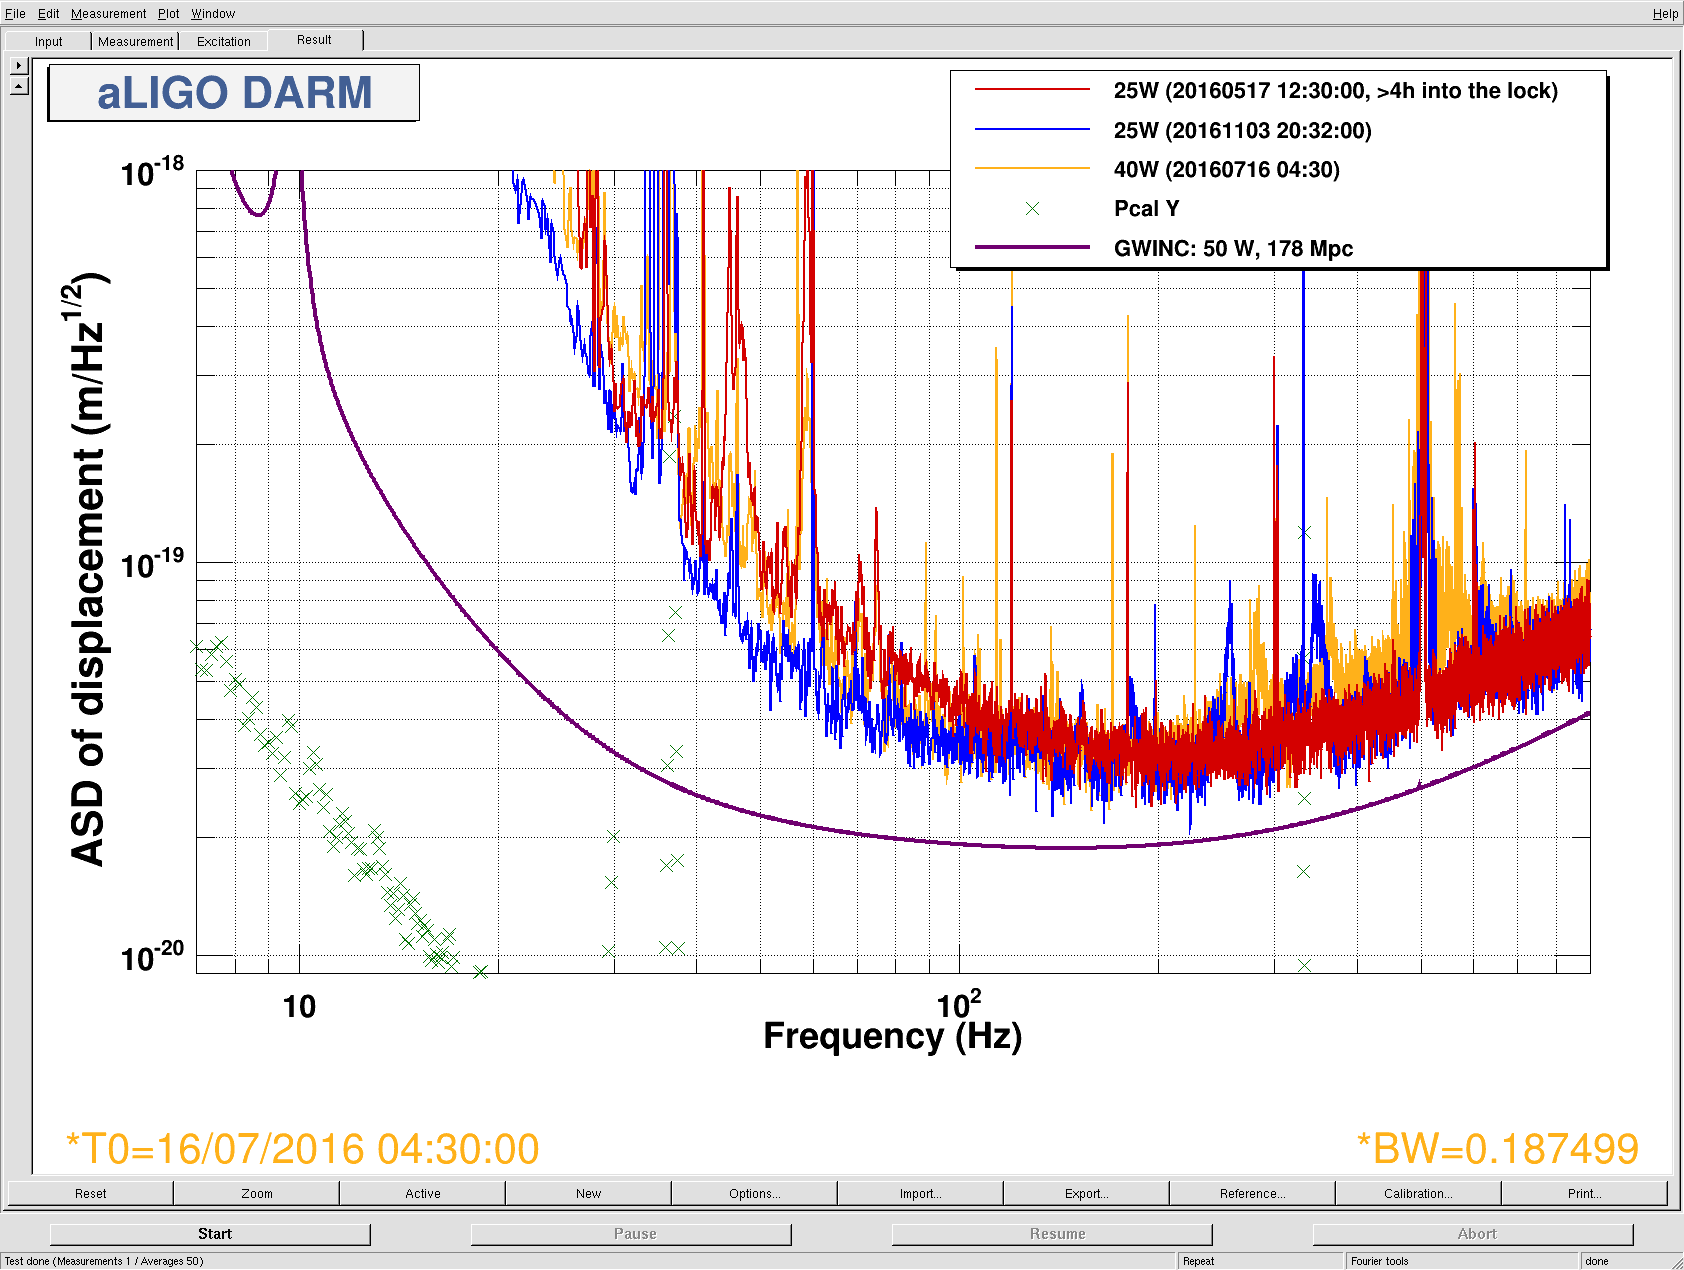
The second screenshot shows a comparison of several spectra, the main point is to show that we can power up to 35W without making the accoustic peaks worse (and with some of them actually better), with the combination of more ILS gain and IMC WFS offsets. I started with the offsets that Jenne used last night 31221 I think that for PIT, nothing in DOF2 is fine, and I think that 400 in DOF1 is a little better. For yaw, I didn't see much impact from offsets in DOF1 oe 2, but there might have been a small improvement using positive offsets (I ended up at 0.55, but could have gone further). I moving IM3 P (away from its rail) to mimic the move that the IMC WFS made on IM4 trans, but this had no impact on the IMC PZT jitter coupling to DARM.
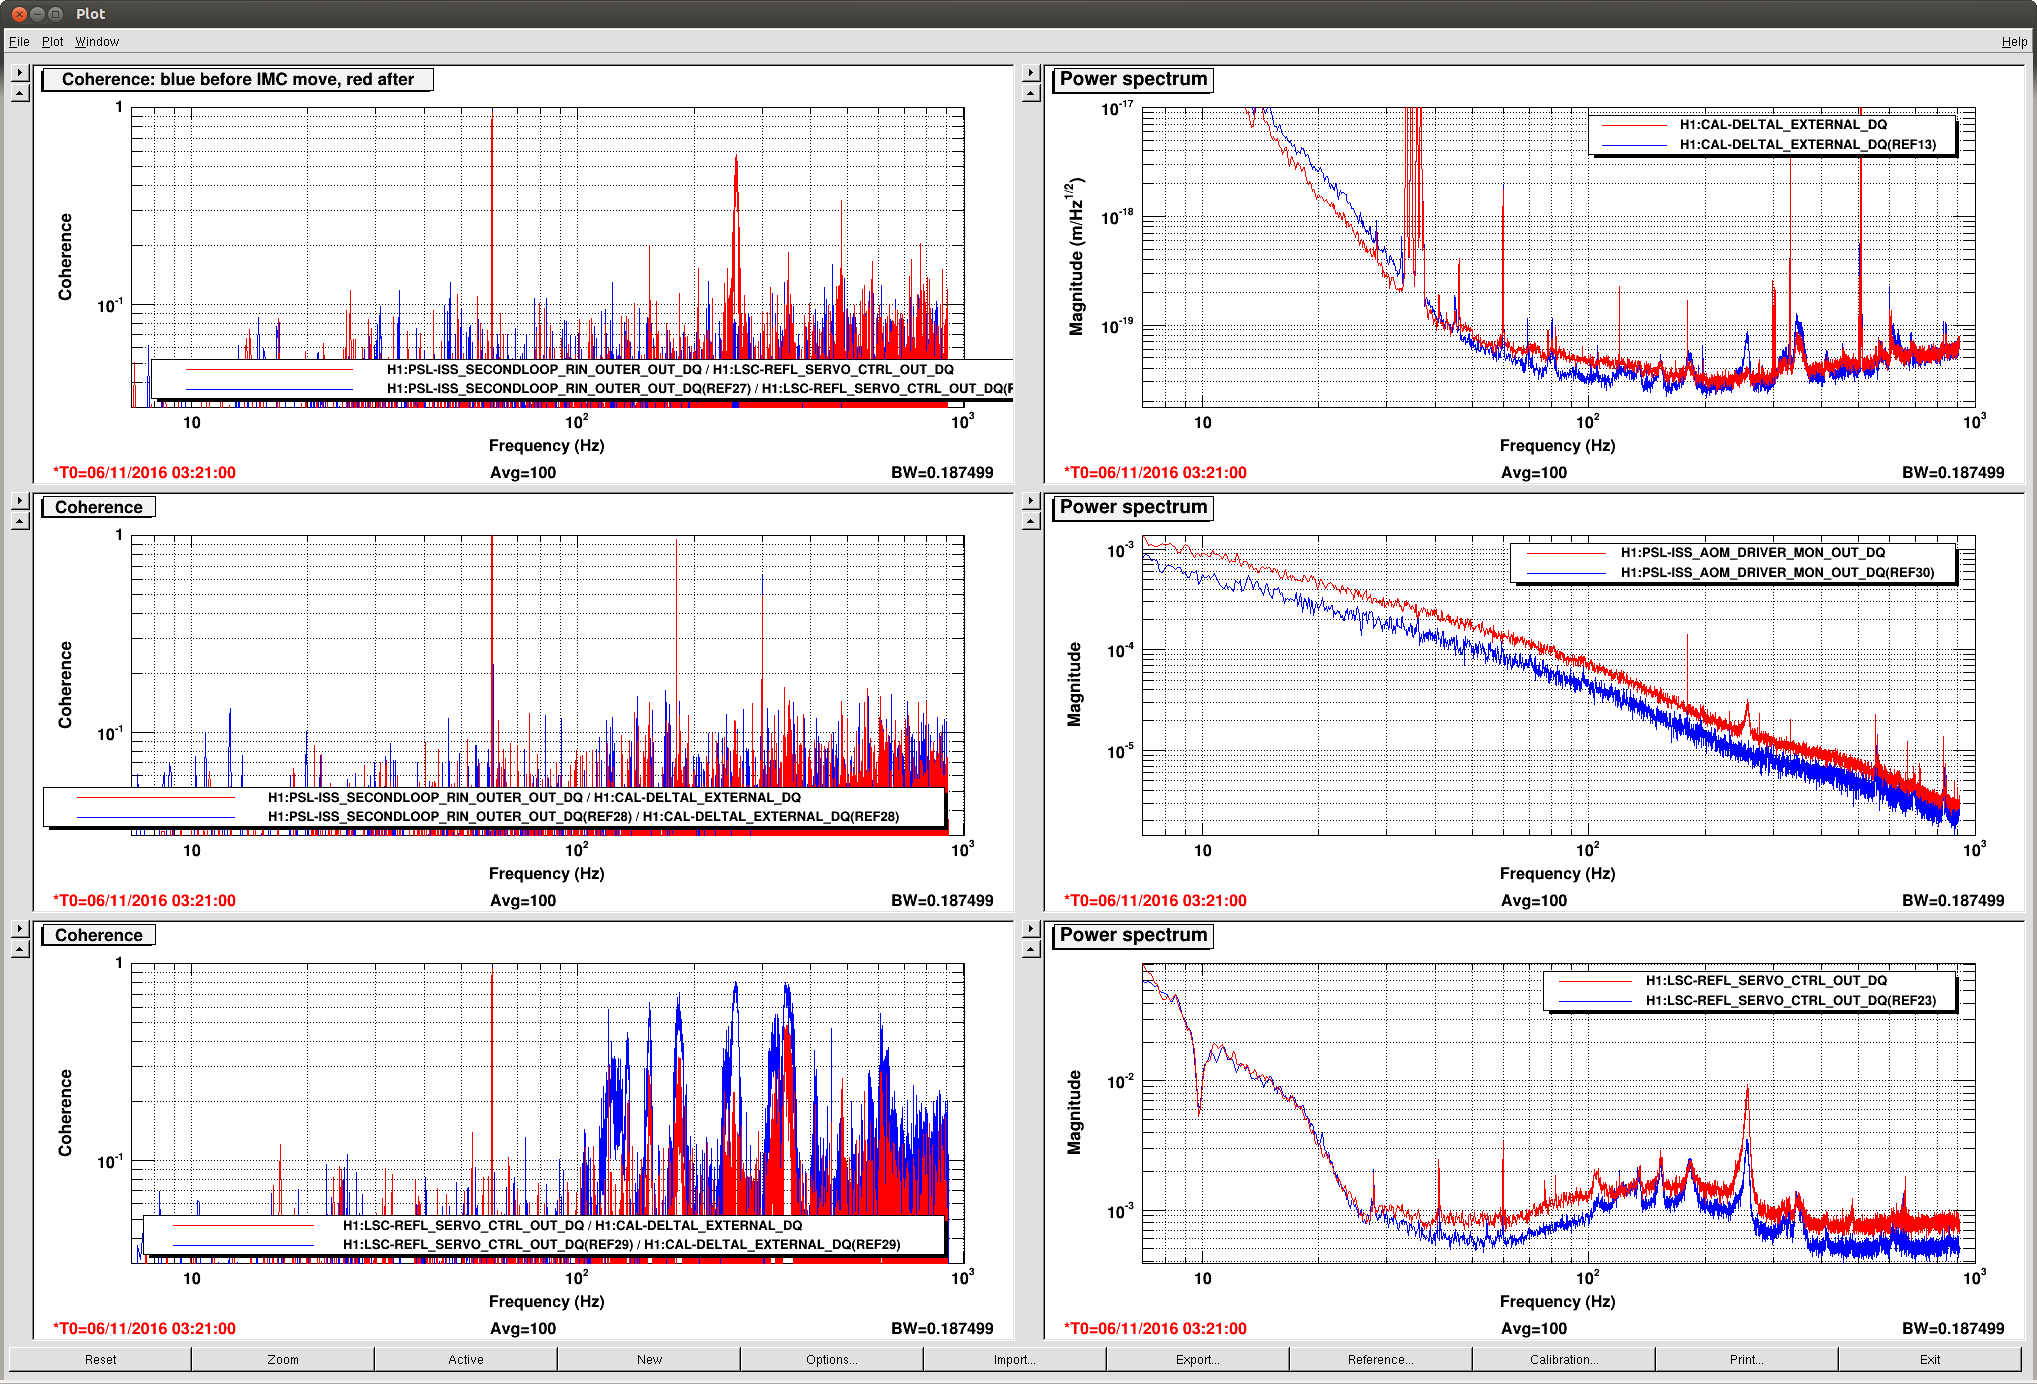
The third screenshot shows comparisons of spectra and coherences before and after the IMC WFS moves. The low frequency improvemenmt in DARM is just from running a2l. The IMC shift increased both the intensity noise and the frequency noise, suggesting that what we are doing with these offsets is creating intensity noise in just the right way that it cancels some other noise, like frequency noise, in DARM. You can see that the coherence with the ILS is reduced by the IMC WFS move. In the 4th screenshot you can see that the move decreases the coherence of REFL control with DARM, but at the 260Hz Refl control becomes coherent with the intensity noise. We have convinced ourselves that both frequency noise (31176) and intensity noise (31186) are well below DARM, but we might need to think a bit harder about that.
For anyone who is curious to look at this data: the after the IMC move time was 6/11/2016 03:21:00 UTC, you can get 30 averages at 0.1Hz BW without seeing noise from Robert's injection which is visible in DARM in the 4th screenshot, the before time is 01:34:47, and you can take 100 averages at that time.
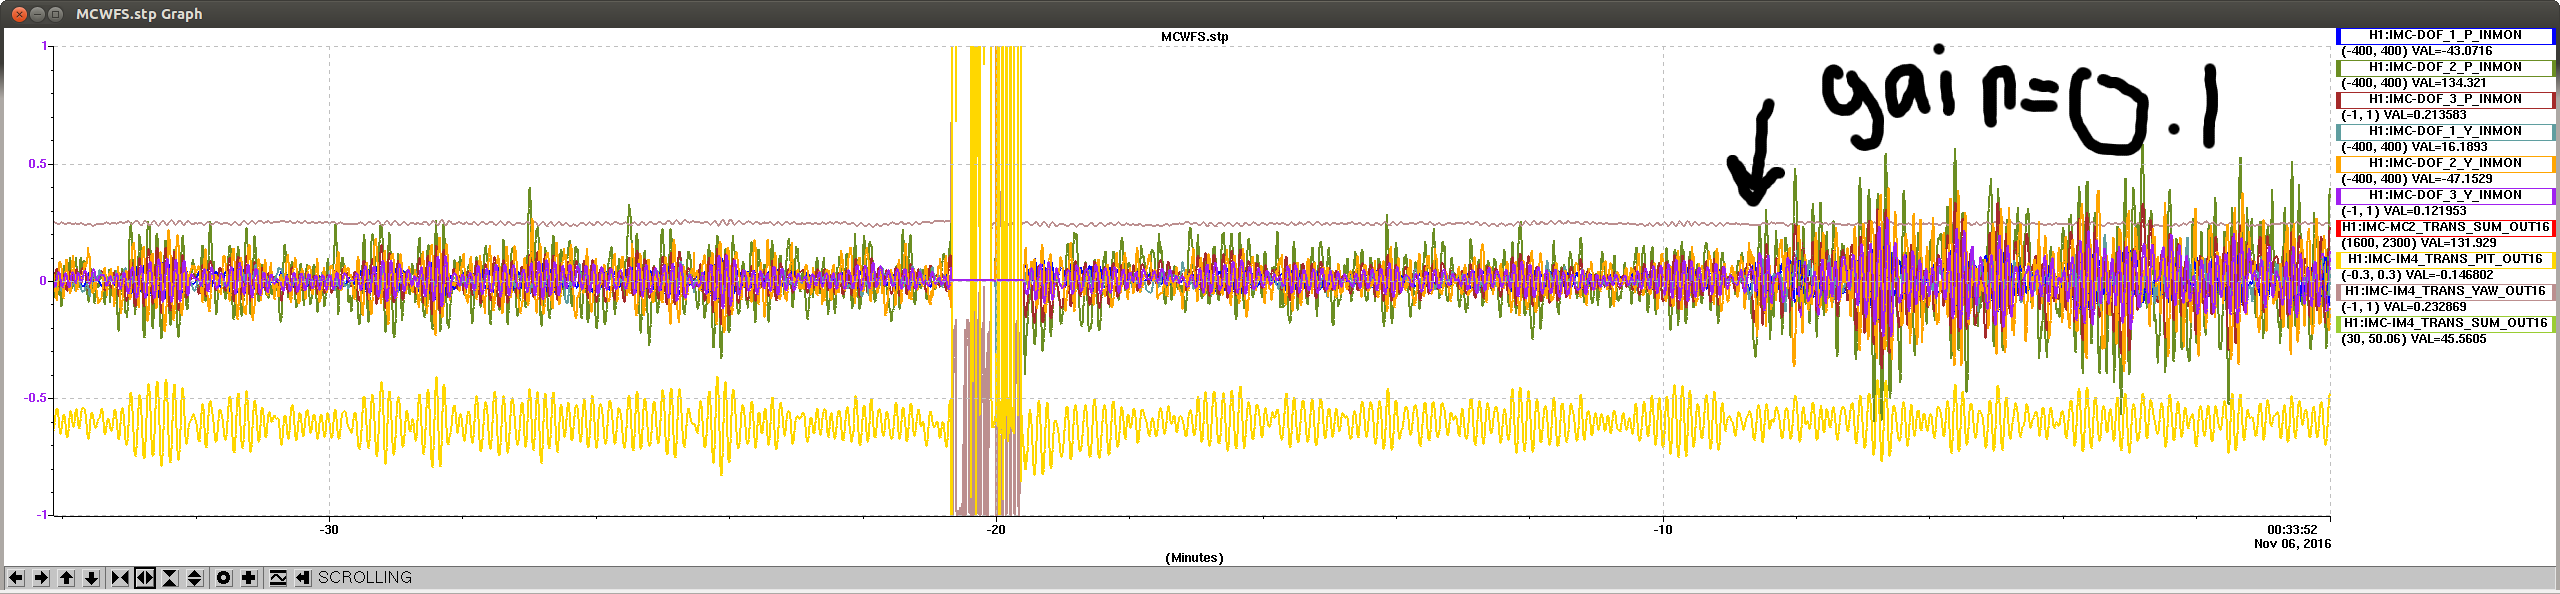
IMC WFS oscillation:
The IMC WFS have been osciallting at the microseism, I think this was contributing to the difficulty transitioning to POP X WFS. I turned the overall gain of the IMC WFS down from 0.1 to 0.04, you can see the impact in the 5th attached screenshot. This gain is before the offsets we have been adjusting, so the DOF1P offset which was originally 400 should now be 160 with the new gain ect.
Other things done today:
-
I set the CO2X power to 0.3W in the guardian, because that seems better for 35W and Kiwamu had said that it was also better for 25W.
-
We commented out the POP beam diverter, so the noise from ISCT1 is visible in DARM. I was hoping to try looking at the REFL WFS signals again to see if we can go back to them, but didn't get a chance.
-
We have just been using 25W HARD loops at 35Watts, and leaving SRM uncontrolled. The hard loops seem fine, so I commented out what I put into the guardian for 35W hard loops on thursday night.
-
The guardian should be set up to get us to low noise at 35 Watts, the only thing we need to do by hand is engage IMC WFS DOF1P offset.
-
Travis and TJ have been adjusting phases for PIs more frequently than in the past, but they have it well under control.
-
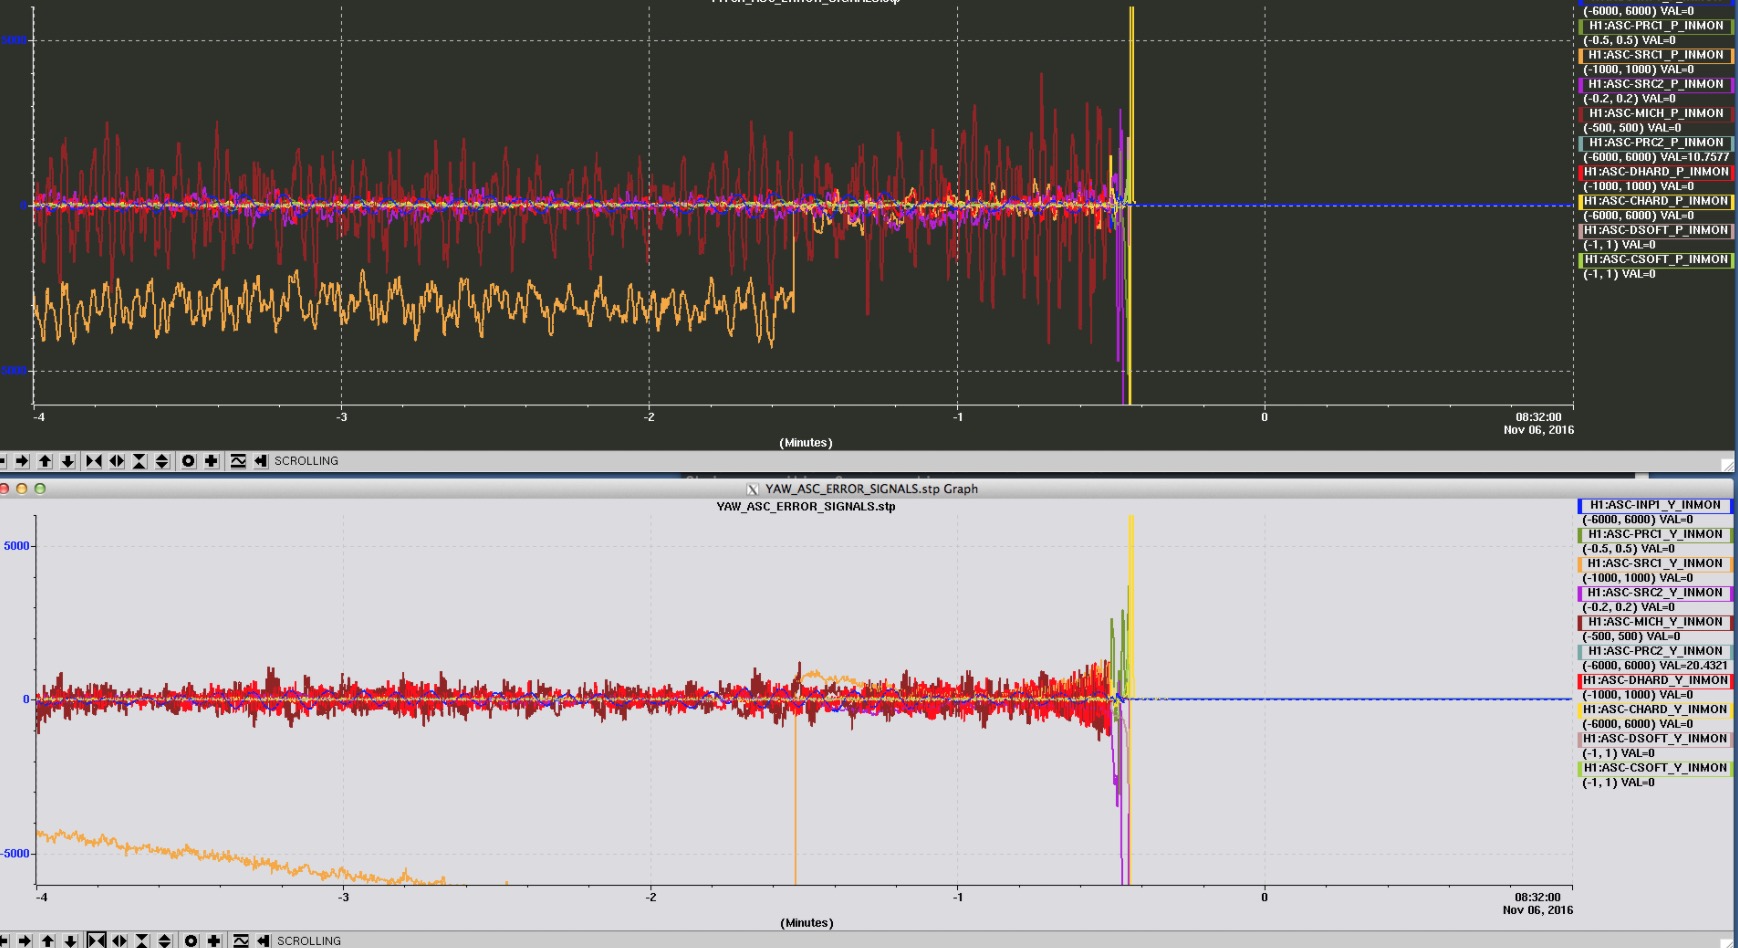
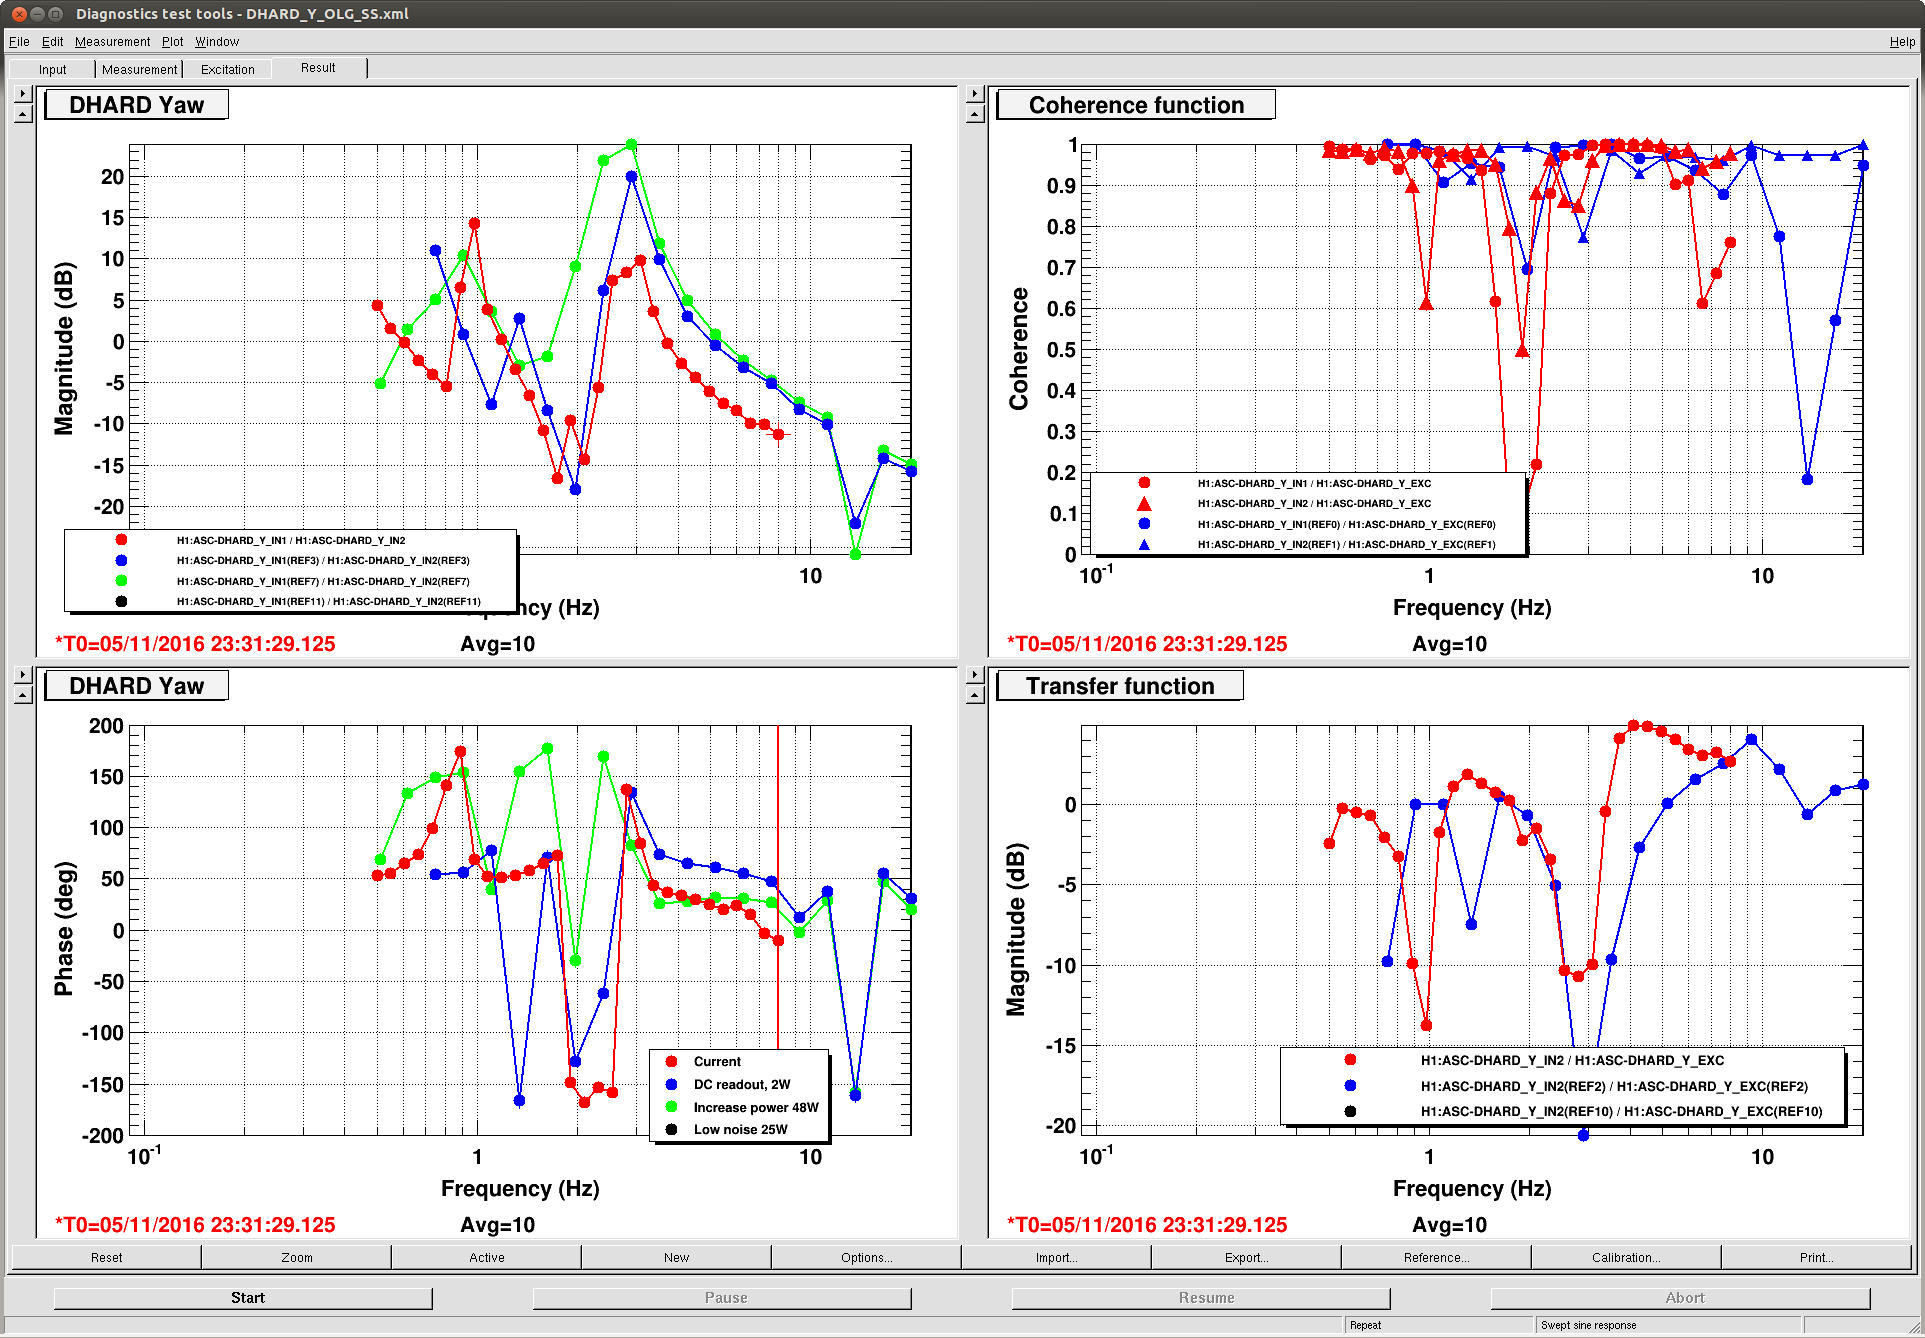
I got a measurement of DHARDY at 25Watts. (last screenshot)
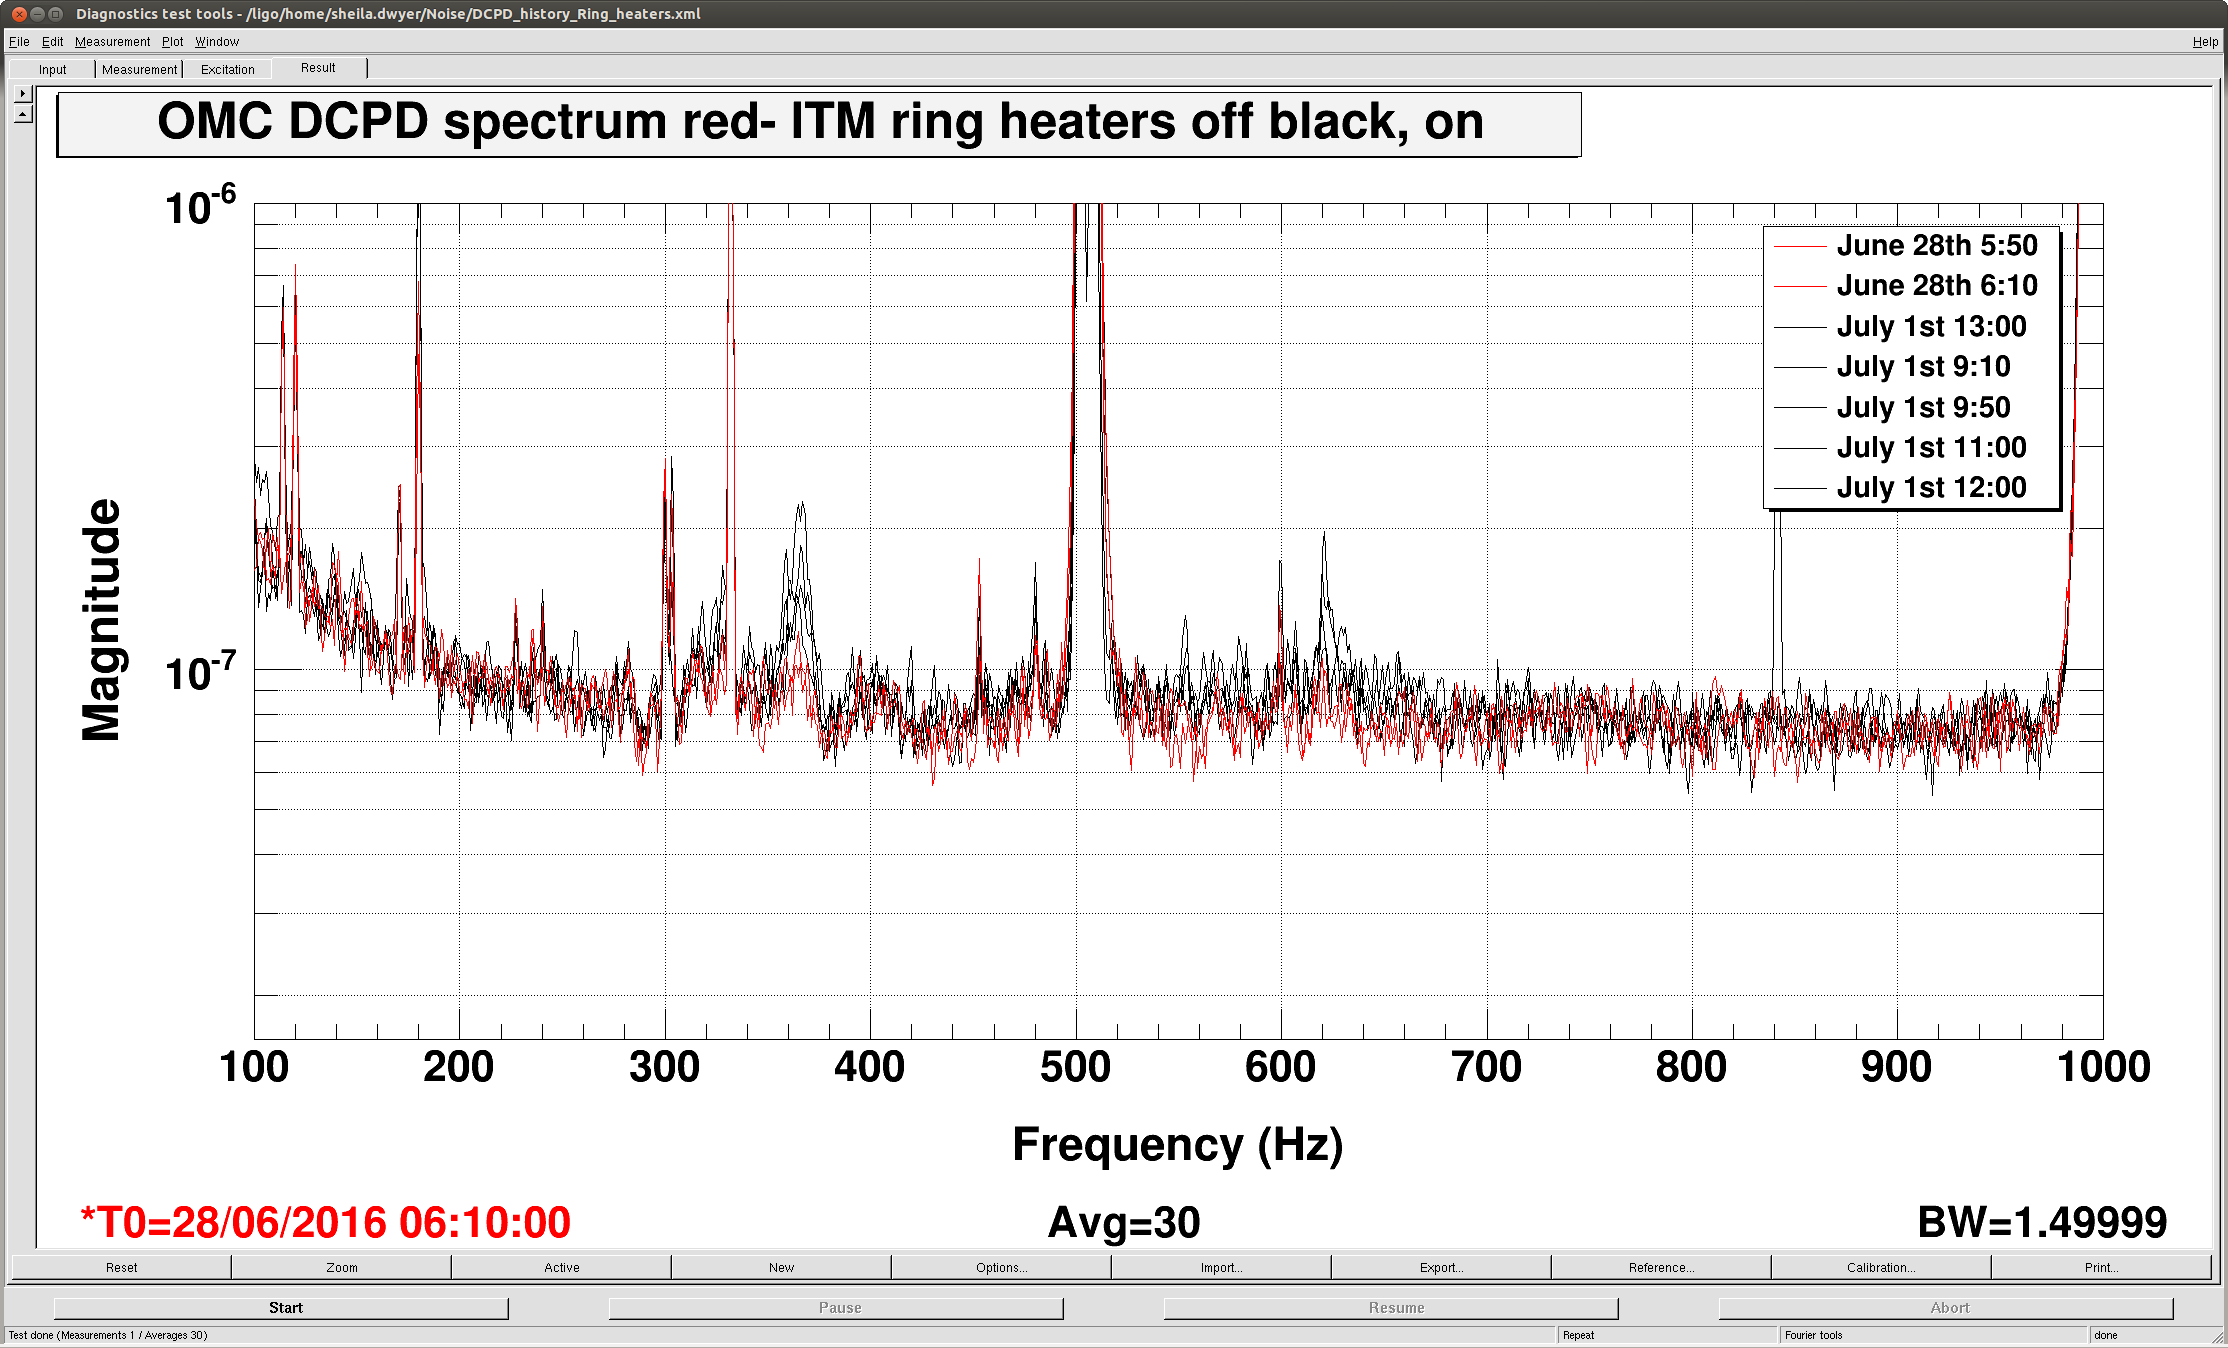
I asked TJ to get another lock in this configuration if he can, then do the ring heater change I promised Stefan I would do.