edmond.merilh@LIGO.ORG - posted 02:47, Thursday 13 October 2016 (30489)
Intent Bit Set
09:29:10 Intent Bit set to Observe
09:29:10 Intent Bit set to Observe
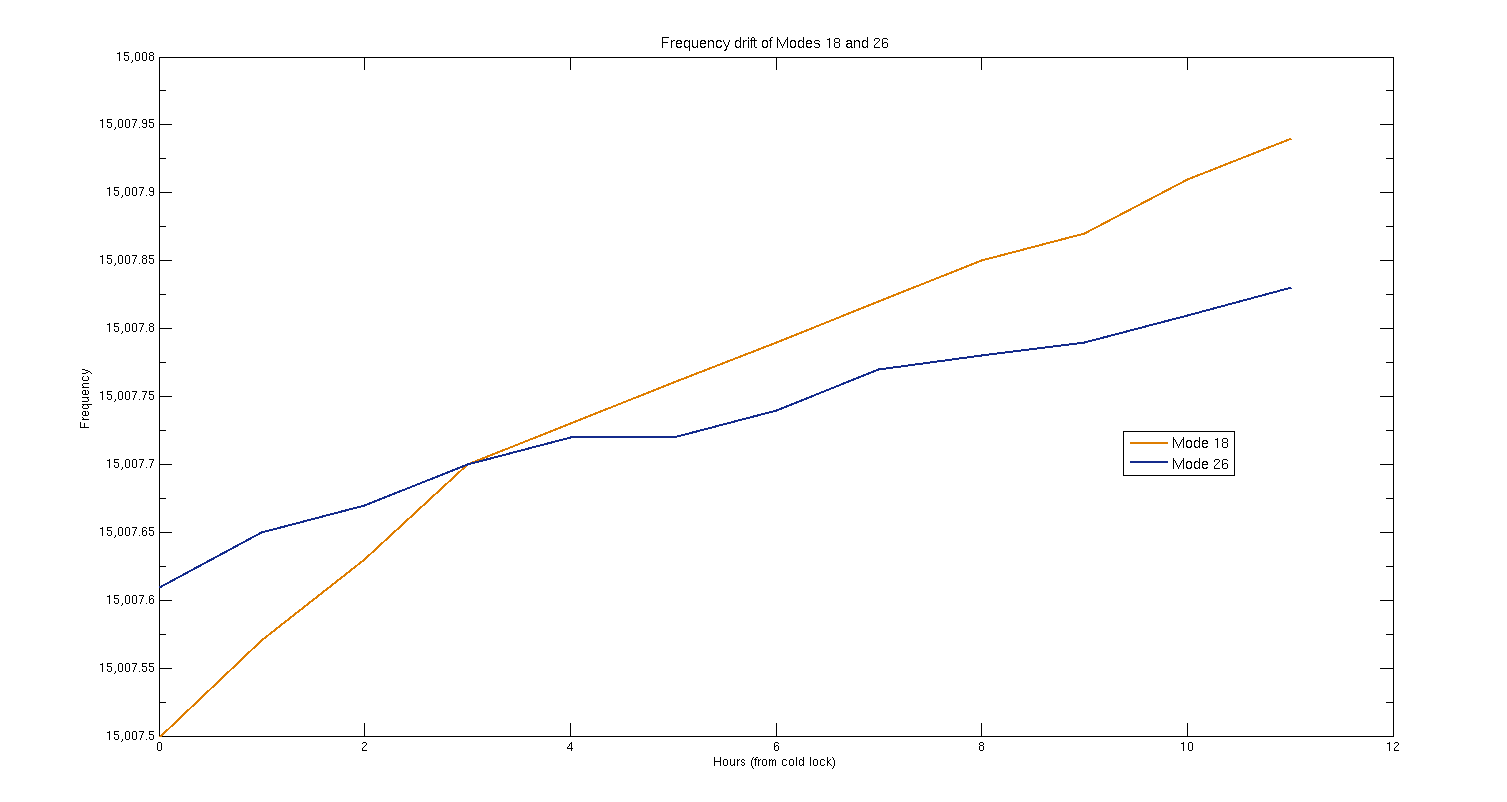
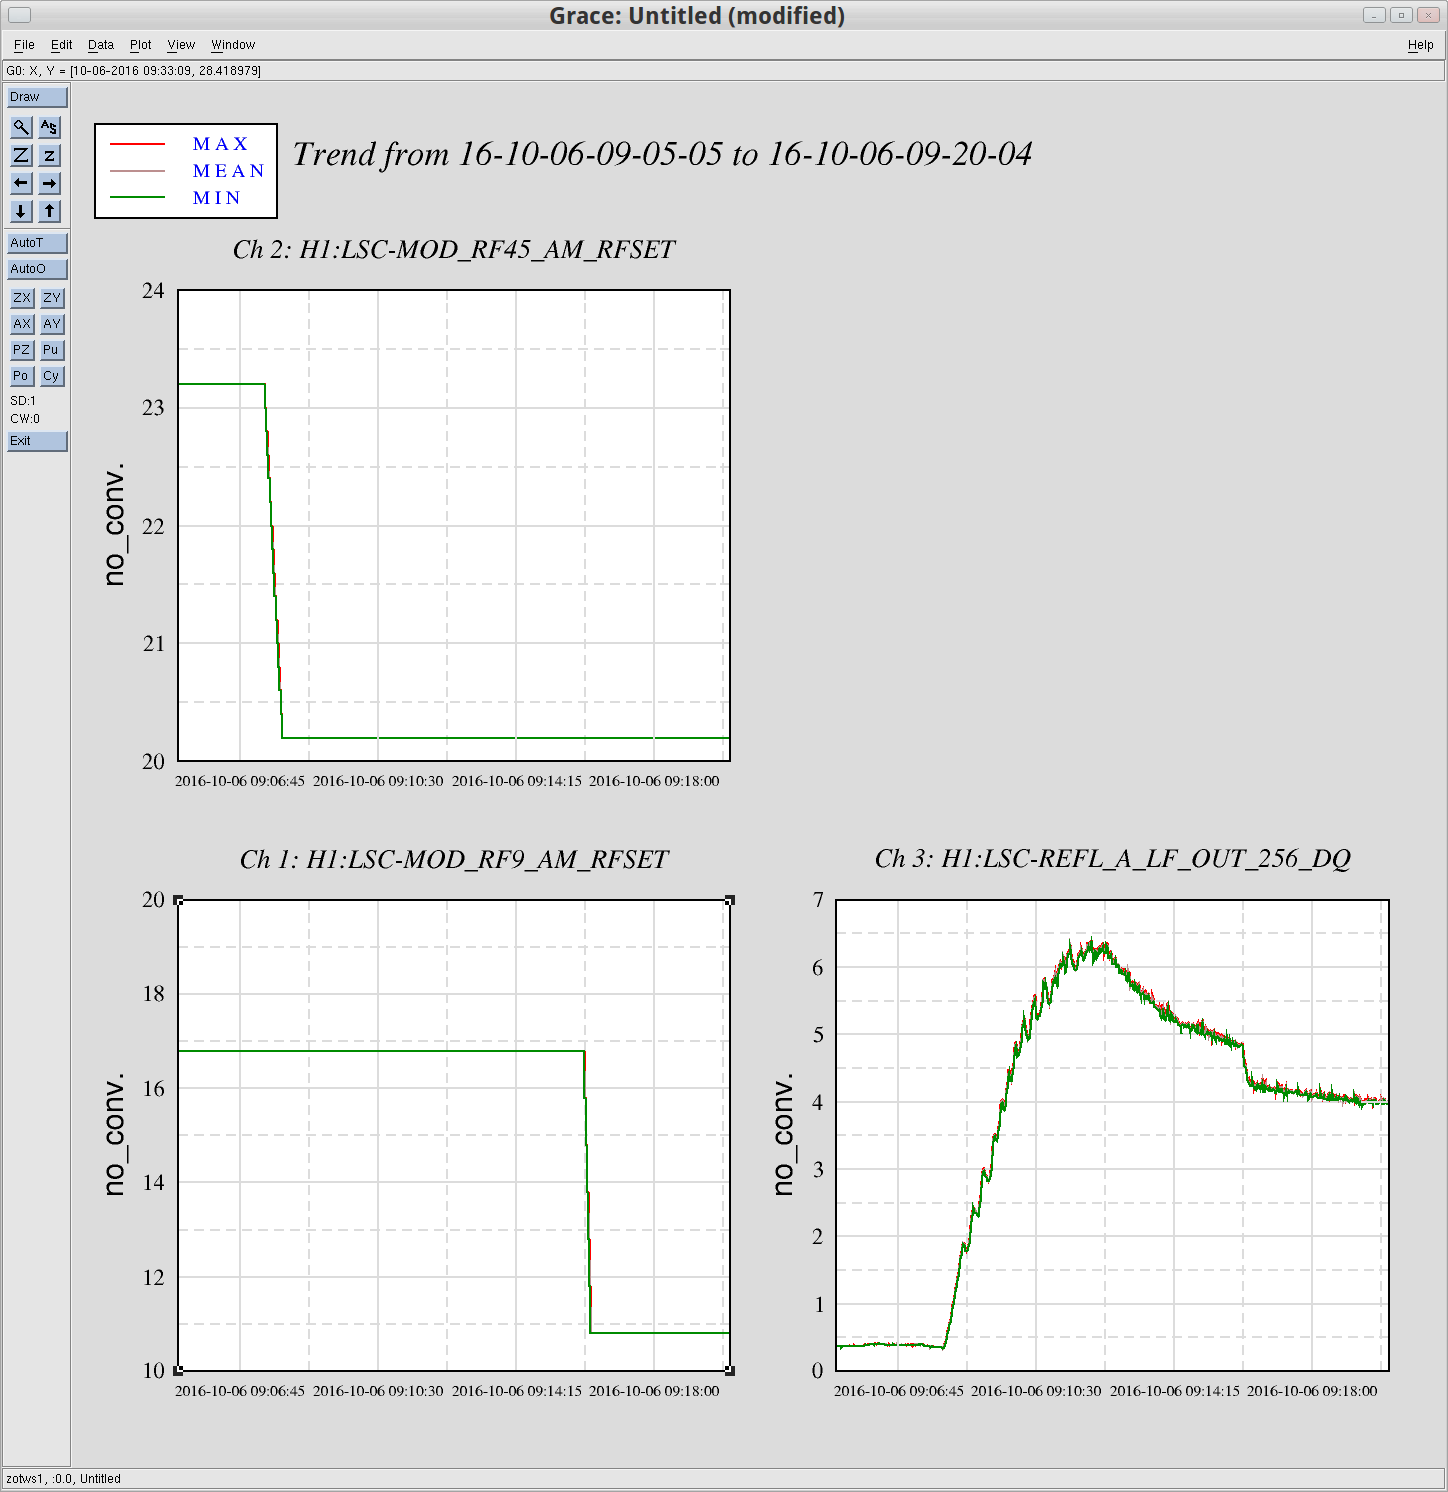
First known case of crossing PI modes: over the course of a few hours, ETMX Mode18 crosses over the more stationary ETMY Mode26. Last night's and today's trouble with Mode26 were partially a result of not knowing this crossover was happening.
Both modes are differential drumhead. Crossover happens a few hours in from cold lock: ETMY Mode26 (tallest peak shown below) begins around 15007.6 Hz and slowly drifts upward with heating over about 5 hours. ETMX Mode18 begins at a lower frequency 15007.5 Hz, drifts upwards in frequency more rapidly, and crosses over Mode26 to a higher frequency until you see it poke out at a higher frequency. Drift is shown sequentially below (in order of REF#) in a bit less than 1 hour snapshots over the 5 hours.
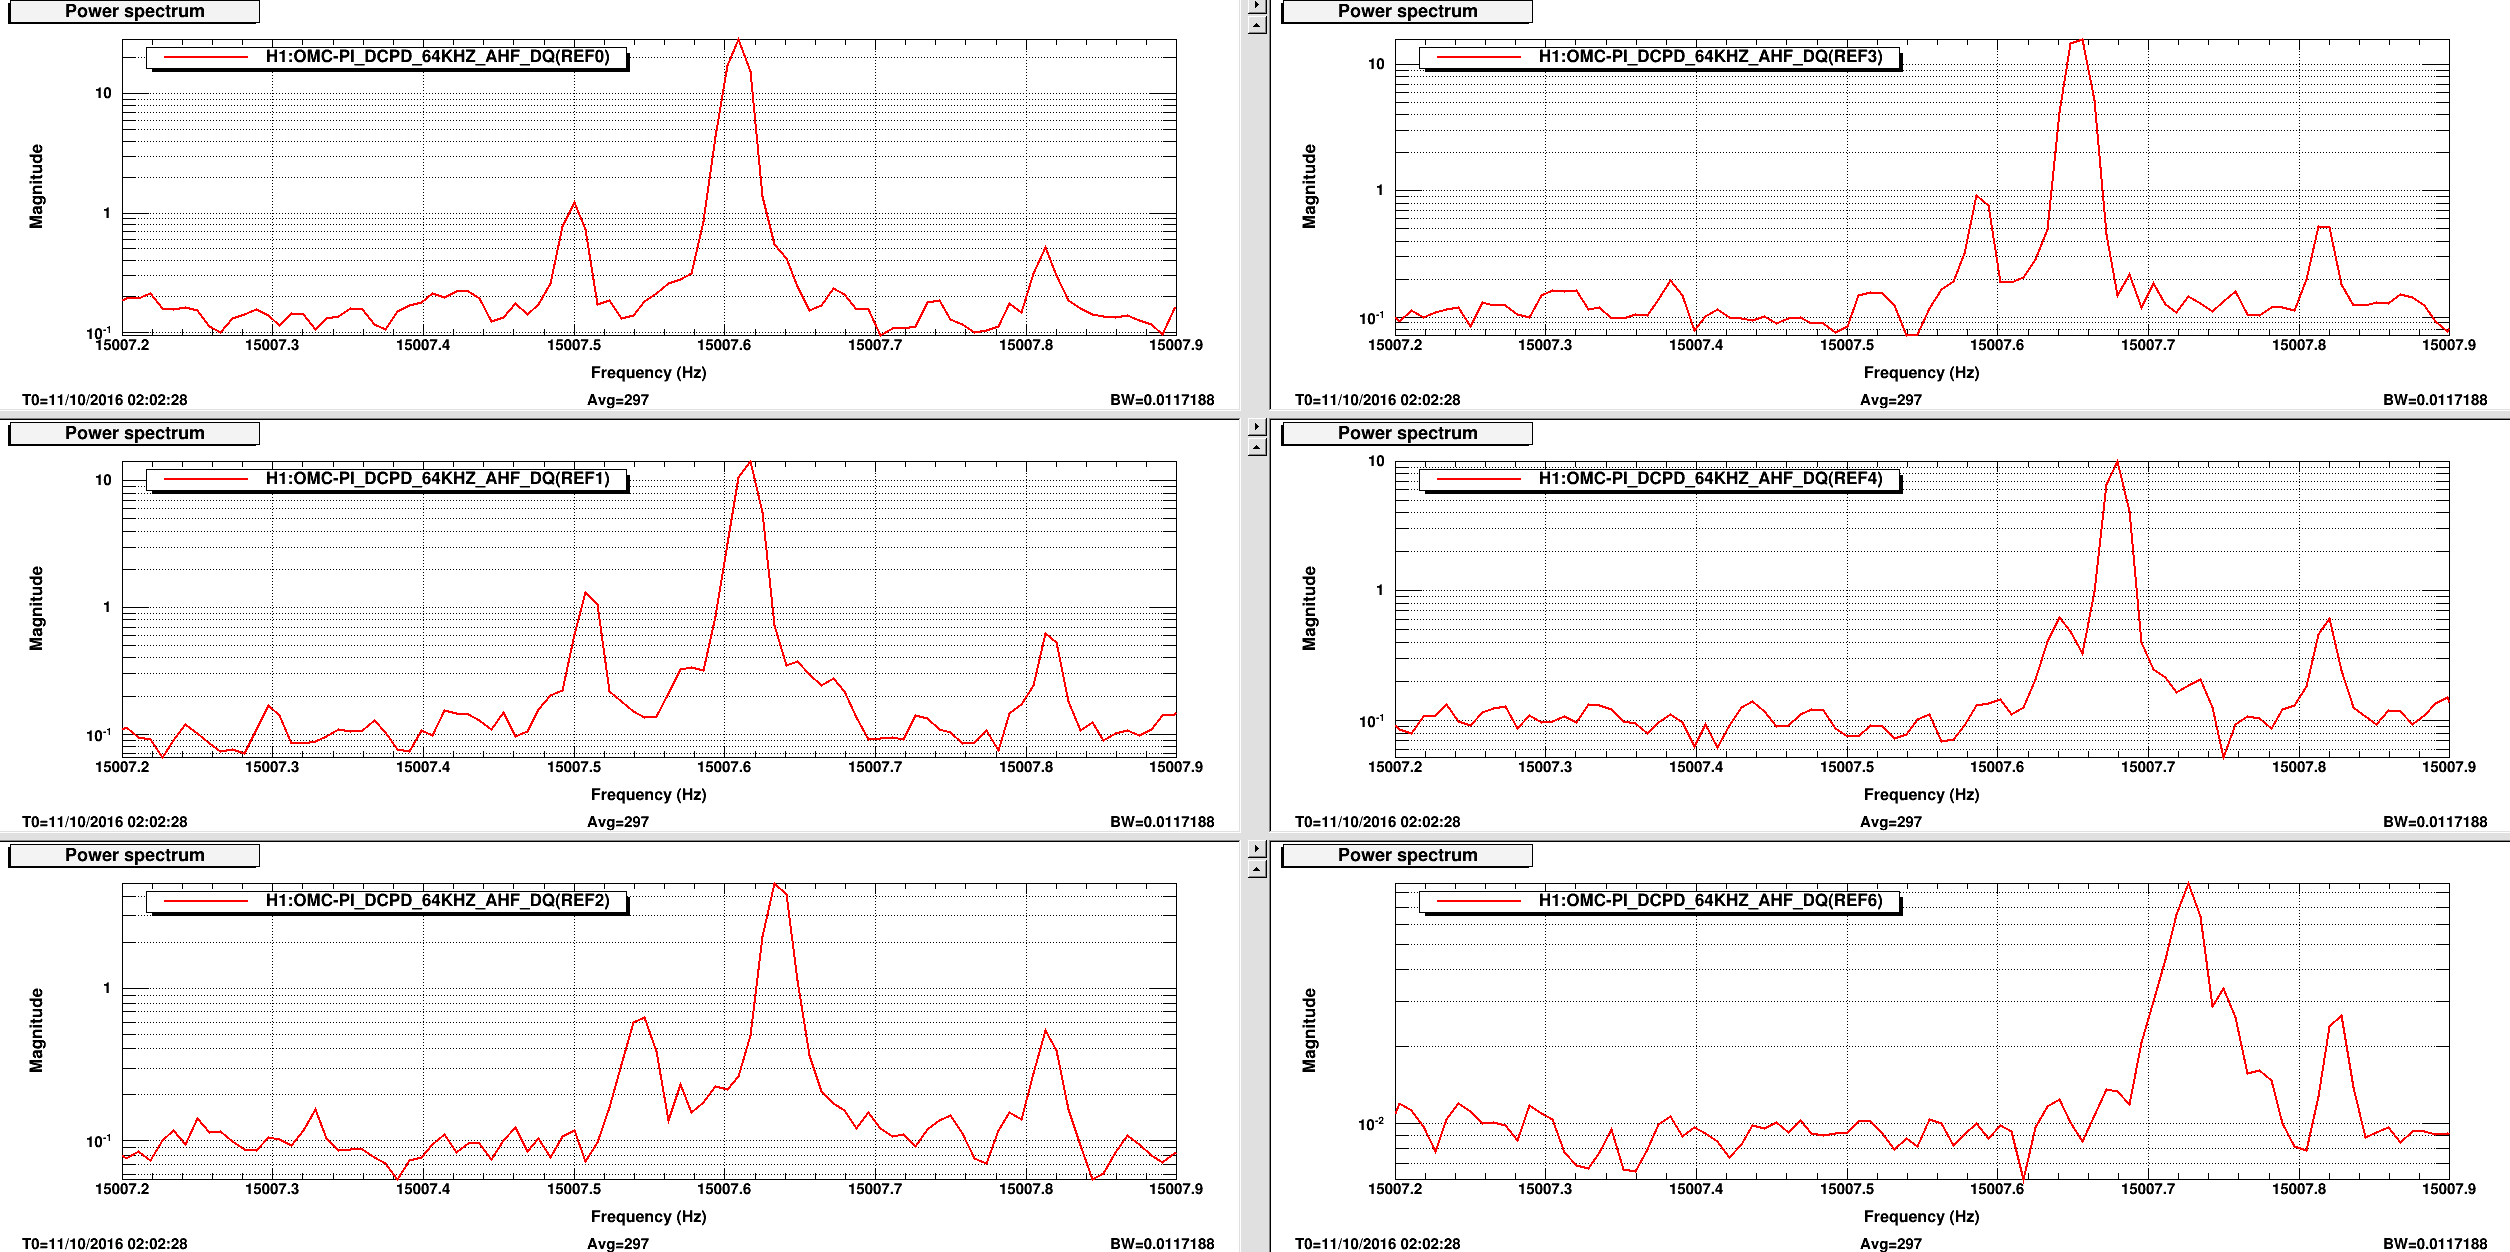
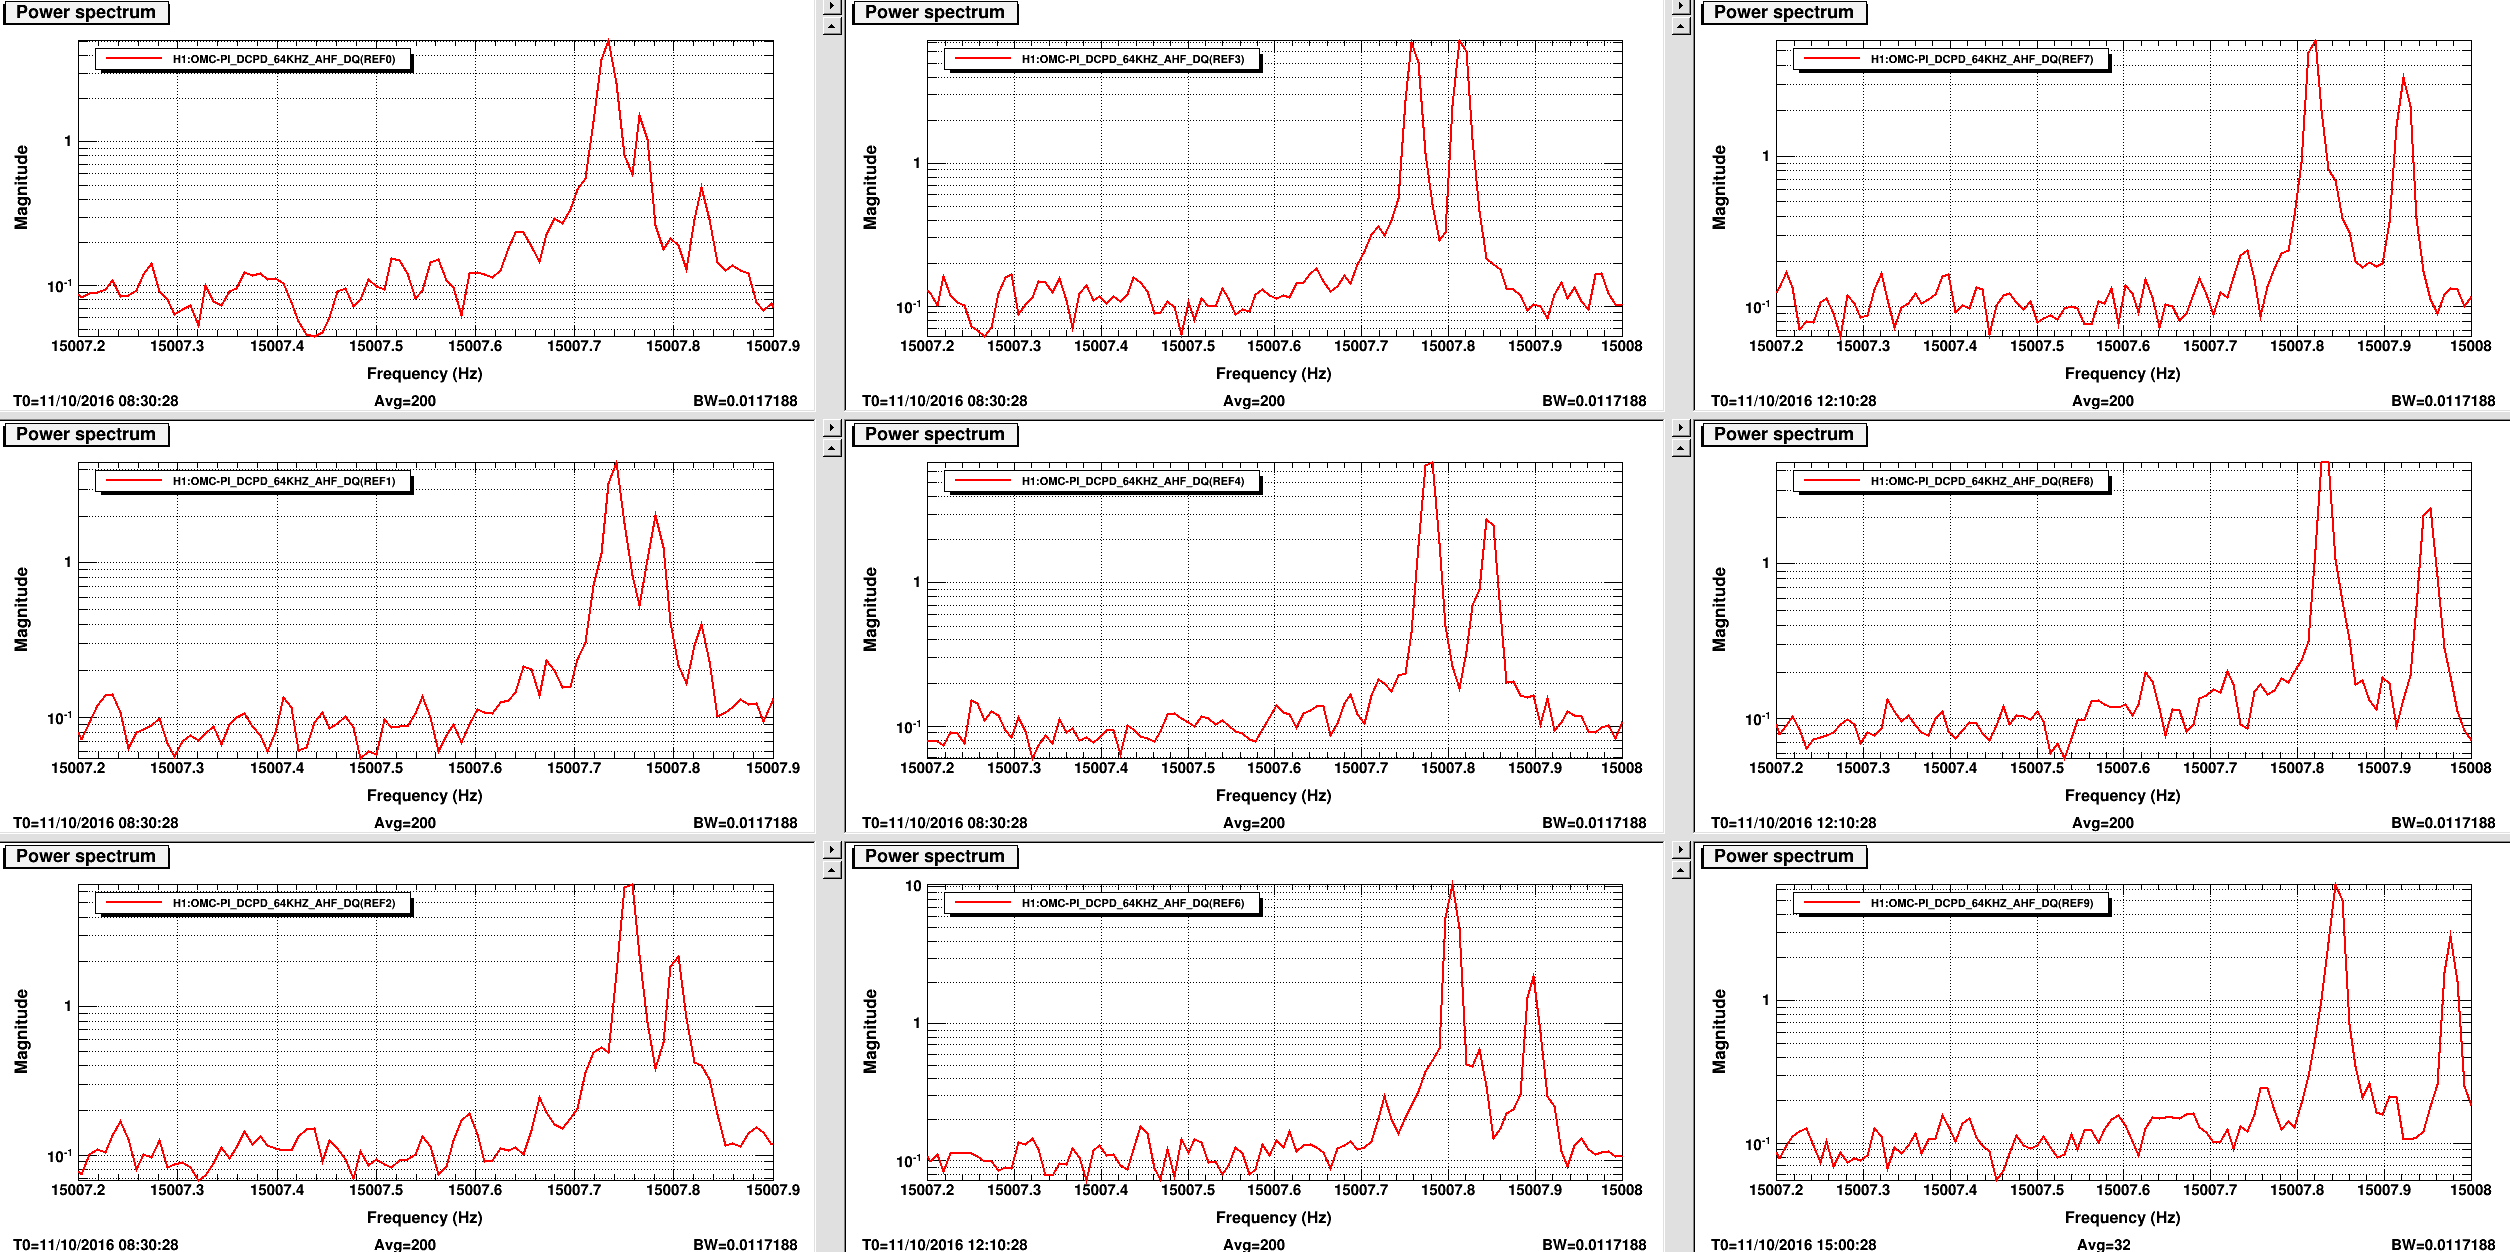
This cold-start 5 hour lock was followed by two rapid relocks of 3 and 4 hours respectively, allowing for a general trend of what a 12 hourish lock would look like since optics had little time to cool down. Attached are snapshots over the following two locks; combine with that above to get a good stop motion of the drift. Note that warm locks most likely won't see crossover.
Note the static peak ~ 15007.8 Hz. Its lack of drift with temperature suggest not a body mode, though its similar apparent width and overlap with the later stages of Mode18 helped me miss that crossover was happening. Crossover was also probably missed due to cold locks being more rare and the gain of Mode18 seemingly low during the times it's frequency is below Mode26.
Also attached is plot of frequency shift with time (not yet fit).
Damping: I've set up sequential guardian controlled band passes for Mode26 (and witnessed successful switching via guardian tonight); these should cover locks at least 12 hours long and each BP has at most +/- 24 deg phase. Mode18 is currently bandpassed for frequencies above Mode26; we'll have to think about and play with the PLL handling crossing modes a bit. Leaving this for now with the hopes that we relock over night in some reasonable time period and don't have a stone cold lock.
Summary: I have moved the POP_A and SOFT offsets to find better recycling gain (31.2ish rather than the 29.5 we had been getting). I was hoping that this would help eliminate the peaks in the 200-900 Hz region, and I think it did a bit, although not as much as I'd hoped. It did help the high frequency noise "tail" though.
History: Some time ago, Sheila and I moved the POP_A offsets to improve the recycling gain from 25ish, and that worked very well and has been very consistent. At the time, we stopped where we did because the POP_X centering PZT was hitting its rail, not because we thought we had found the best possible location. Then, we elected to move on to trying to get to low noise rather than continuing to chase alignment offsets. Now that we're at low noise though, I wanted to see if continuing to move the QPD offsets would help get rid of some of this jitter / frequency noise coupling.
What I did:
In the end, the power recycling gain is about 31.2, whereas it used to be about 29.5 in NomLowNoise before this work. Also, as Jeff points out in alog 30481, it looks like this did good things for the DARM cavity pole and the optical gain.
At about 06:49:15 UTC, I had just about the lowest value for the broad peak at about 440 Hz. Going back to the offsets I had at the time did not reproduce that low of a peak though and the recycling gain wasn't at its maximum, so I ended up sticking with the offsets that maximized the power recycling gain. I may go back and look at the alignment of all the optics at that time to see if there was anything drastically different.
I also turned back on Gabriele's Jitter feedforward with the same gain of -1, and it still seems to be doing quite well. I haven't looked at the coherence, so I don't know if this is quite as good as when he and I were tuning it earlier today, but it still made a significant improvement in the 80 Hz - 250+ Hz region. I have this feedforward turning off in the Down state of the ISC_LOCK guardian, but it must still be turned on by hand. Once we're satisfied that it does good consistently, we can add it to NoiseTunings.
For now, I'm leaving the POP_A offsets in place, but the SOFT offsets will be turned off upon lockloss. I want to make sure that including them during the acquisition sequence isn't harmful to lock acquisition before accepting them permanently. I'm hoping though that they're fine, so that the ASC will handle all the SRM moving and we don't have to do anything by hand. To be checked tomorrow.
Offsets that I like in the end are:
Ideas:
I've now accepted all these offsets in SDF. We have locked at least once with the SOFT input offsets turned on at the same time the SOFT loops are engaged, and the SRM dither servo keeps things under control. So, I trended from the time that I set those offsets, and put those offsets into the transmon QPDs. I don't think we've locked yet with the offsets migrated to the transmon QPDs, so we'll watch for that being okay next acquisition. Attached are the sdfs for before/after values for convenience.

Sheila, Jenne, Kiwamu
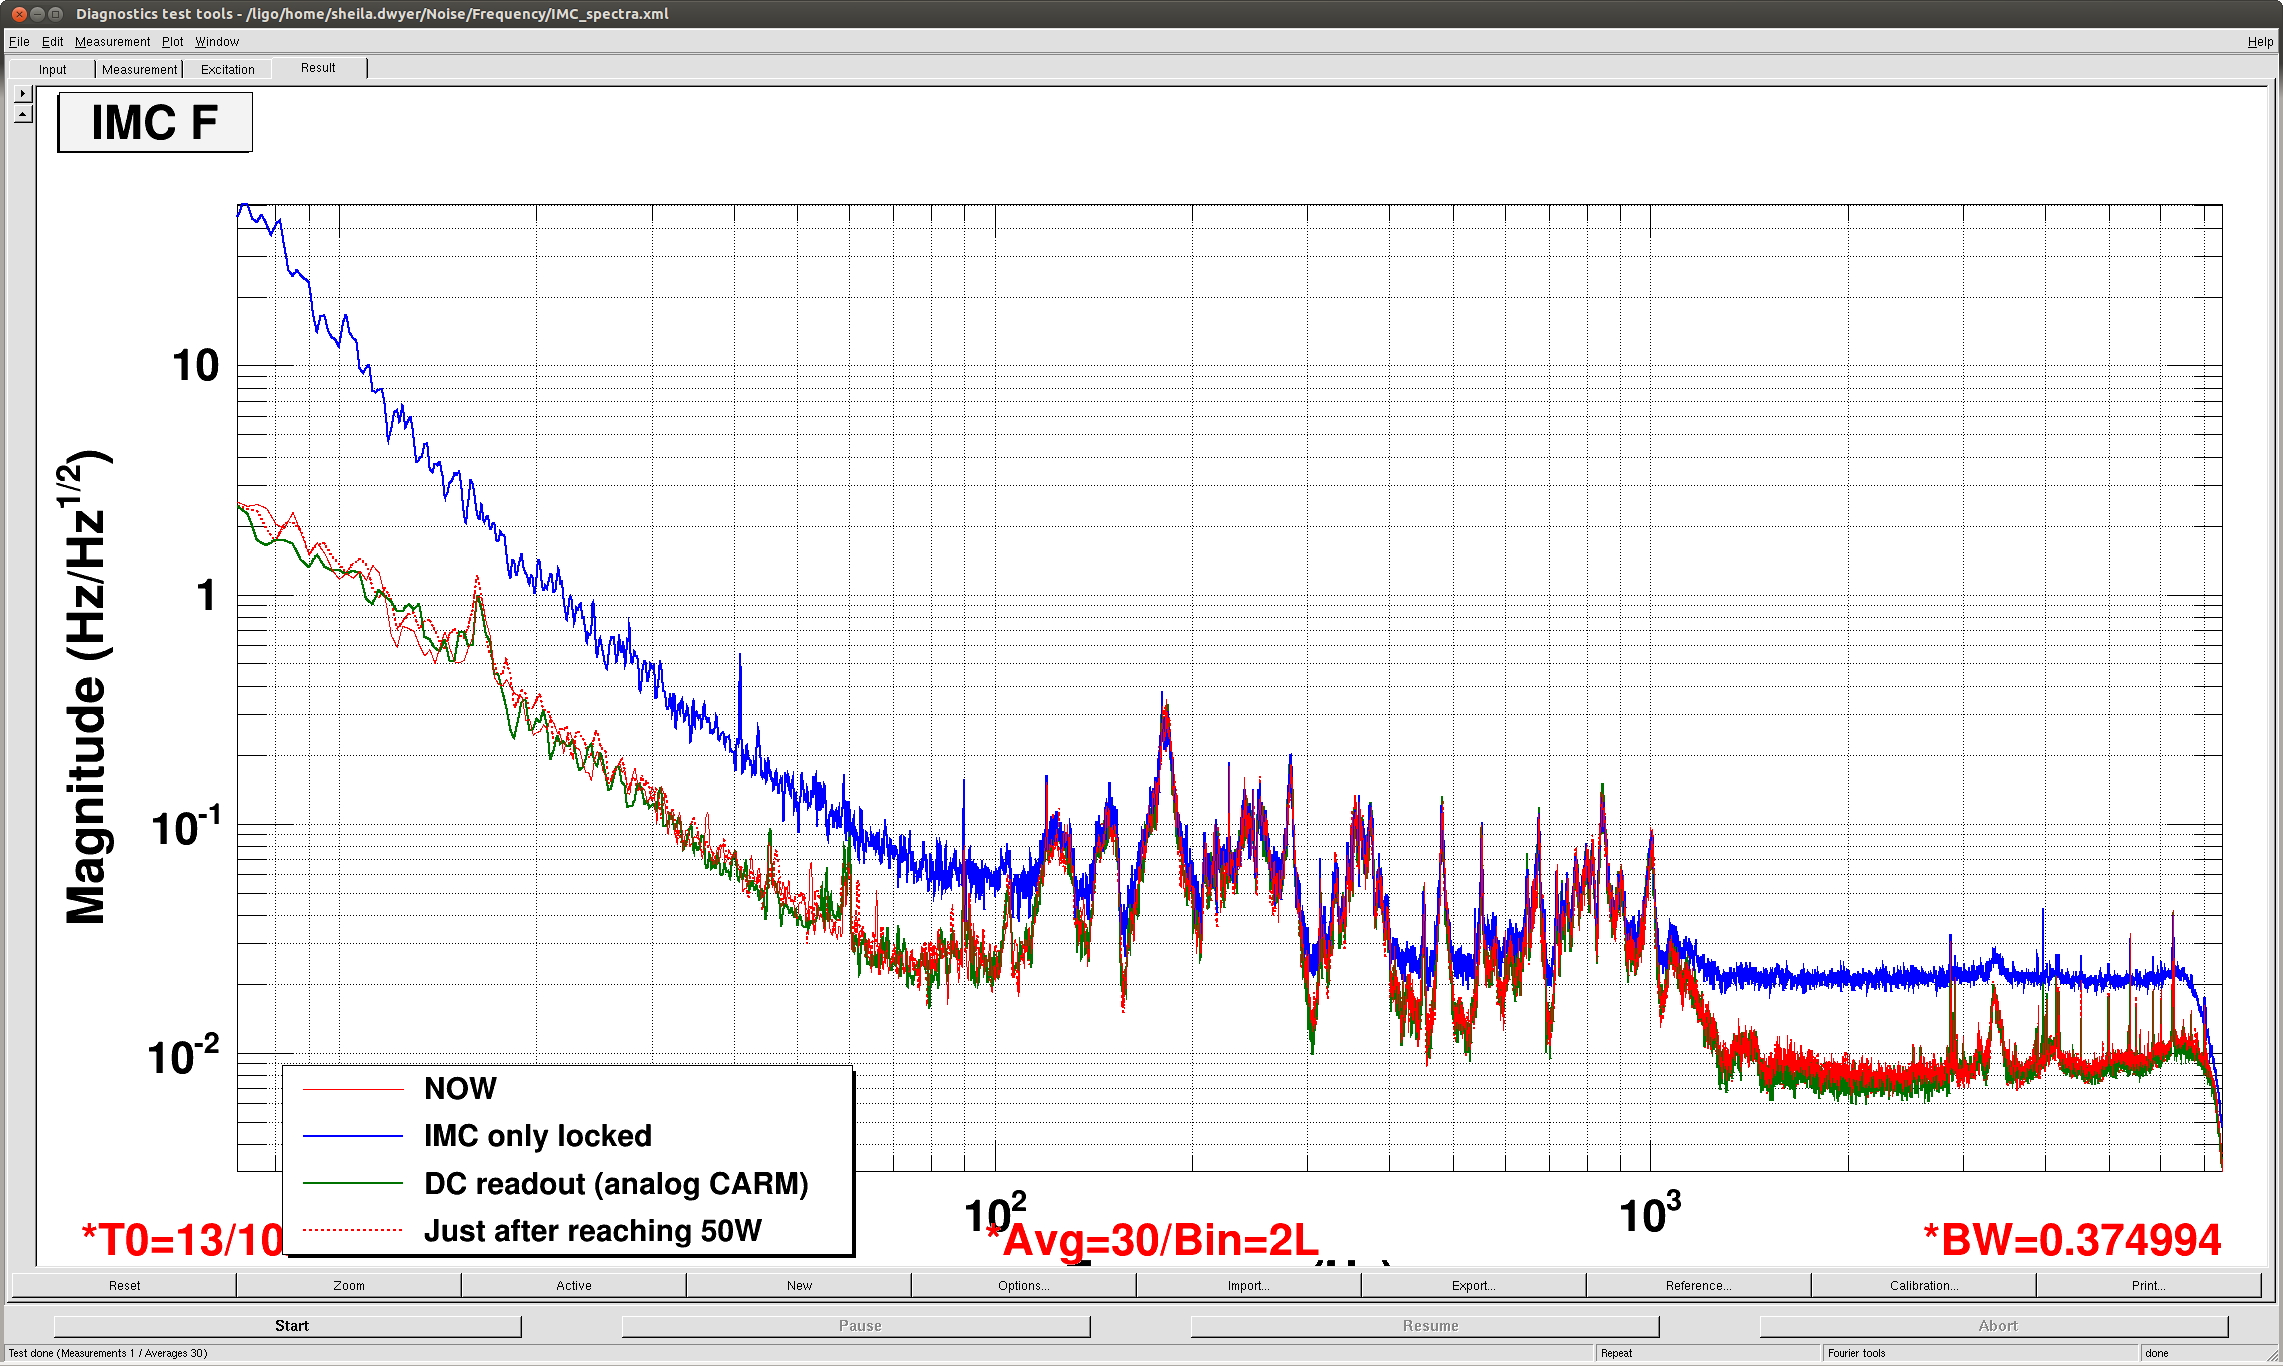
Attached is a spectra of IMC-F in different configurations. (MC locked at different powers, DC readout, low noise) From 100 Hz to about 1 kHZ, the spectrum of IMC F doesn't change much at all in all of these different configurations. So the IMC control signal is not dominated by REFL9 sensing noise in full lock, and probably represents the real frequency noise at the input to the IMC.
We can do a better job later, but if we assume this is really frequency noise we can roughly calibrate this into Watts on REFL 9I:
At 1kHz: 0.1Hz/rt Hz Frquency noise arriving at IMC (which is roughly consistent with measurements in P1100192, Fig 8) Suppresion of IMC loop: 1/200 (alog 22188) Supression of CARM loop (alog 22188, our ugf is now more like 8kHz) roughly a factor of 1/30. We can scale the DC optical gain of 0.017W/Hz used in 22188 by sqrt(2) to account for the factor of 2 increase in input power and the 6dB modulation index decrease since then. Taking into account the coupled cavity pole at 0.5 Hz give another factor of 1/2000:
0.1Hz/rtHz(1/200 Hz/Hz IMC supression )(1/30 Hz/Hz CARM suppression) (0.024*0.5/1000)W/Hz = 2e-10 Watts/rt Hz signal on REFL 9I or 1.7e-5 Hz/rt Hz of residual frequency noise expected.
We can repeat this at 400 Hz:
0.03Hz/rtHz(1/600 Hz/Hz IMC supression )(1/300 Hz/Hz CARM suppression) (0.024*0.5/400)W/Hz = 5e-12 Watts/rt Hz signal on REFL 9I or 1.7e-12 Hz/rt Hz of residual frequency noise expected.
Comparing this to Evan's in loop measurement of the CARM noise using REFL control, (here) it is close at 1 kHz but not at 400 Hz. You can also compare it to the transfer functions from REFL 9I to DARM posted here, and see that at 1 kHz the expected frequency noise is of the order of 5e-20 m/rt Hz at 1 kHz.
The main message: It is probably worth making a projection for frequency noise in DARM using IMC-F to estimate the frequency noise after the ref cav, because a very rough estimate says it could be within a factor of 2 of DARM at 1kHz.
I just quickly tried changing gains on the FSS while watching the IMC F spectrum in full lock. The features from 100 Hz-1kHz do not change in IMC F as the FSS gain at these frequencies changed by 7 dB, so we are not limited by gain in the FSS at these frequencies. The FSS might have been oscillating at both the highest and lowest gain settings here.
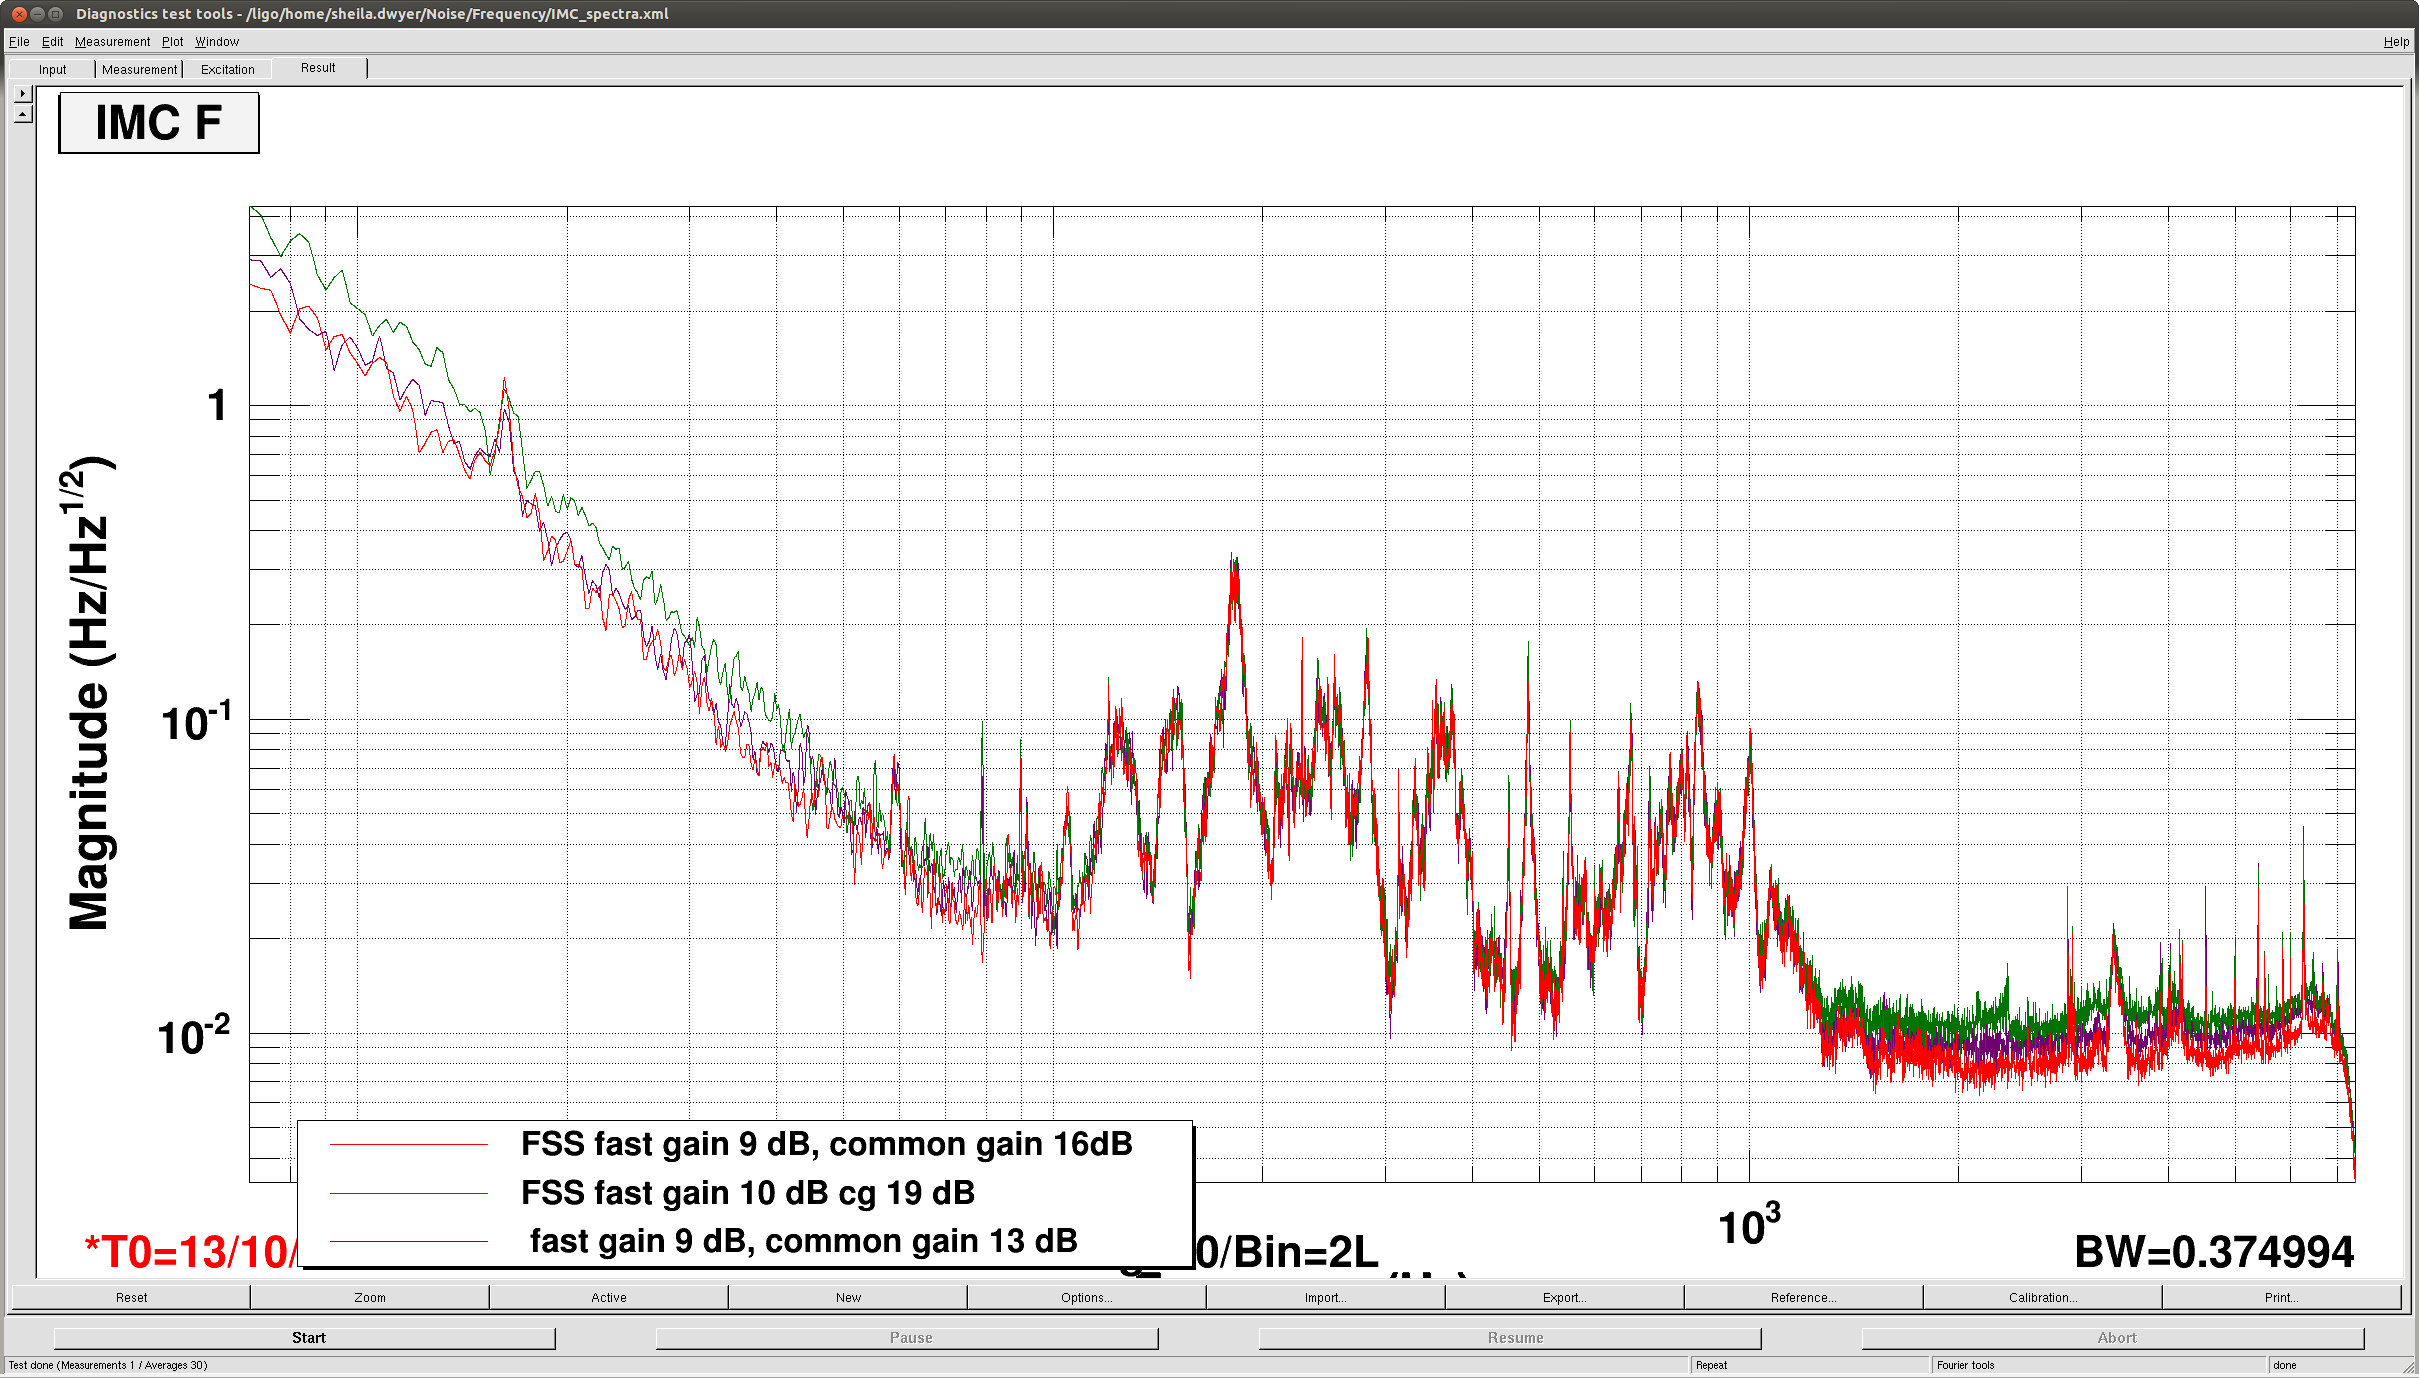
The gain at 1kHz from the IMC should be ~50 (ugf at 50 kHz) * 20 (boost) / 2 (mismatch between filter/cavity pole) ~ 500.
If the IMC gain is near 70 KHz one can probably kick in the second boost.
The noise level at high frequencies is 20 mHz/rtHz. Assuming this is the IMC shot noise at 2W, It would be at 4 mHz/rtHz at 50W. The VCO noise is around 2 mHz/rtHz at 1kHz. What we see is more like 8 mHz/rtHz, about twice higher than expected. Reference cavity?
The noise floor seen in IMCF with only the mode cleaner locked does not seem to be IMC diode shot noise, since it doesn't change as the input power is increased.
IFO in NLN. Handing off to Ed.

There have been diagnostic messages about input mirrors being out of nominal range. I have not attempted to correct these.
There have been ongoing dust alarms.

23:17 UTC Handed off from Cheryl in NLN
23:44 UTC Lock loss. Noise eater in oscillation.
23:55 UTC back from resetting noise eater
00:27 UTC lock loss from LOWNOISE_ESD_ETMY
00:34 UTC Kiwamu and Nutsinee testing TCS
00:37 UTC Stopping at DMRI_LOCKED for Jenne
00:41 UTC Jenne done, moving on
01:02 UTC NLN
02:06 UTC Conlog test restart
02:13 UTC lock loss (Jeff K.)
02:43 UTC NLN
02:51 UTC Sheila to LVEA to plug in SR785
02:56 UTC Sheila back
03:35 UTC Jeff K. done measurements
03:53 UTC Sheila to LVEA
03:57 UTC Sheila back
04:02 UTC Lock loss. Tripped HAM6 ISI and SUS OMC. Earthquake.
04:07 UTC Pausing in DOWN for Sheila
04:50 UTC Relocking
05:22 UTC NLN
05:23 UTC damped PI mode 26 (changed phase to -60)
05:28 UTC lock loss (Jenne)
06:03 UTC lock loss
06:41 UTC NLN Terra damping mode 26
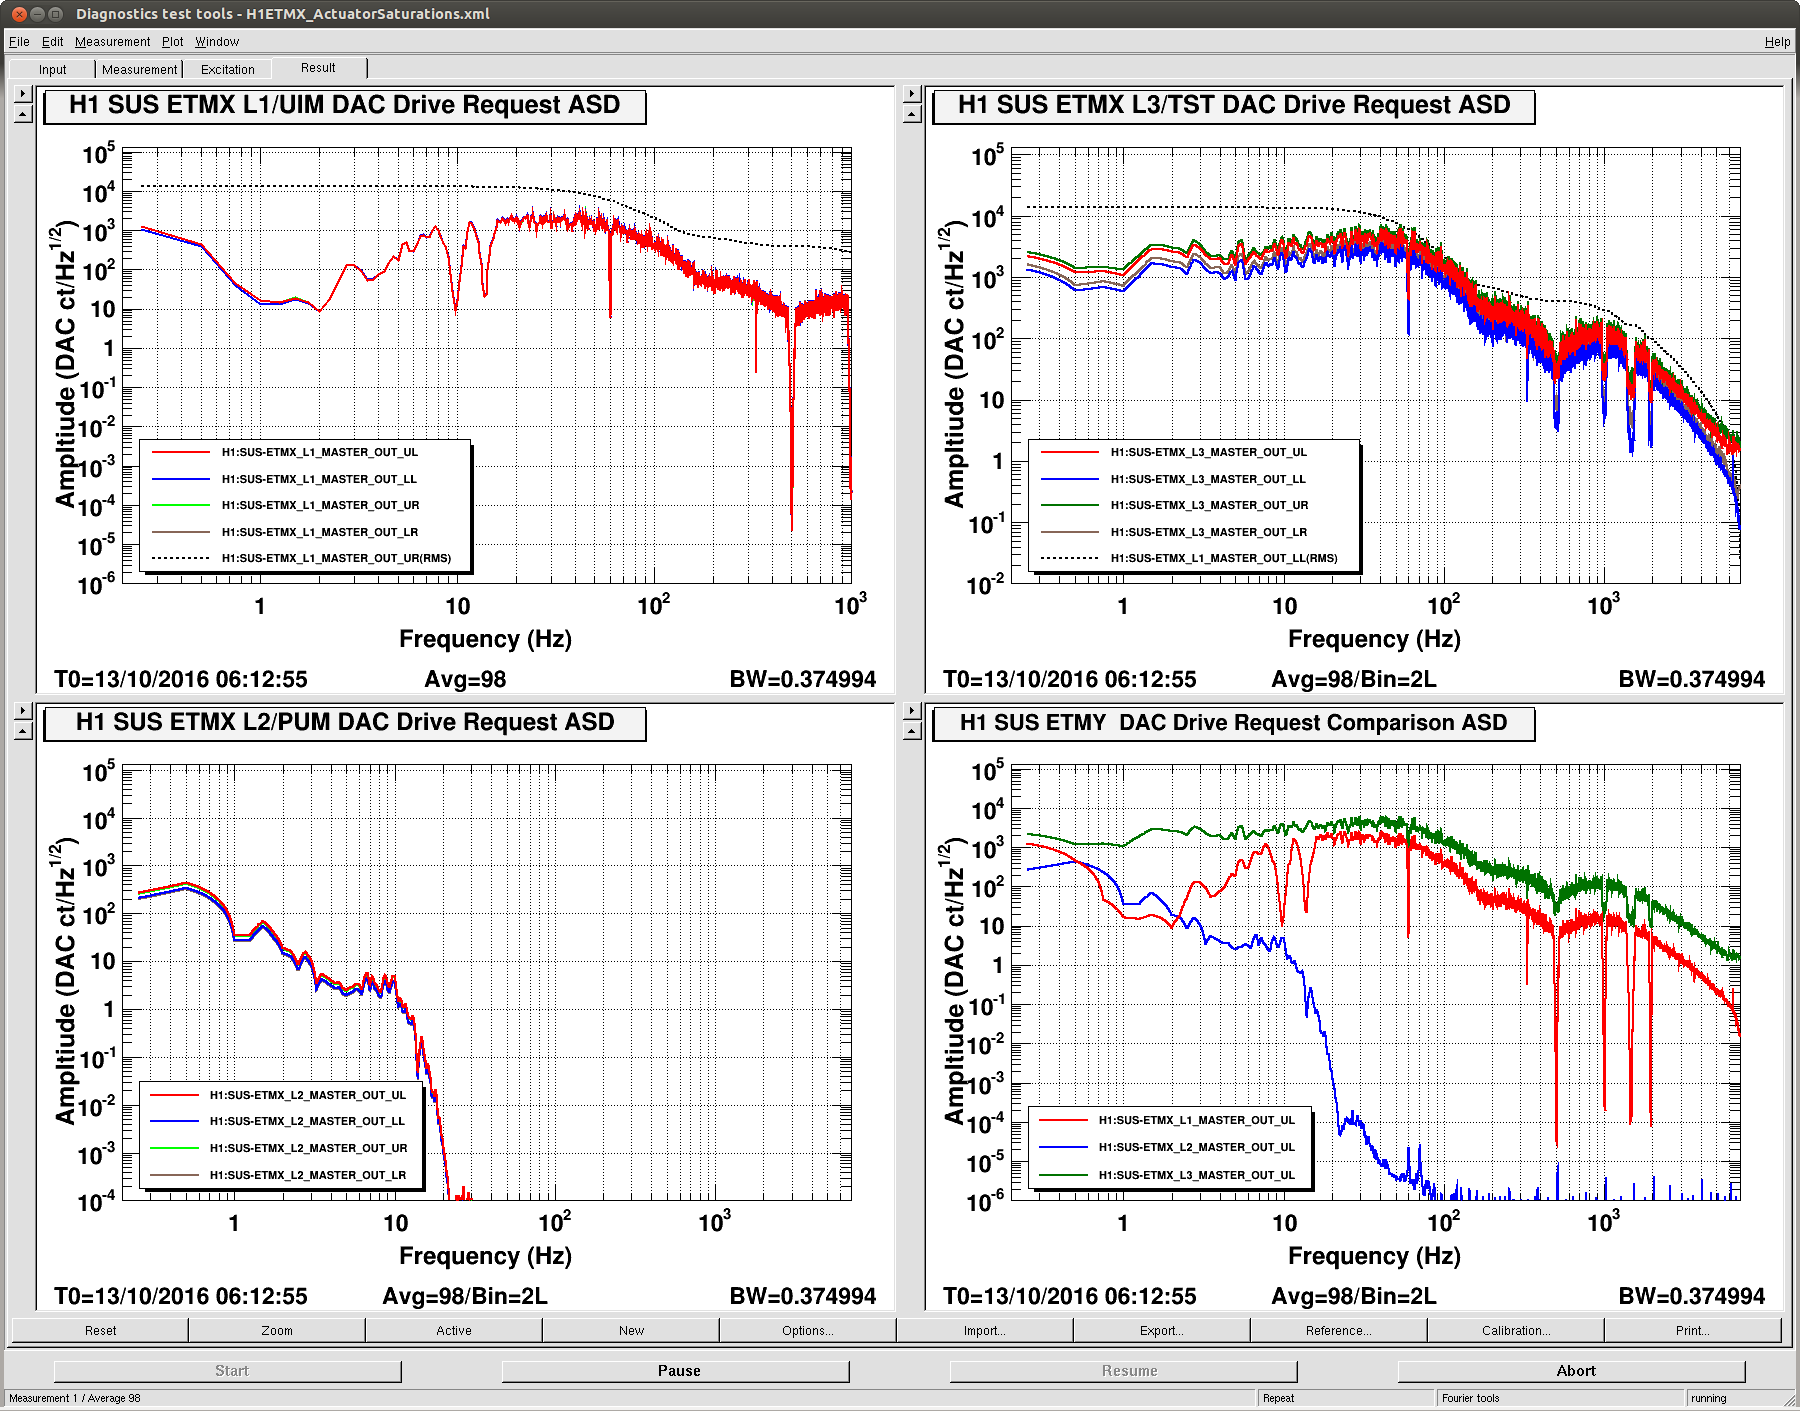
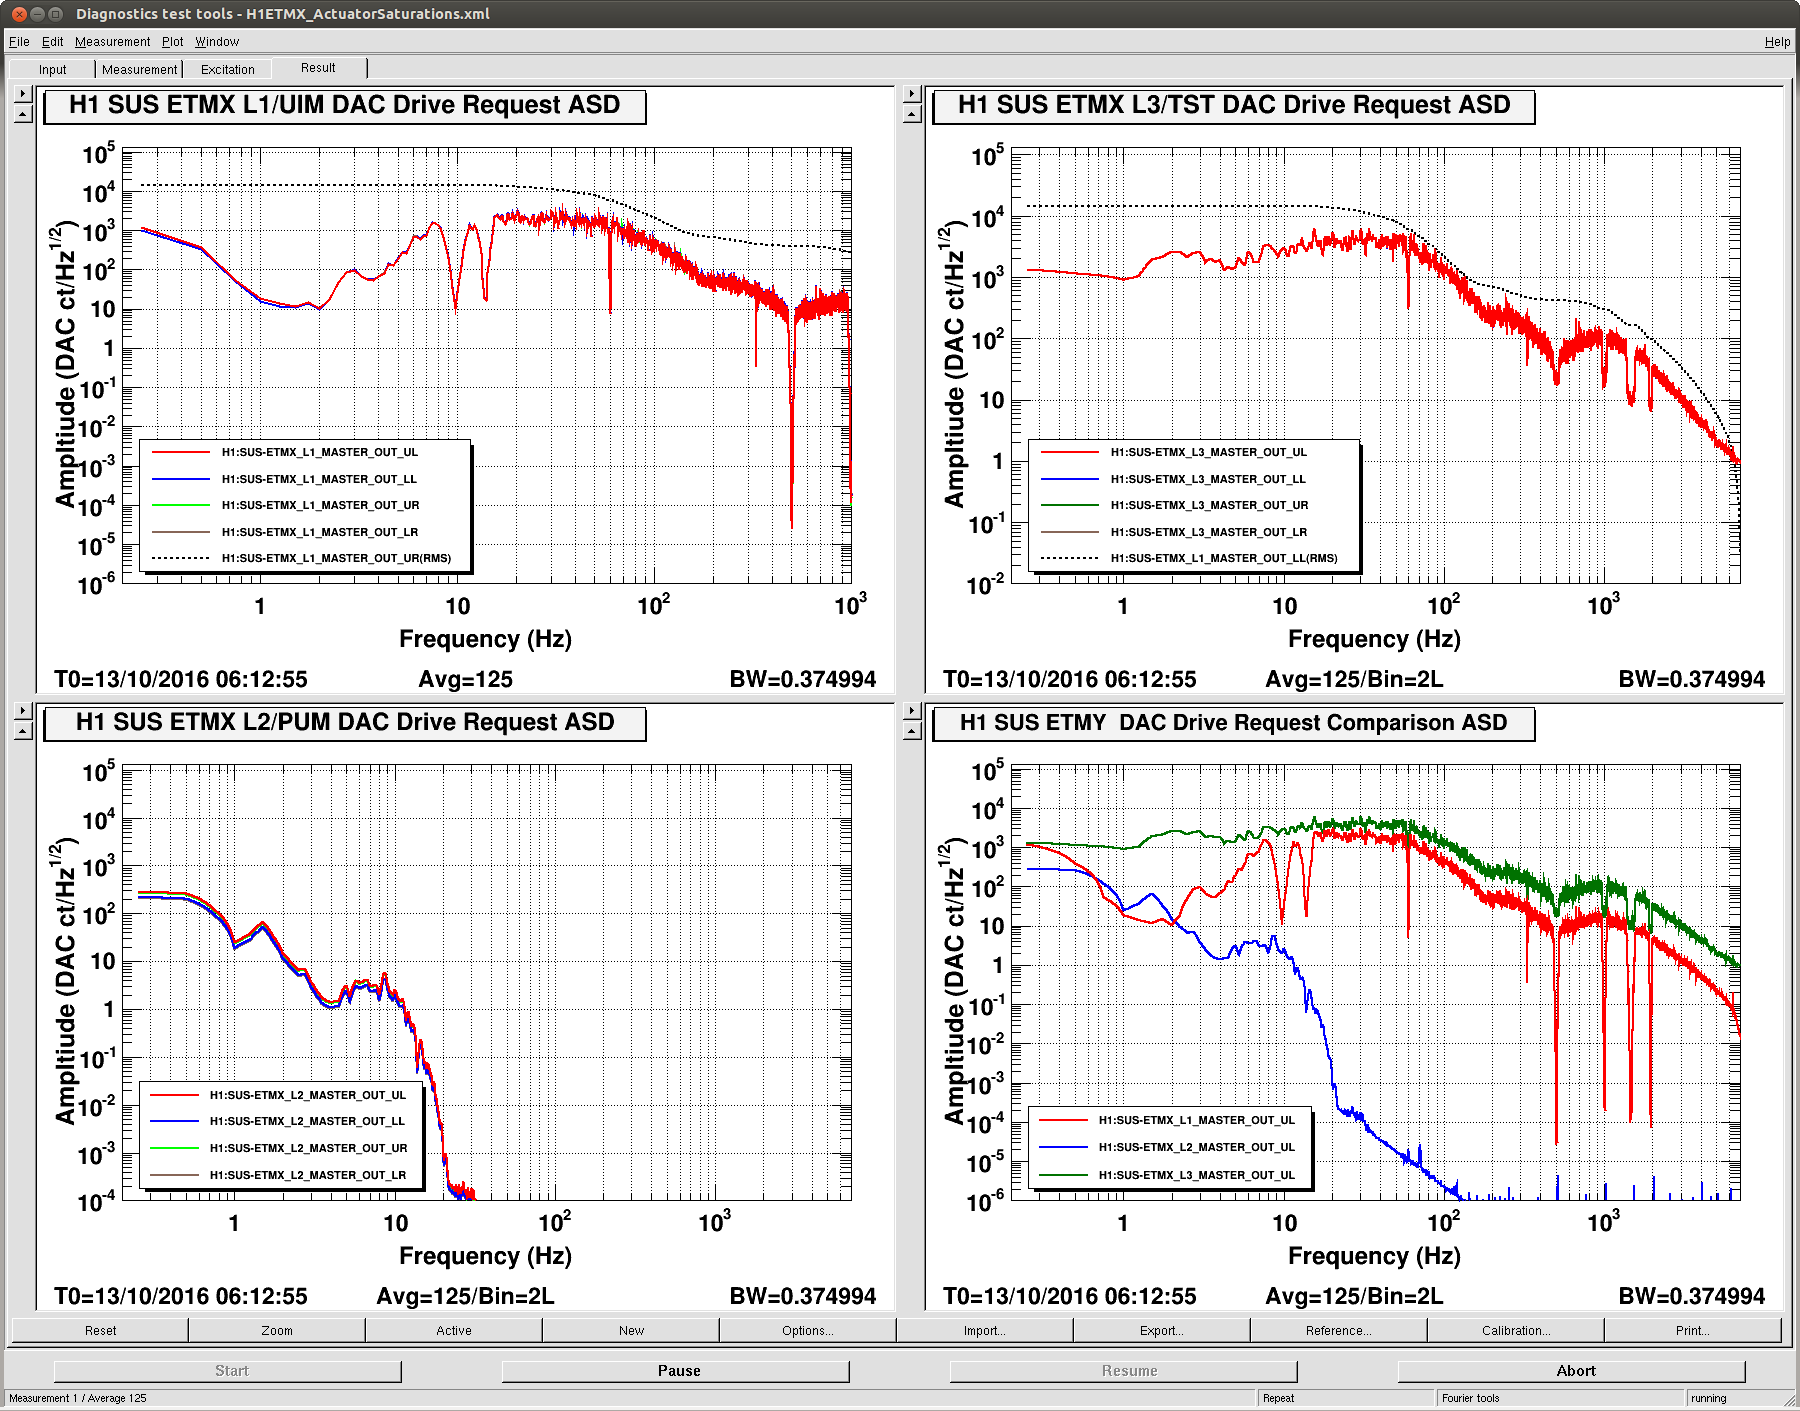
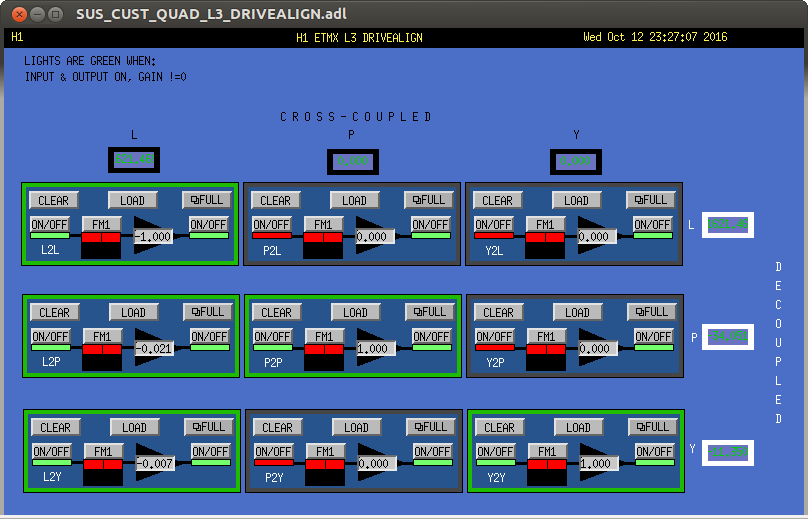
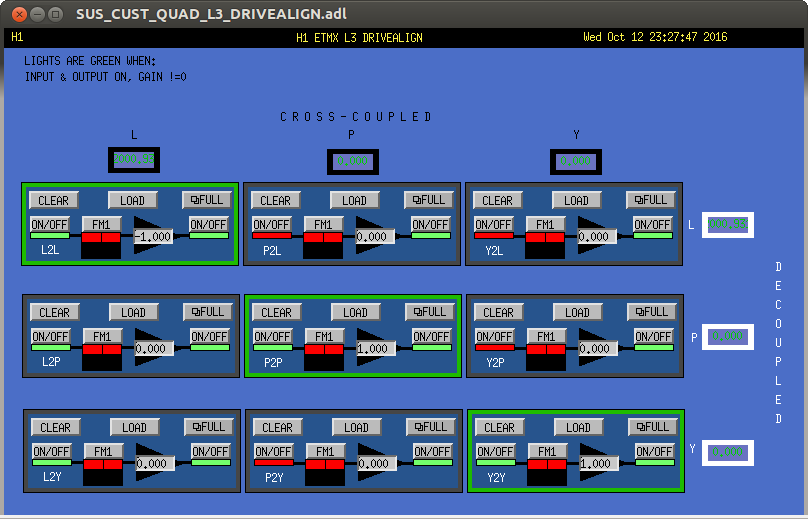
J. Kissel, J. Driggers, S. Dwyer

Annoyed by the constant verbal alarms of SUS ETMX saturating while the arms are controlled by ALS, I took a spectra of the L3 / ESD output request. The spectra revealed two things:
(1) We still should have plenty of head room, with the upper ESD quadrants requesting the largest drive, but that drive still only having an RMS of ~20e3 [ct], out of the 128e3 [ct] DAC range and being quite featureless. It makes no sense that we're constantly saturating.
(2) The upper quadrants are receiving more drive than the lower quadrants, which was suspicious because we traditionally don't drive the ESD in angle.

Upon further investigation, we reminded ourselves that there have been off-diagonal, L2A elements in ETMX's L3 / ESD DRIVEALIGN matrix since 2014 (LHO aLOG 15260). As a quick test, we reduced these elements to zero. It had two effects:
(1) It *didn't* affect the ALS DIFF control at all, and we rode happily through the lock acquisition sequence, and
(2) It reduced the drive a little bit, so the ESD quadrants saturated a little less. It still saturates pretty regularly though.

As such, Jenne's accepted the removal of these elements in the SDF system, and removed the check for them from the DOWN state of the ISC_LOCK guardian. The other good news about this -- two fewer signs to keep track of when flipping the ESD bias sign on ETMX. I wish it would have cured the constant saturation problem though!

EX EX EX EX EX EX EX EX EX EX EX EX
EX EX EX EX EX EX EX EX EX EX EX EX
EX EX EX EX EX EX EX EX EX EX EX EX
EX EX EX EX EX EX EX EX EX EX EX EX
EX EX EX EX EX EX EX EX EX EX EX EX
EX EX EX EX EX EX EX EX EX EX EX EX ...
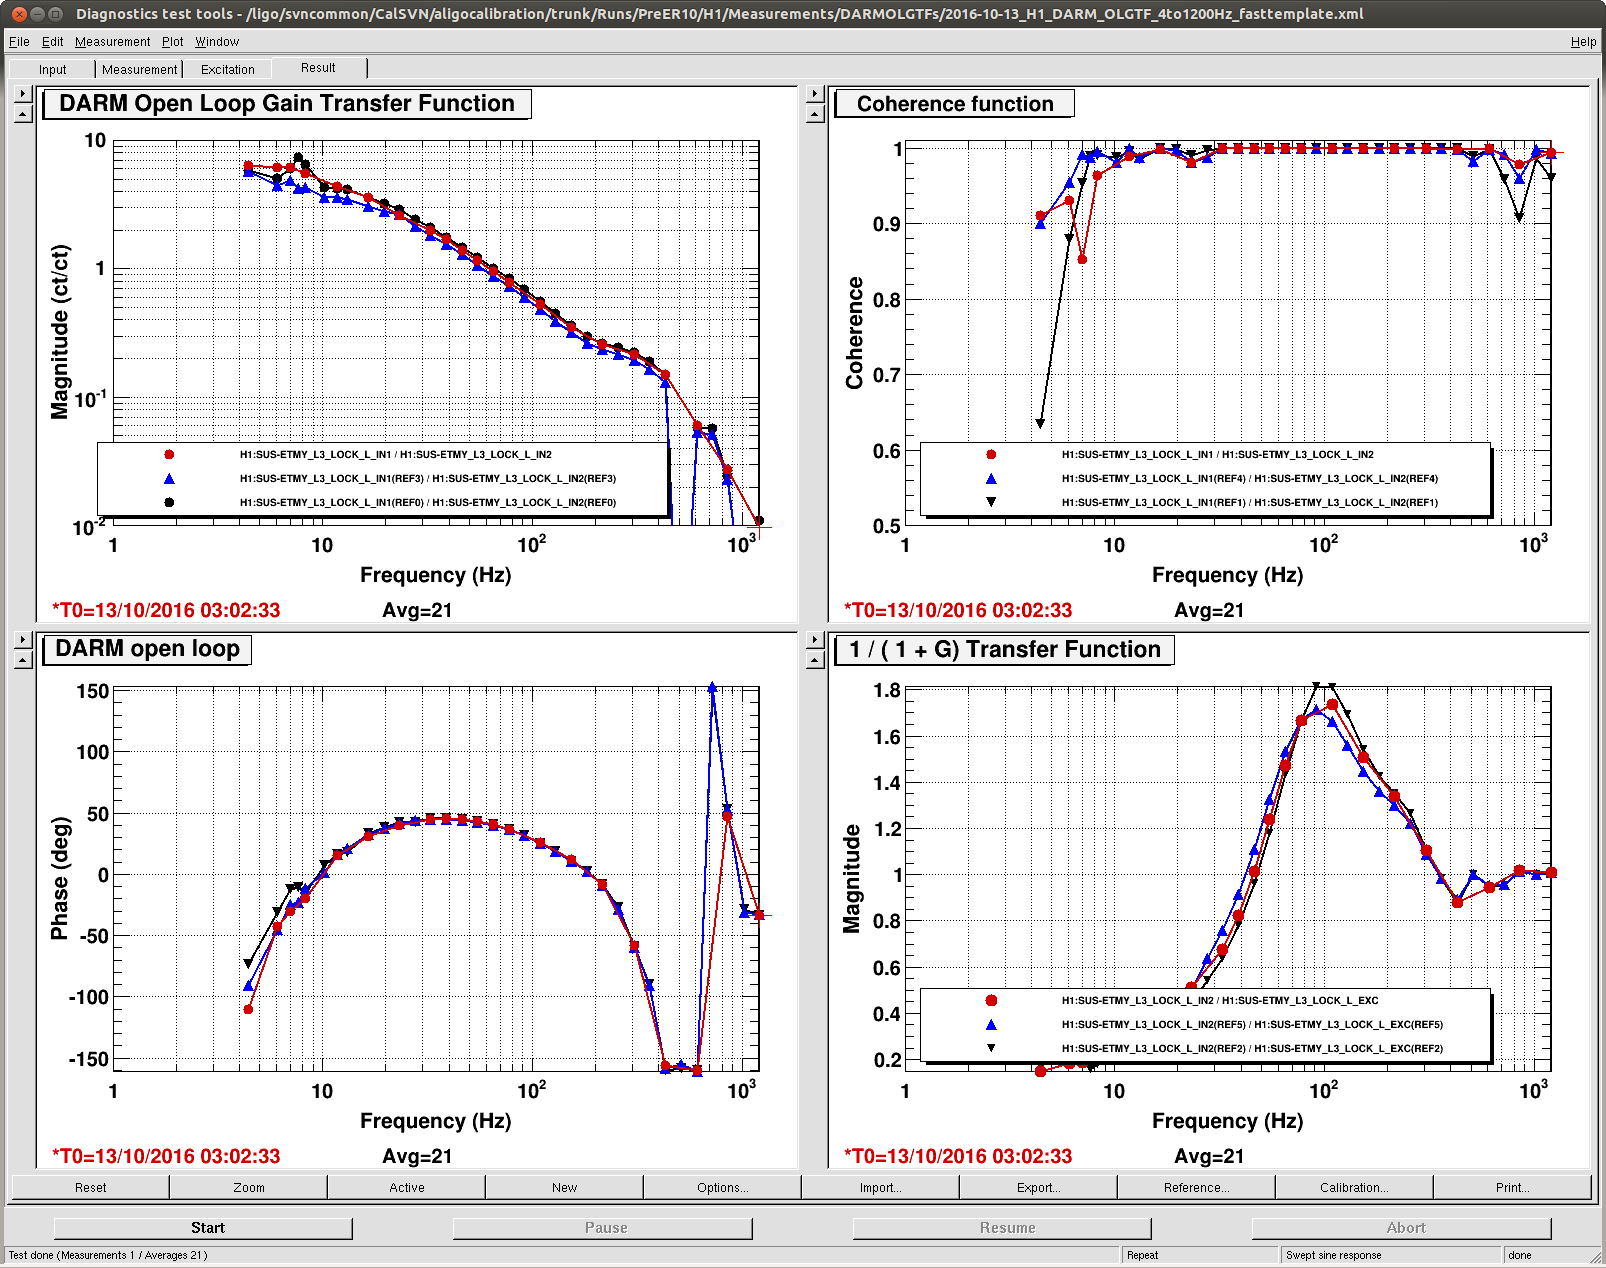
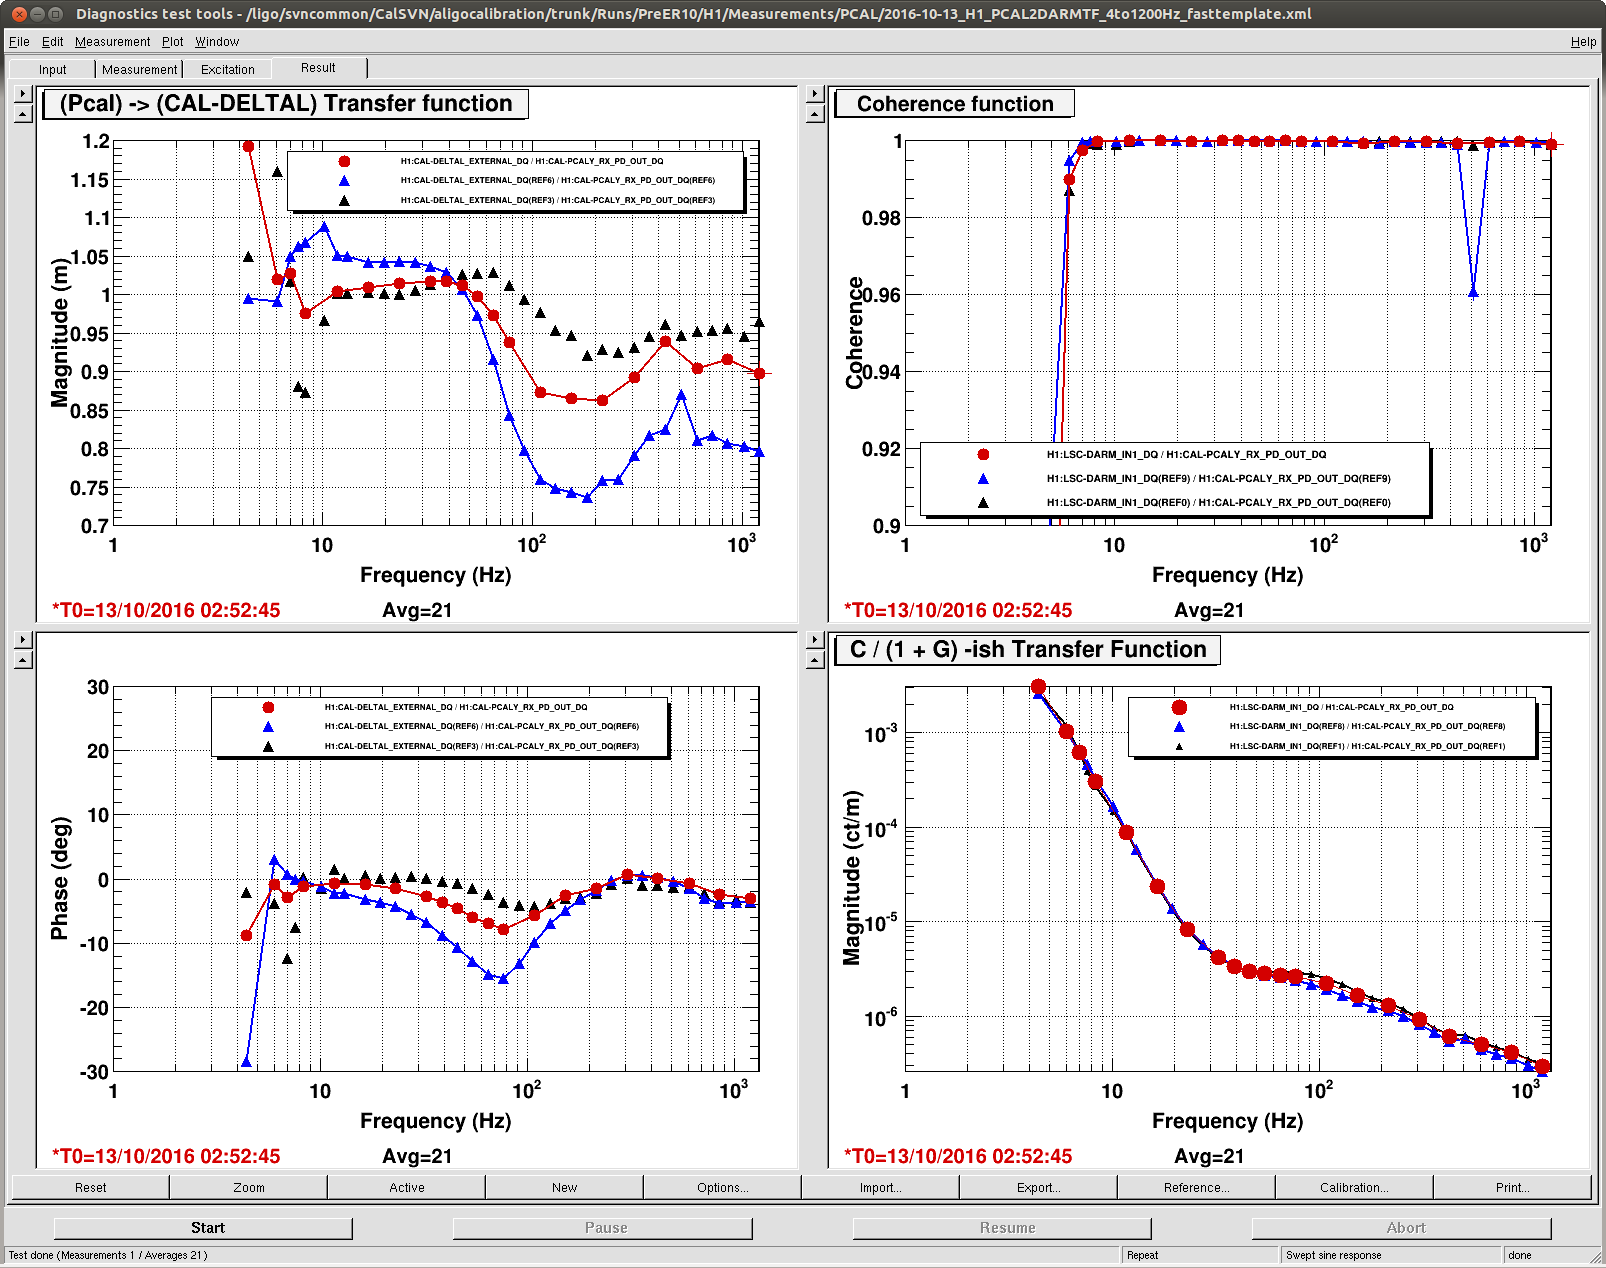
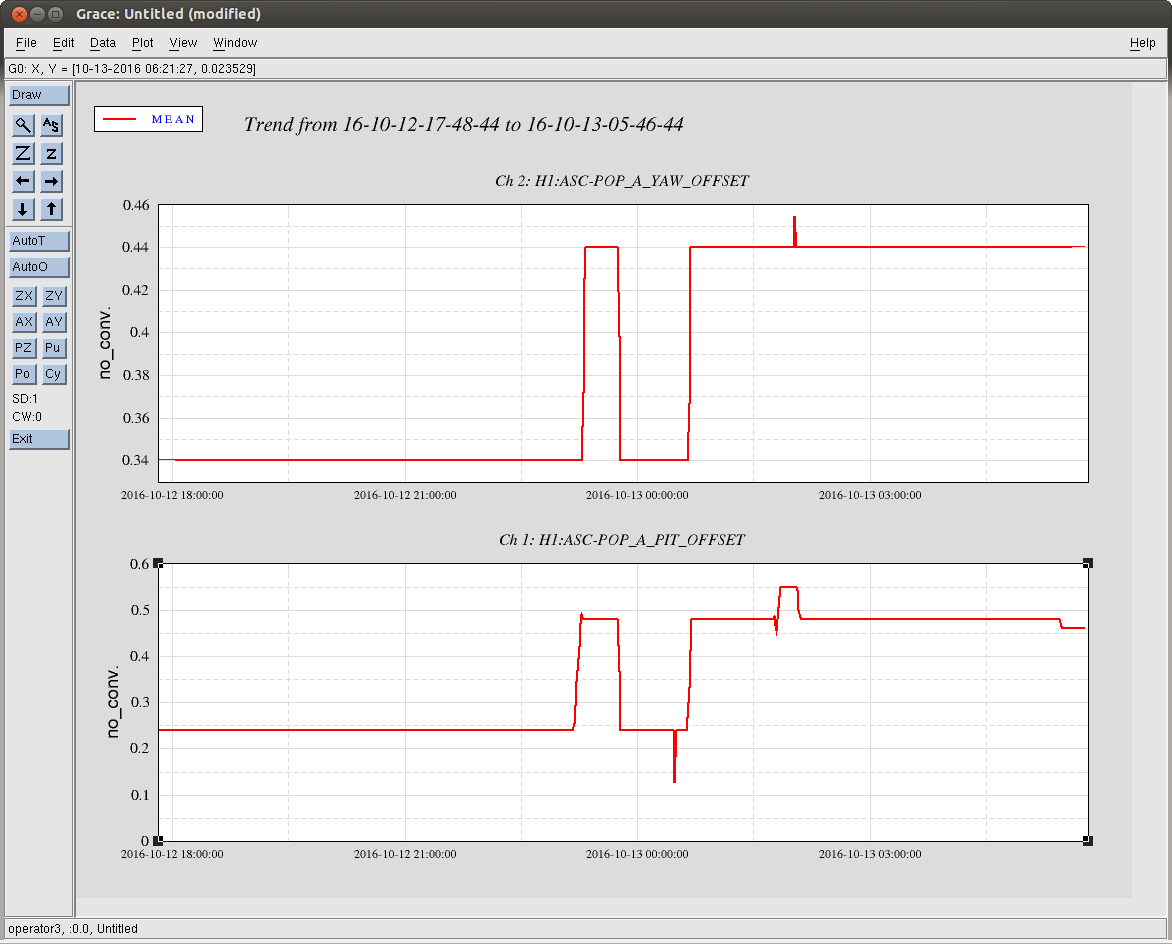
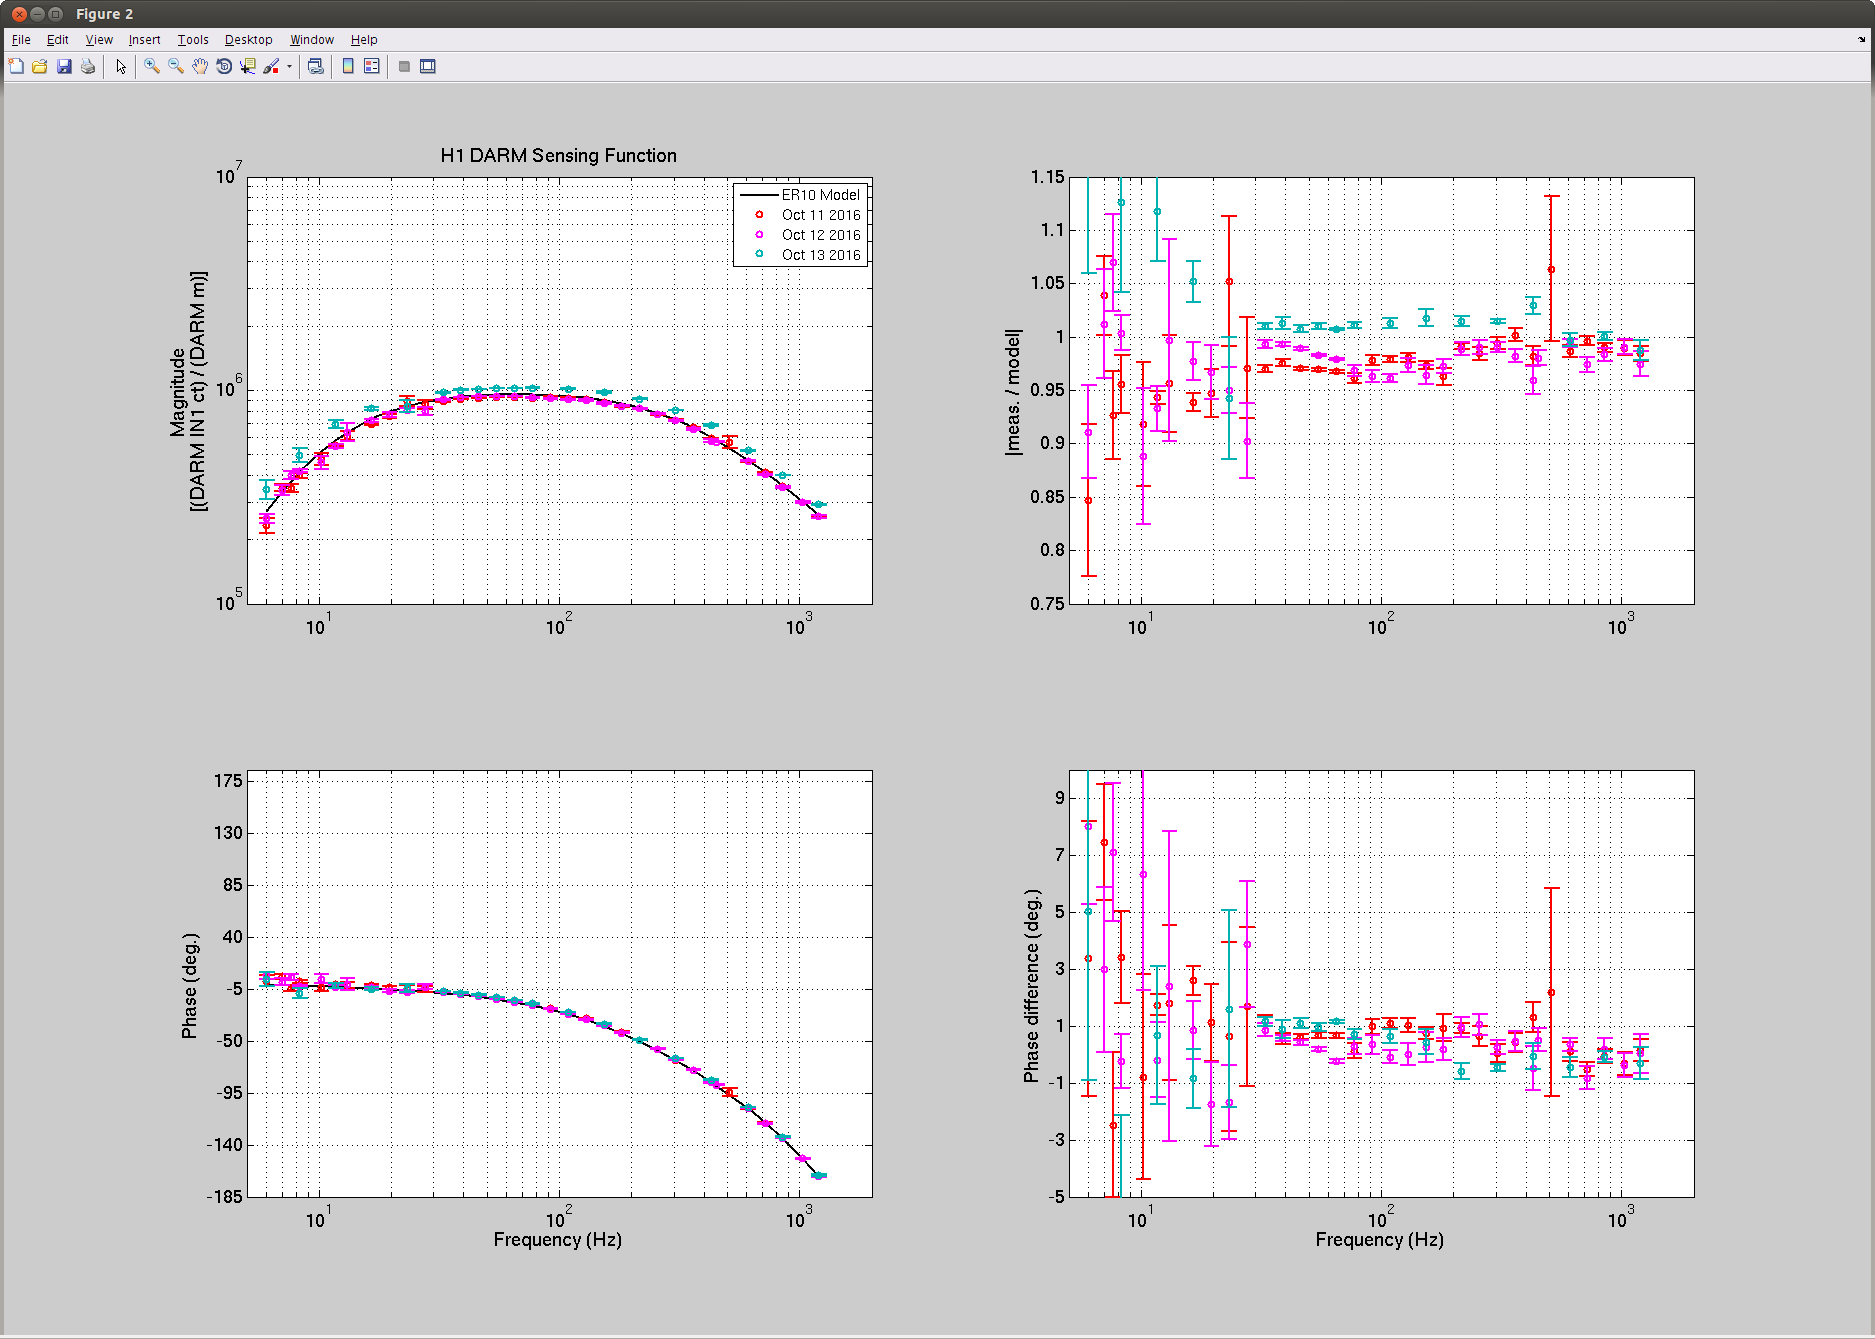
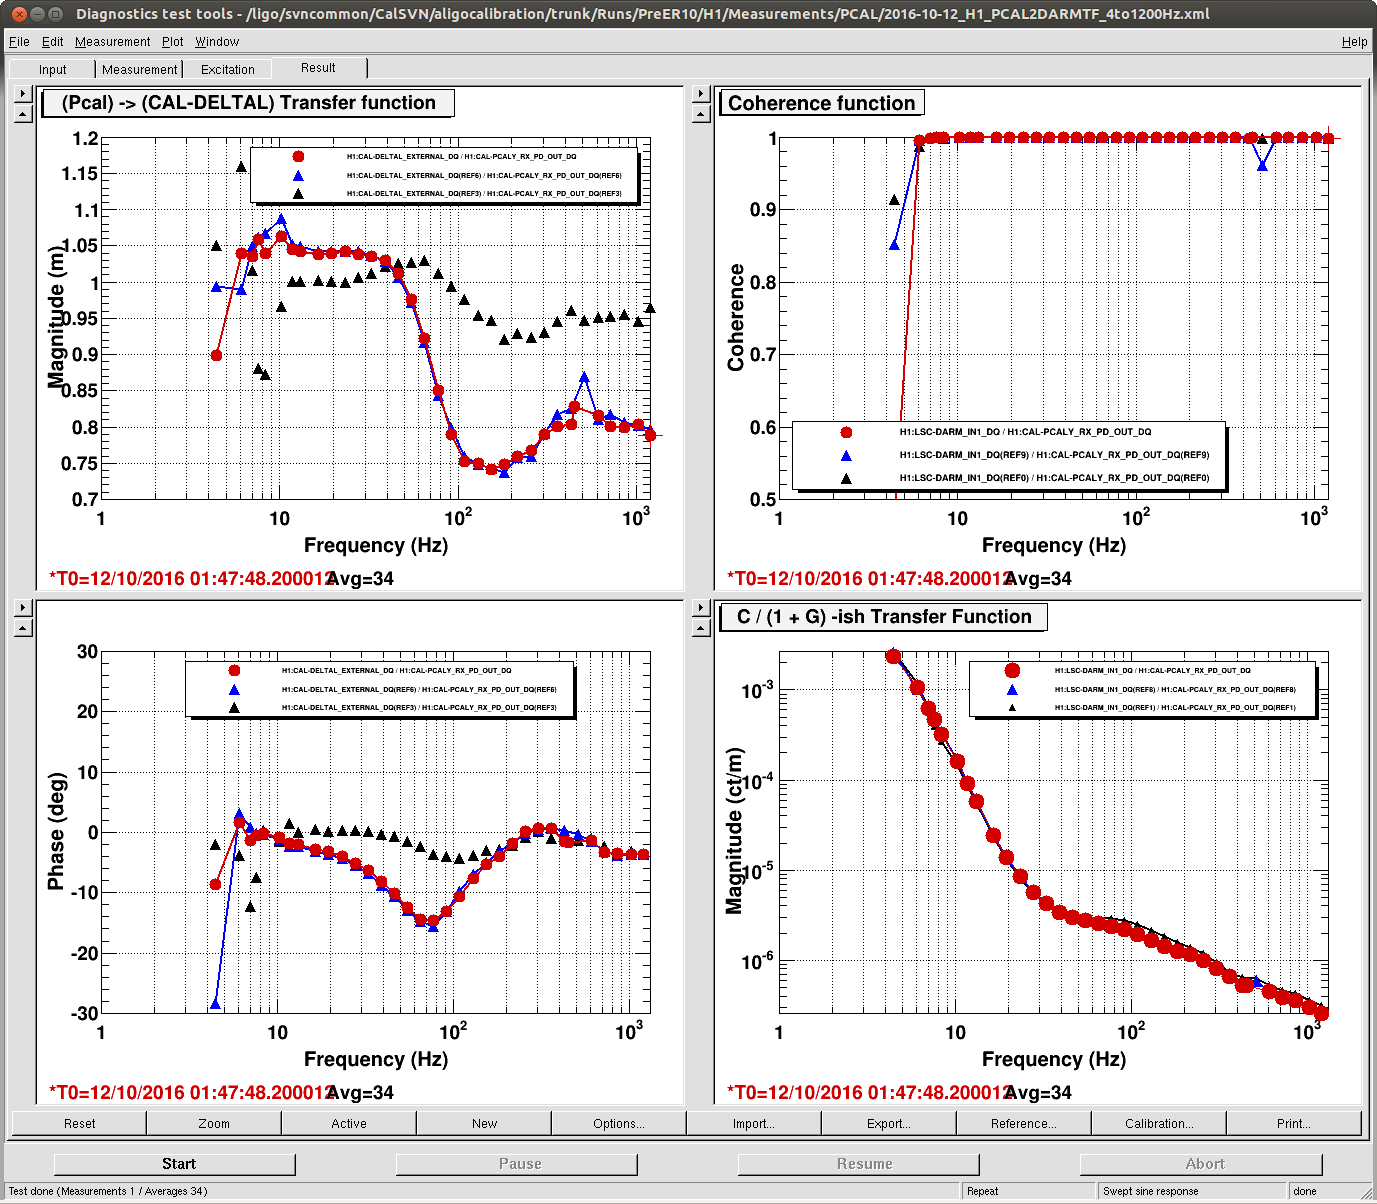
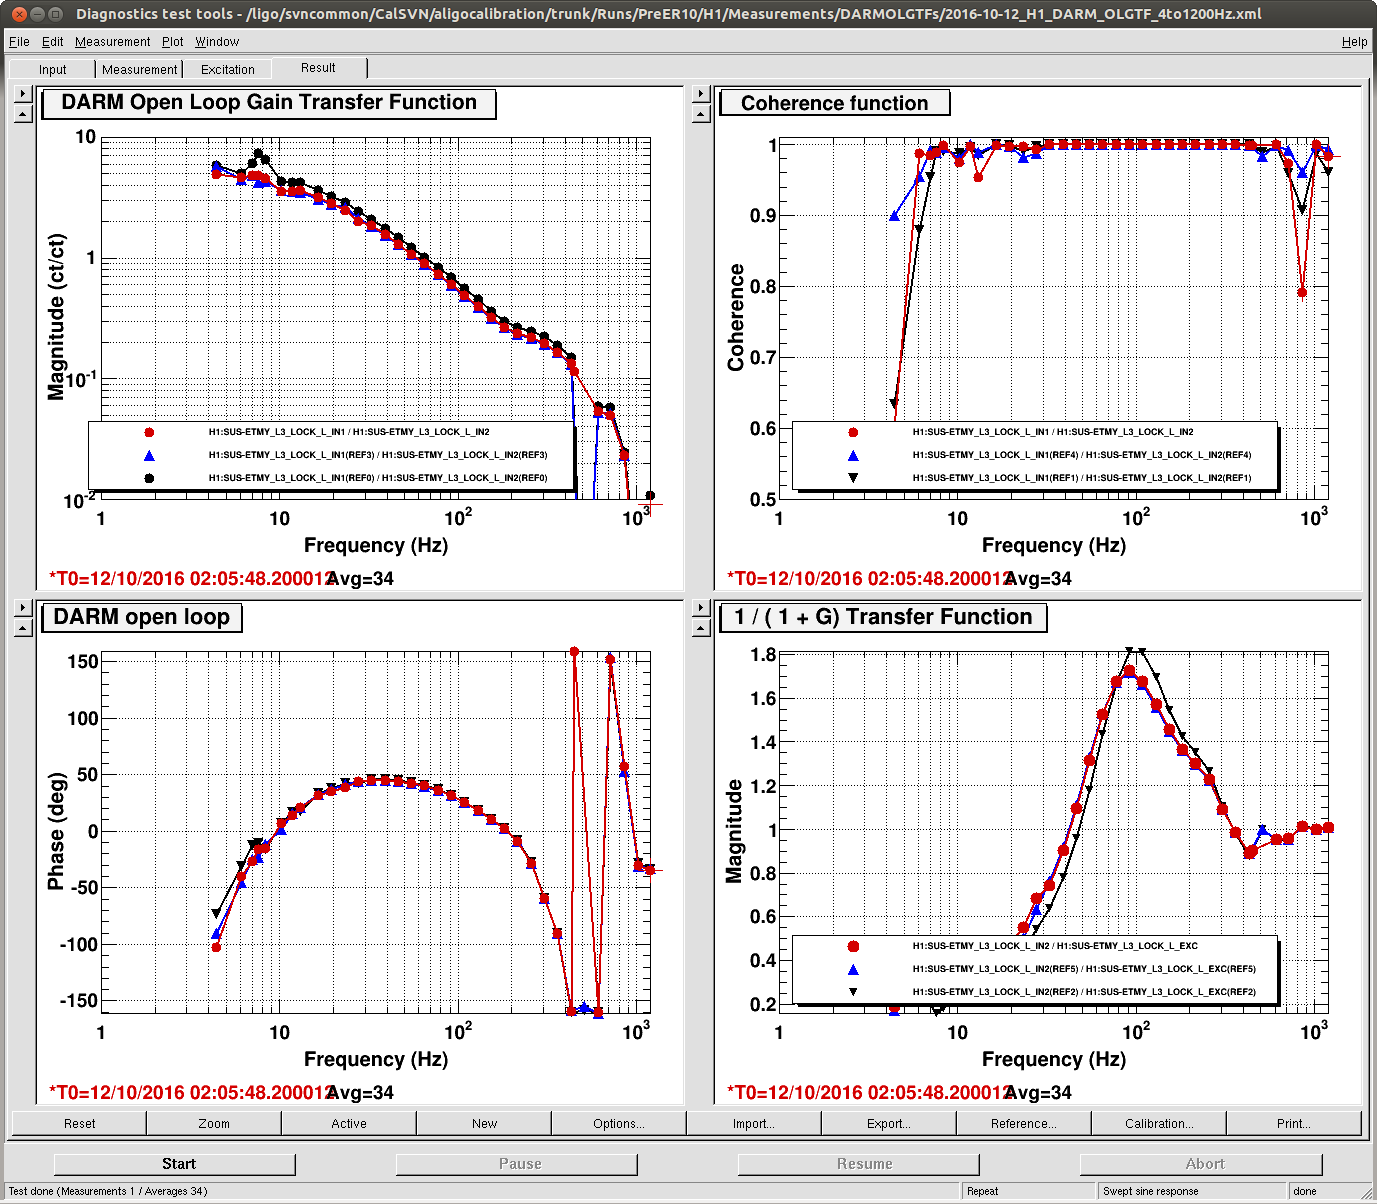
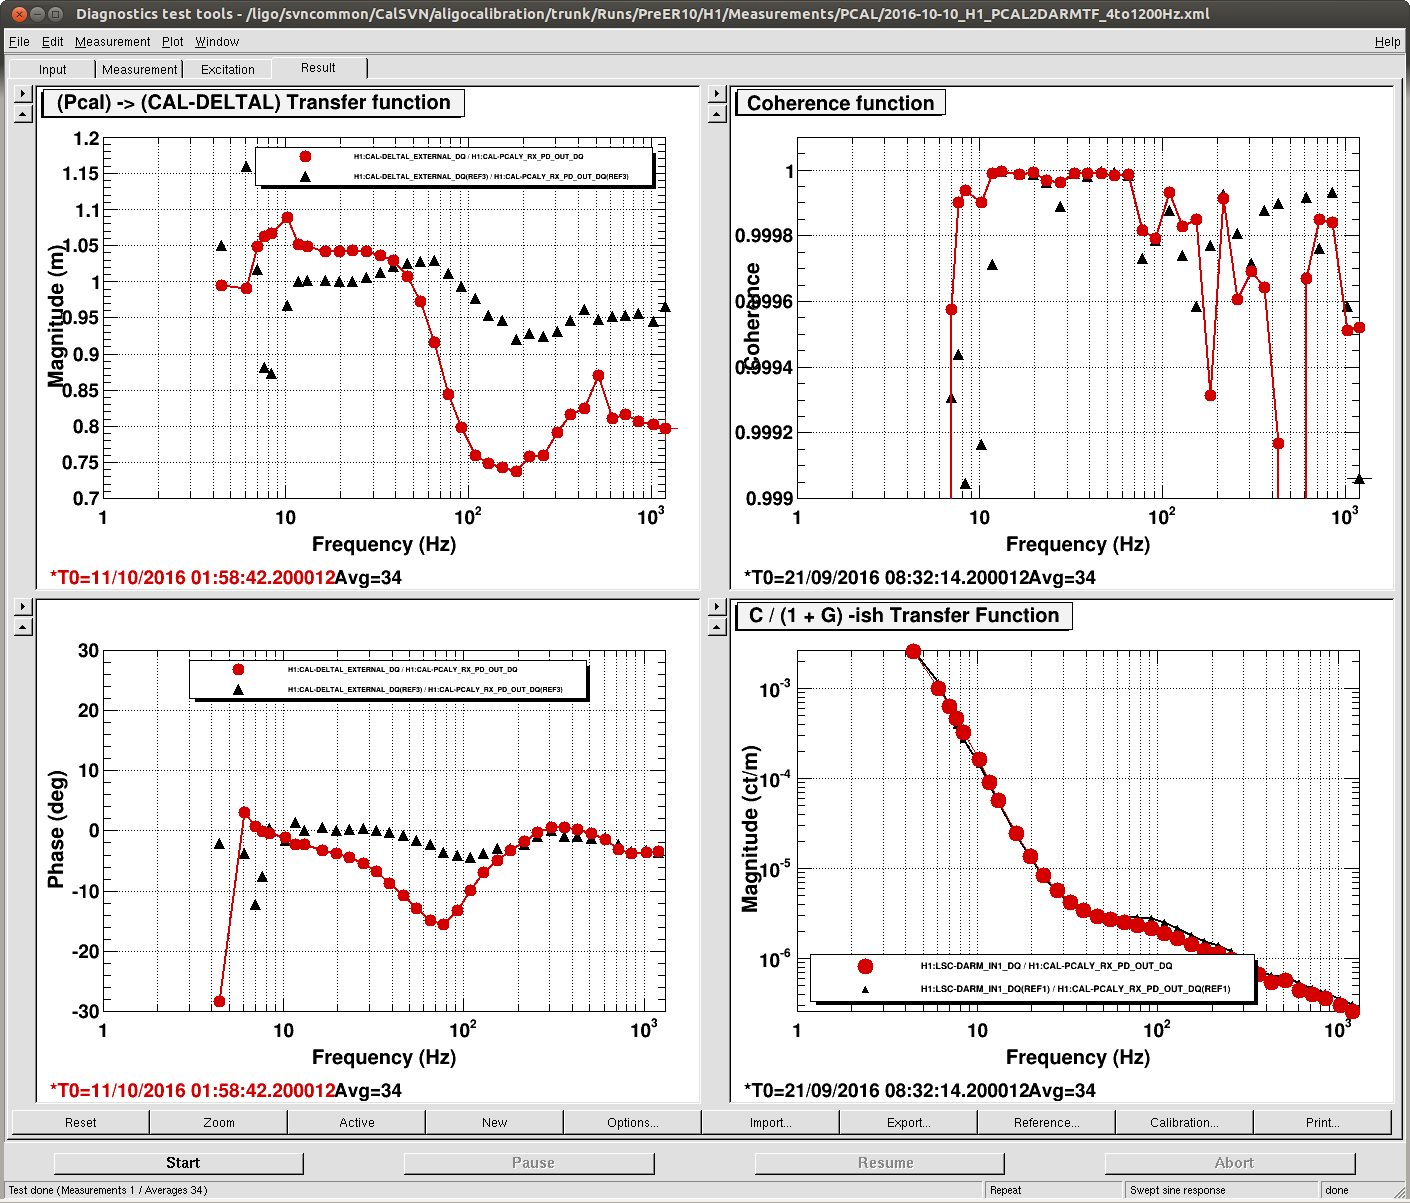
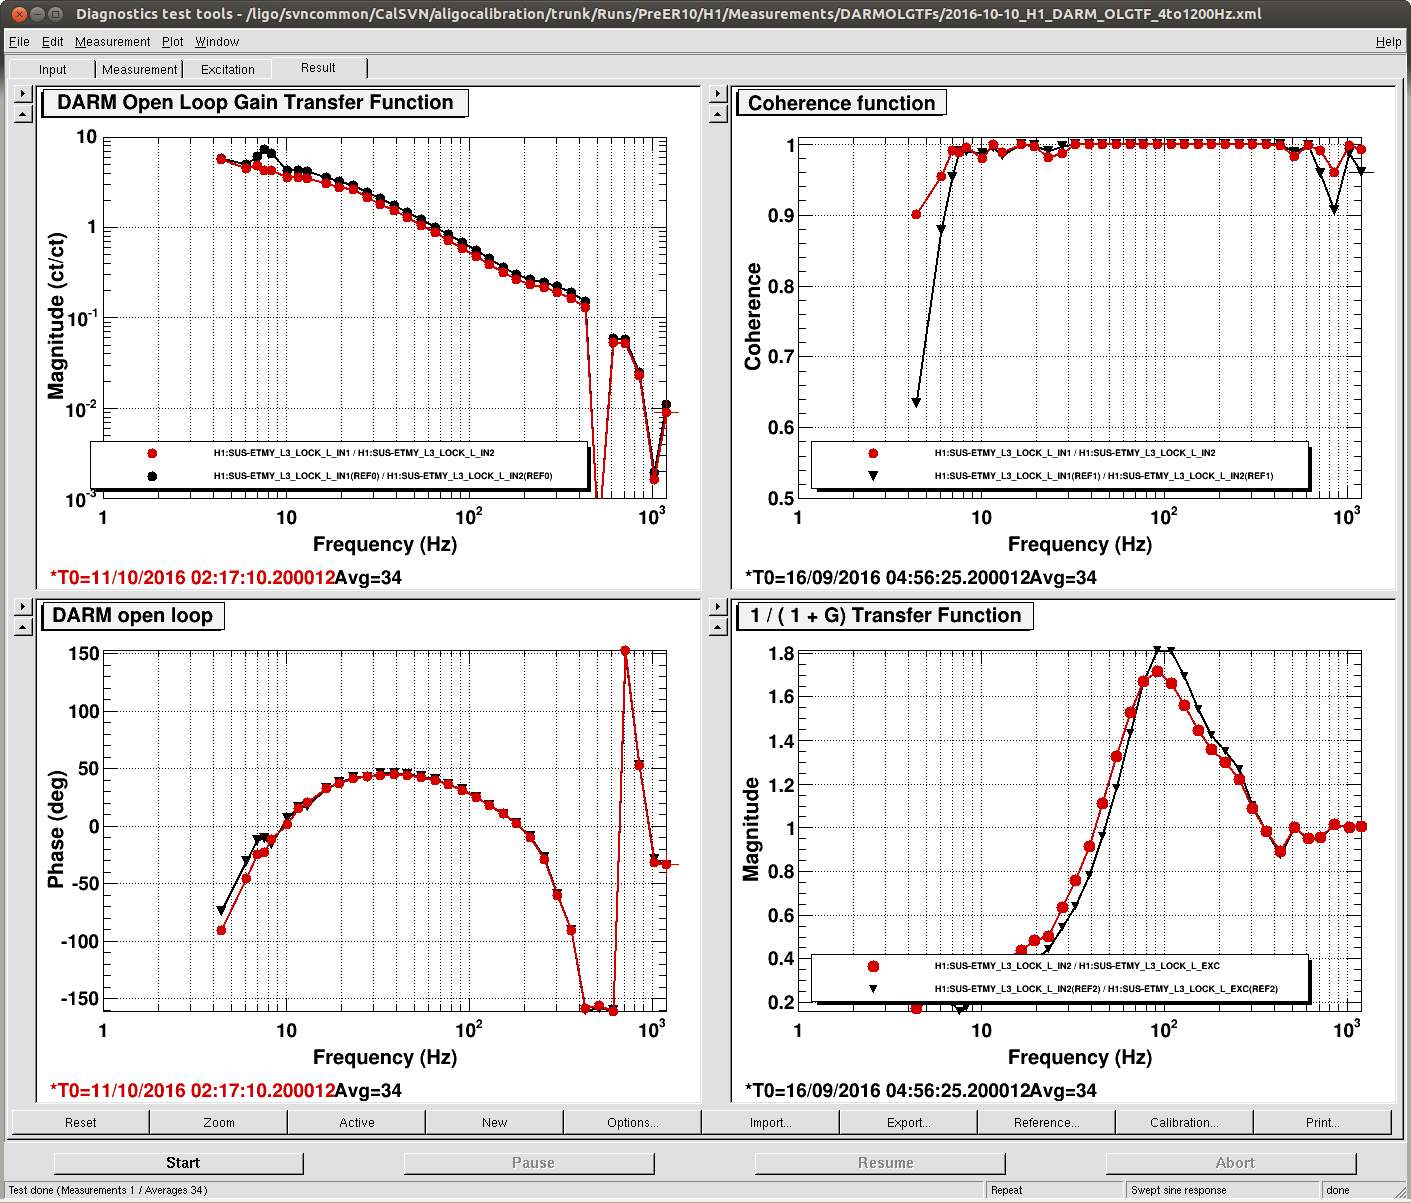
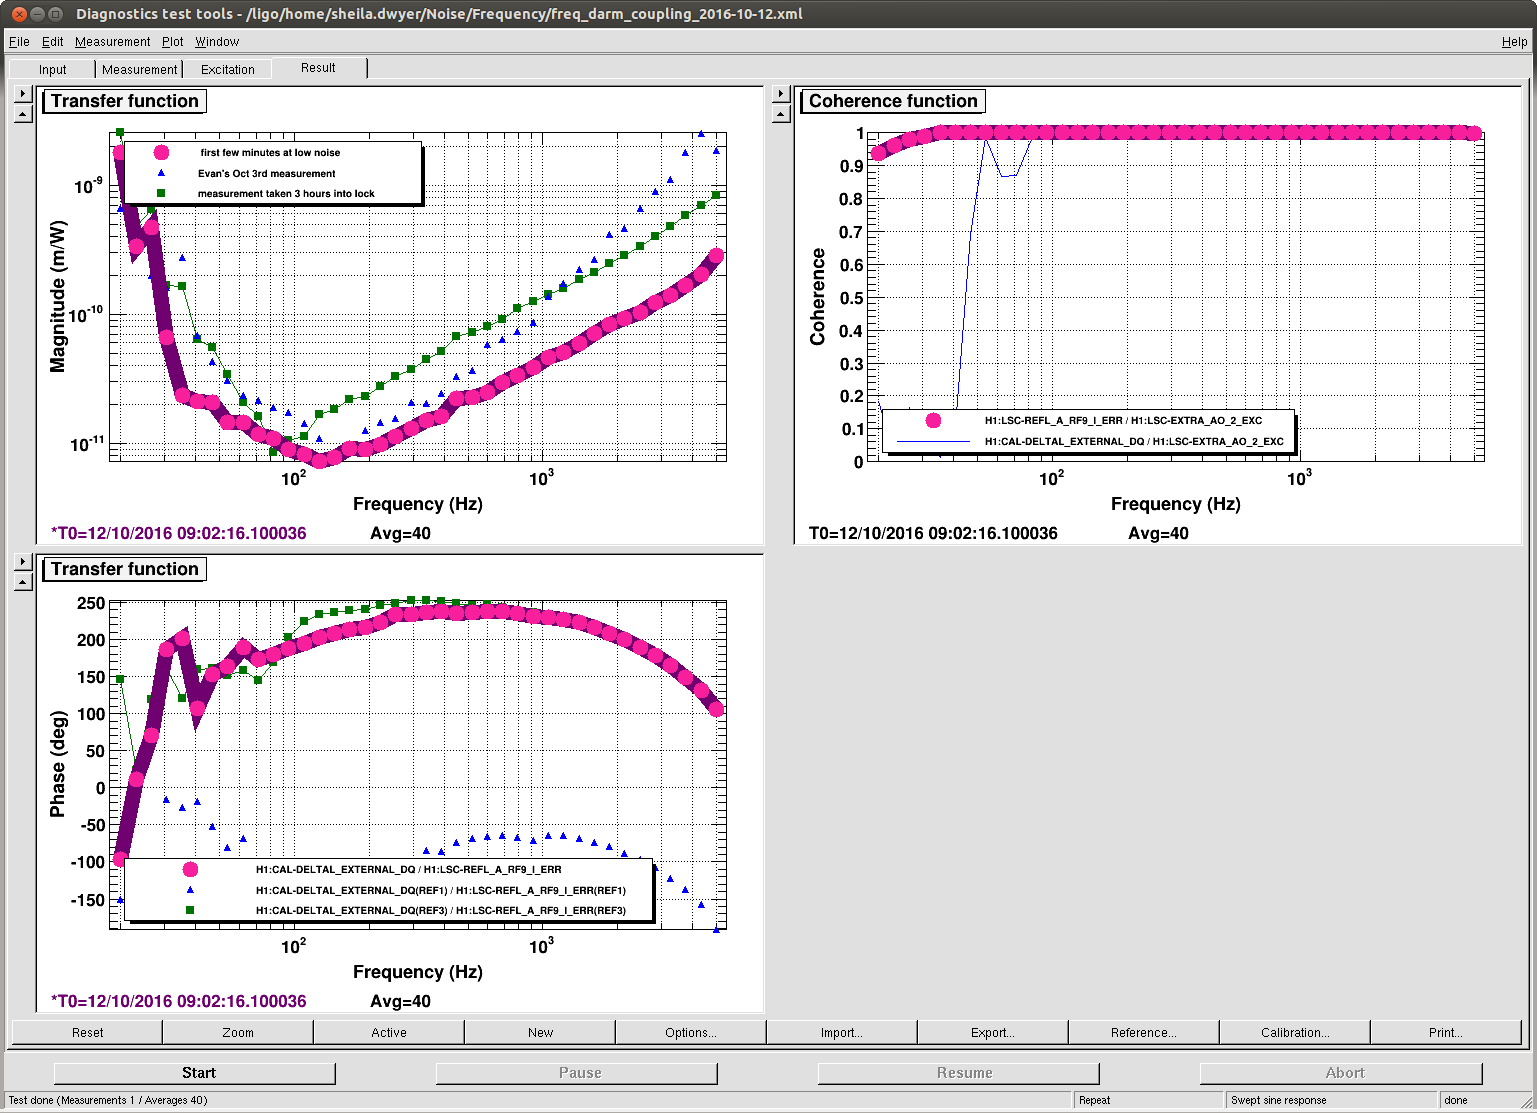
J. Kissel, J. Driggers

While Darkhan was improving the SNR of the CAL lines (see LHO aLOG 30476), I noticed that the reported value for the darm coupled cavity pole frequency, f_{cc} -- newly calculated in the front-end -- was at ~345 Hz, where for the past two nights it's been measured by both calibration line front-end calculation and sweeps to be ~325 Hz (see LHO aLOGs 30391 and 30431). Indeed, the result was repeatable over several lock stretches tonight.

I spoke with Jenne, and she mentioned that they've changed the POP A offsets (H1:ASC-POP_A_PIT_OFFSET and H1:ASC-POP_A_YAW_OFFSET, from 0.34 to 0.44 and 0.23 to 0.47, respectively) in order to push the improvement this has had on the power recycling gain even further. It worked -- and it apparently also had side benefits of increasing f_{cc}.

To confirm (so that we finally can just trust the front end calculation and not have to take the sweep every time), I took one more set of calibration sweeps; a PCAL2DARM transfer function to obtain C / (1 + G), and a DARM open loop gain transfer function to obtain IN1/IN2 = G and EXC/IN2 = (1+G). The ratio of these measurements ( C/(1+G) * (1+G)) gets us direct measurement of C alone.

Excellently, the sweep reveals that f_{c} has increased to 343 [Hz], the DARM optical gain went up, and there's even less SRC detuning. Sweet!

Unfortunately, I naturally inquired if we can go further with this POP OFFSET knob, but Jenne says further pushing doesn't seem to have any more effect. Looks like we've spun as much out of this knob as we can.

However, this does give me much greater confidence in the front-end calculations of f_{cc} and relative optical gain change, kappa_{C}.

Lots more details and changes to come on the model comparison (2016-10-13_H1DARM_SensingFunction_Comparison.png) but I show it just so you can get a good feel for the changes. Note that the reference model (based on September measurements) are compensated for by the kappa_{C} and f_{cc} value take just after each sweep as measured by the calibration line. Also note that the comparisons use time delays from ER9, which -- while they make the sensing function and DARM open loop gain TF measurements match the model -- don't make sense with other timing measurements (LHO aLOG 29259).

Details:
Templates for sweeps line here:
/ligo/svncommon/CalSVN/aligocalibration/trunk/Runs/PreER10/H1/Measurements
DARMOLGTFs/2016-10-13_H1_DARM_OLGTF_4to1200Hz_fasttemplate.xml
PCAL/2016-10-13_H1_PCAL2DARMTF_4to1200Hz_fasttemplate.xml
Note that these templates measure significantly faster because I've reduced the number of points, and reduced the cycle/measurement time per frequency point. Delightfully, I can still get great coherence down to 10 Hz for both templates. However, if we want to stay well-informed of SRC detuning, we should probably re-up the DARM OLG TF measurement/cycle time to regain great coherence.

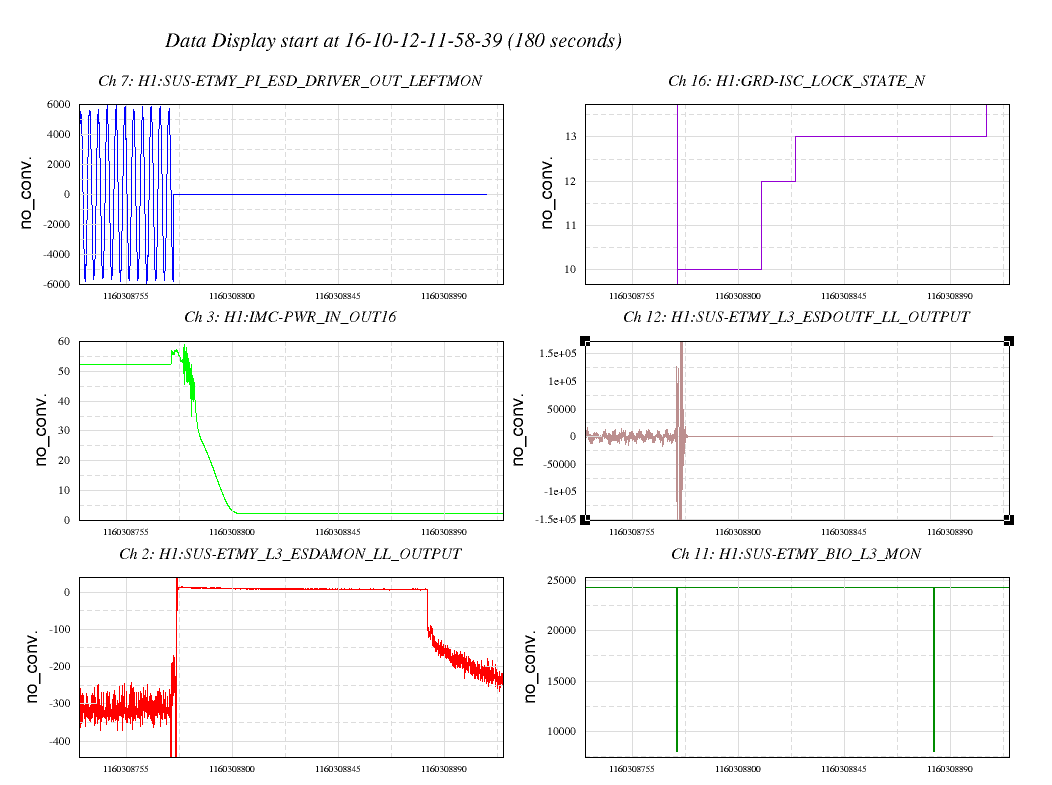
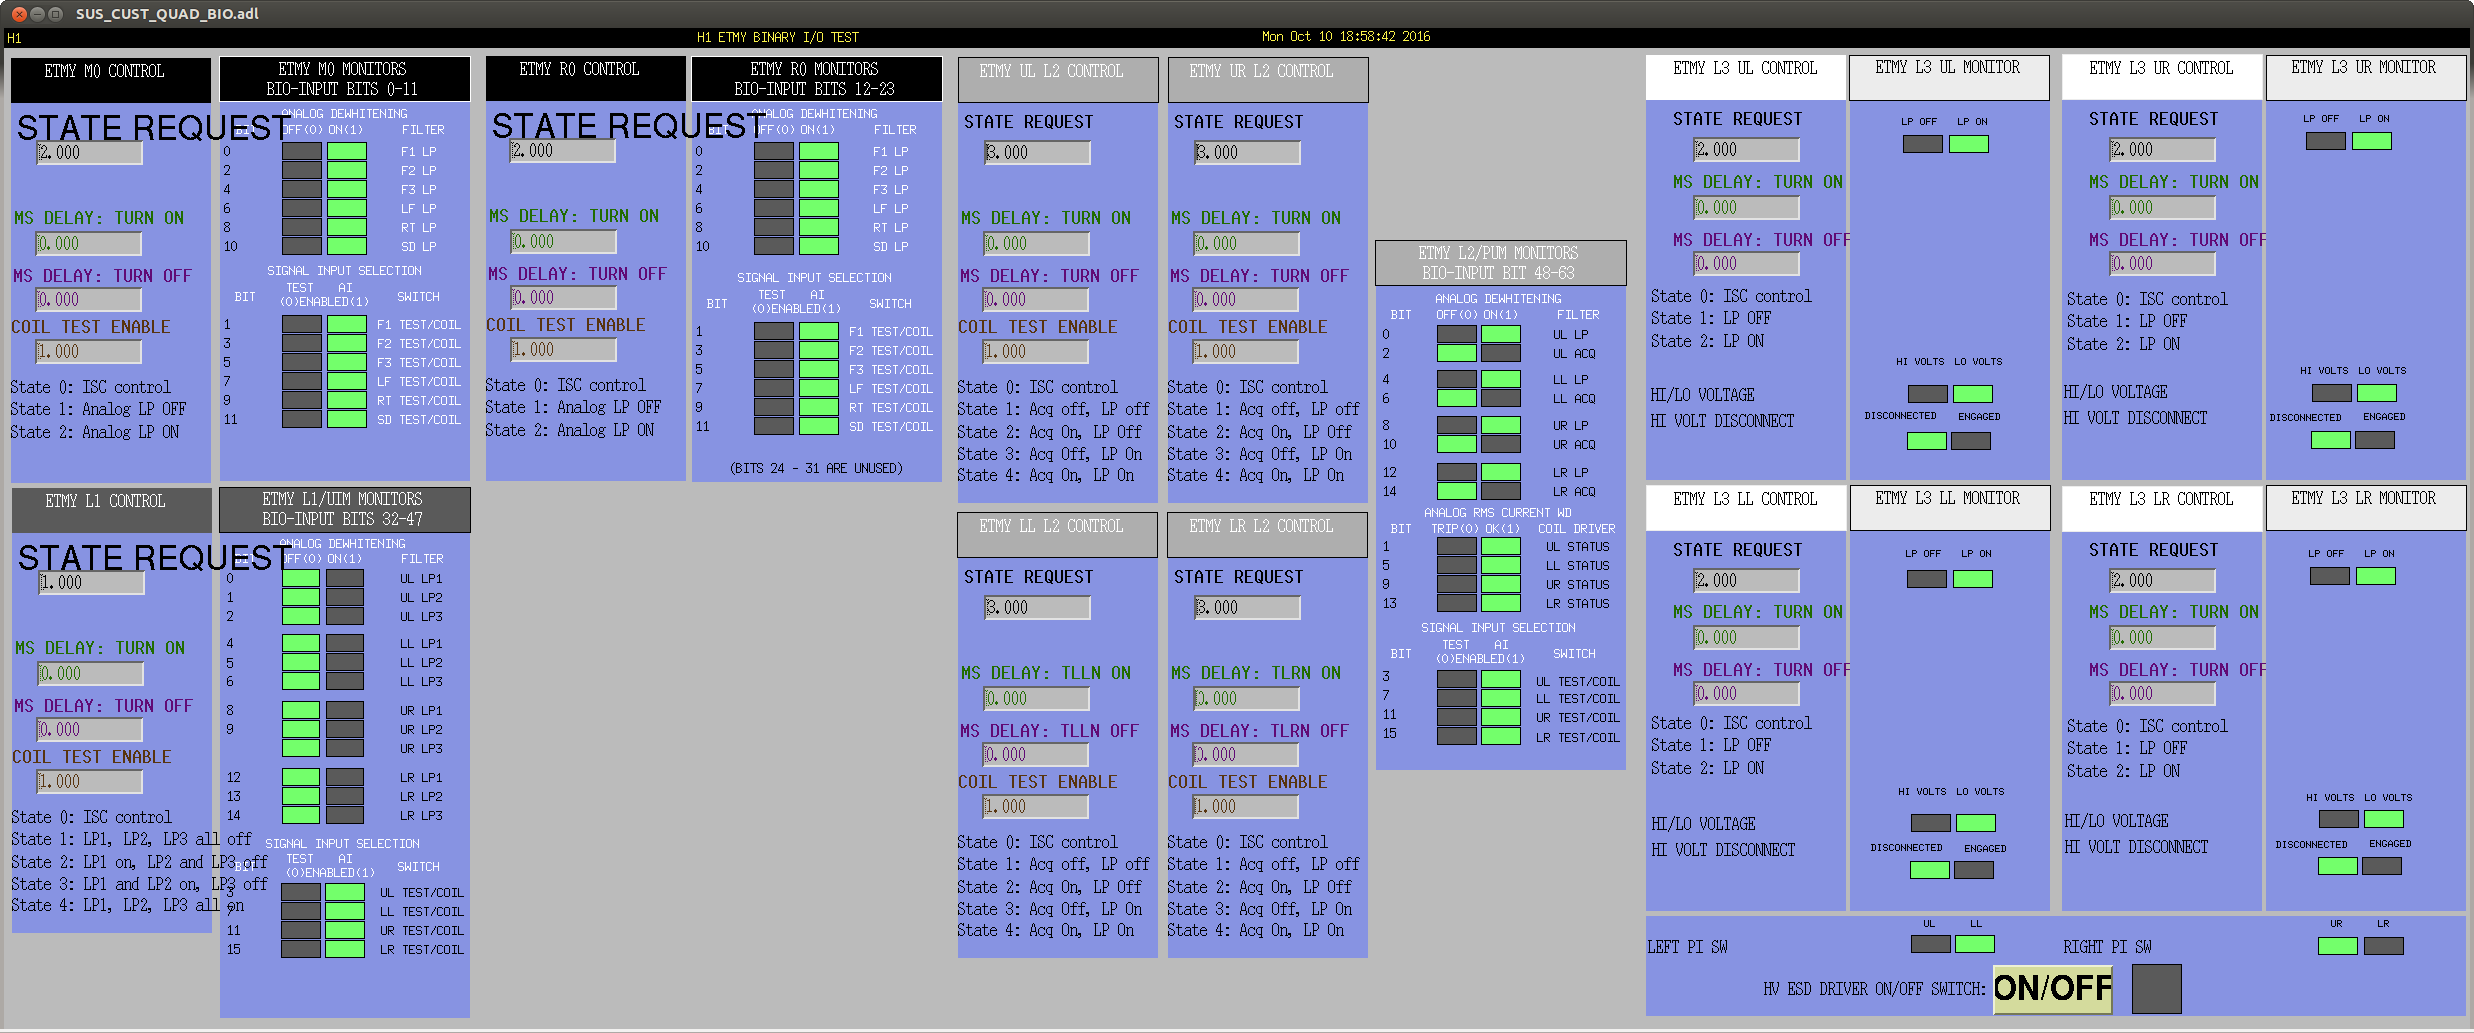
Trends for the ETMY ESD which switched off at 11:59 UTC this morning after being sent a large drive signal and immediately broke lock. Off and on switching is seen in ETMY_BIO_L3_MON and drive spike in ETMY_L3_ESDOUTF (LL quad only shown, but its seen in all). DIAG_MAIN reported driver off; it watches an ETMY HV ESDAMON DC_IN monitor. Seems to have turned back on 2 minutes later during LOCKING_ALS. Drive spike was not pushed through PI drive. PI Mode26 damping troubles were unrelated (discussed in later log).
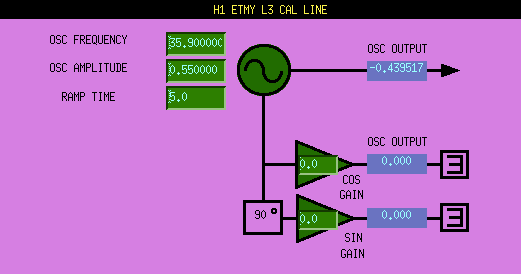
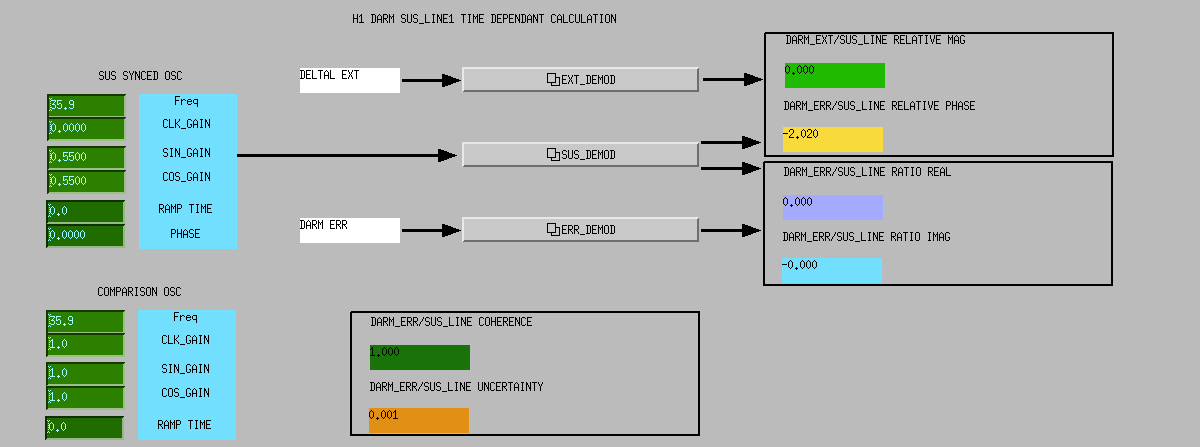
J. Kissel, K. Izumi, D. Tuyenbayev,
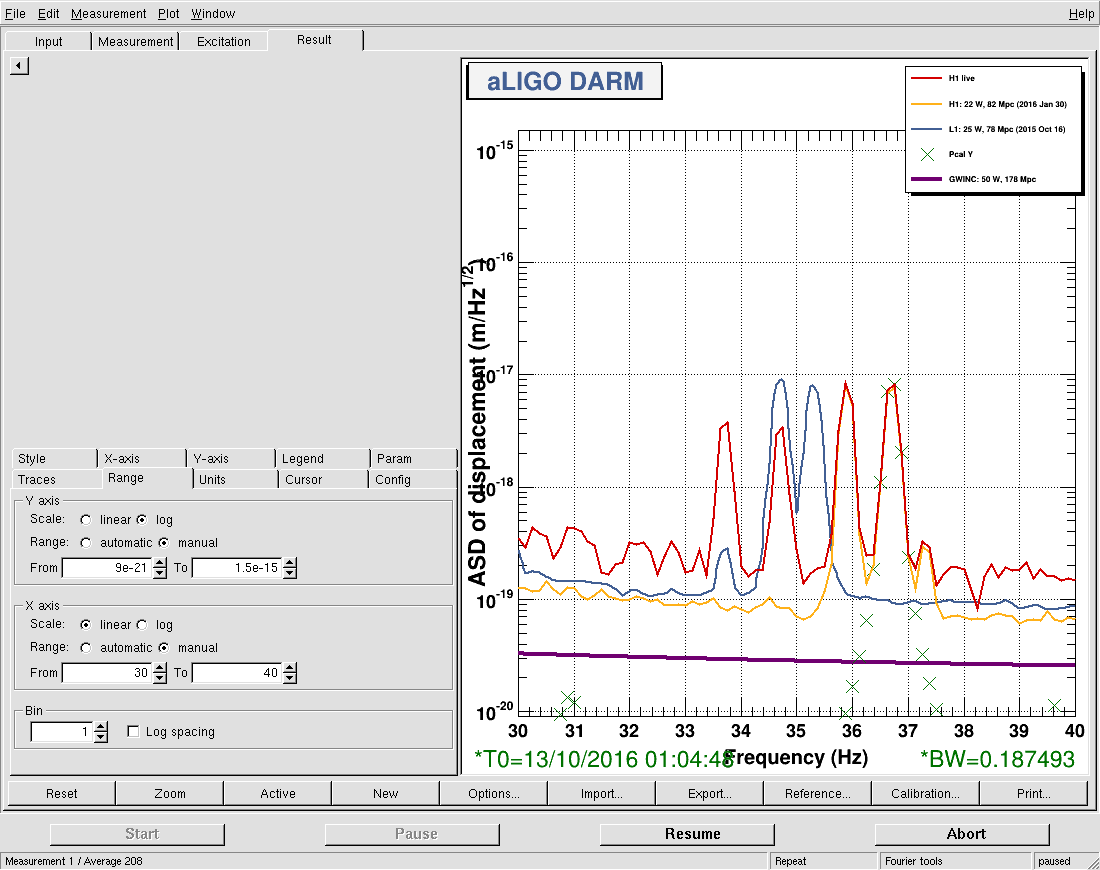
Since the noise floor of the IFO is currently higher compared to O1 levels (see attachment 1) the SNR of the calibrations lines are not sufficient to resolve the DARM time-dependent parameters with an under 1% uncertainty. We have increased the calibration line amplitudes.
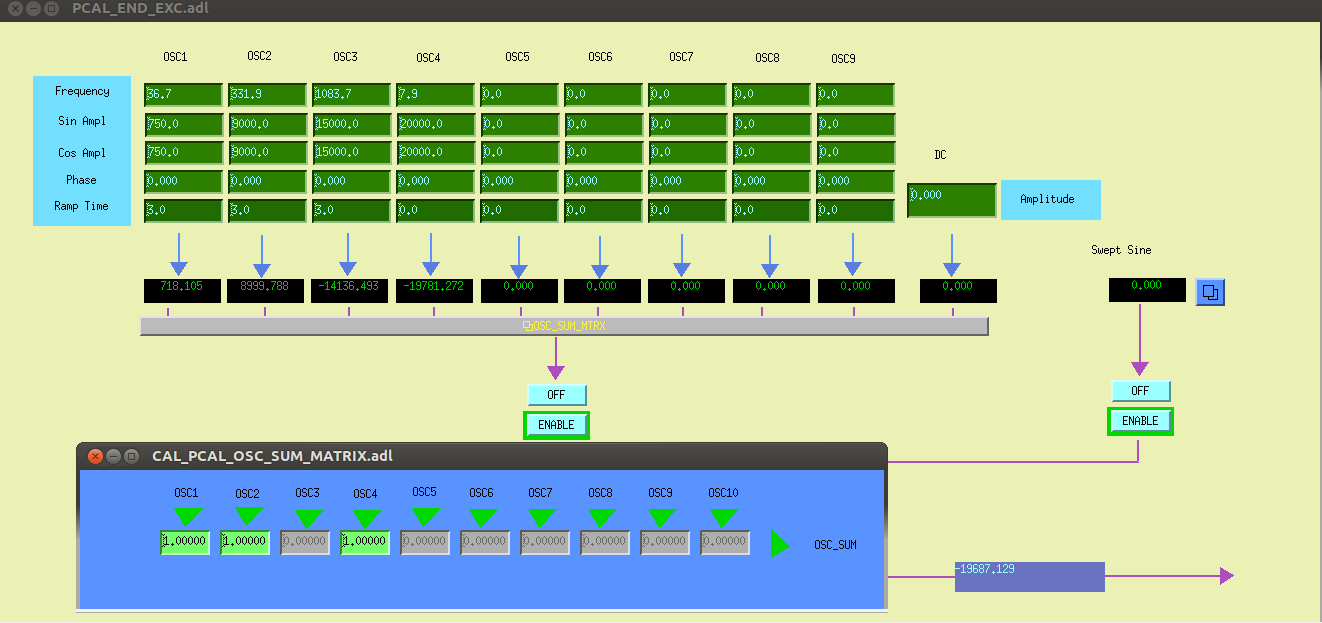
37.3 Hz x_ctrl, 35.9 Hz ESD and 36.7 Hz Pcal line amplitudes were increased by a factor of 5; and the 331.9 Hz Pcal line amplitude was increased by a factor of 3. To ensure that PcalY have enough drive range, we switched off the 1kHz line (the 7.9 Hz line which is using a major part of the drive range is still running).
Laser Status: SysStat is good
Front End Power is 34.78W (should be around 30 W)
Front End Watch is GREEN
HPO Watch is GREEN
PMC: It has been locked 0.0 days, 2.0 hr 12.0 minutes (should be days/weeks)
Reflected power is 34.32Watts and PowerSum = 135.1Watts.
FSS: It has been locked for 0.0 days 1.0 hr and 27.0 min (should be days/weeks)
TPD[V] = 3.682V (min 0.9V)
ISS: The diffracted power is around 4.339% (should be 5-9%)
Last saturation event was 0.0 days 1.0 hours and 27.0 minutes ago (should be days/weeks)
Possible Issues:
Dave, Kiwamu, Nutsinee
--------------------------------------------------------------------------------------------------------
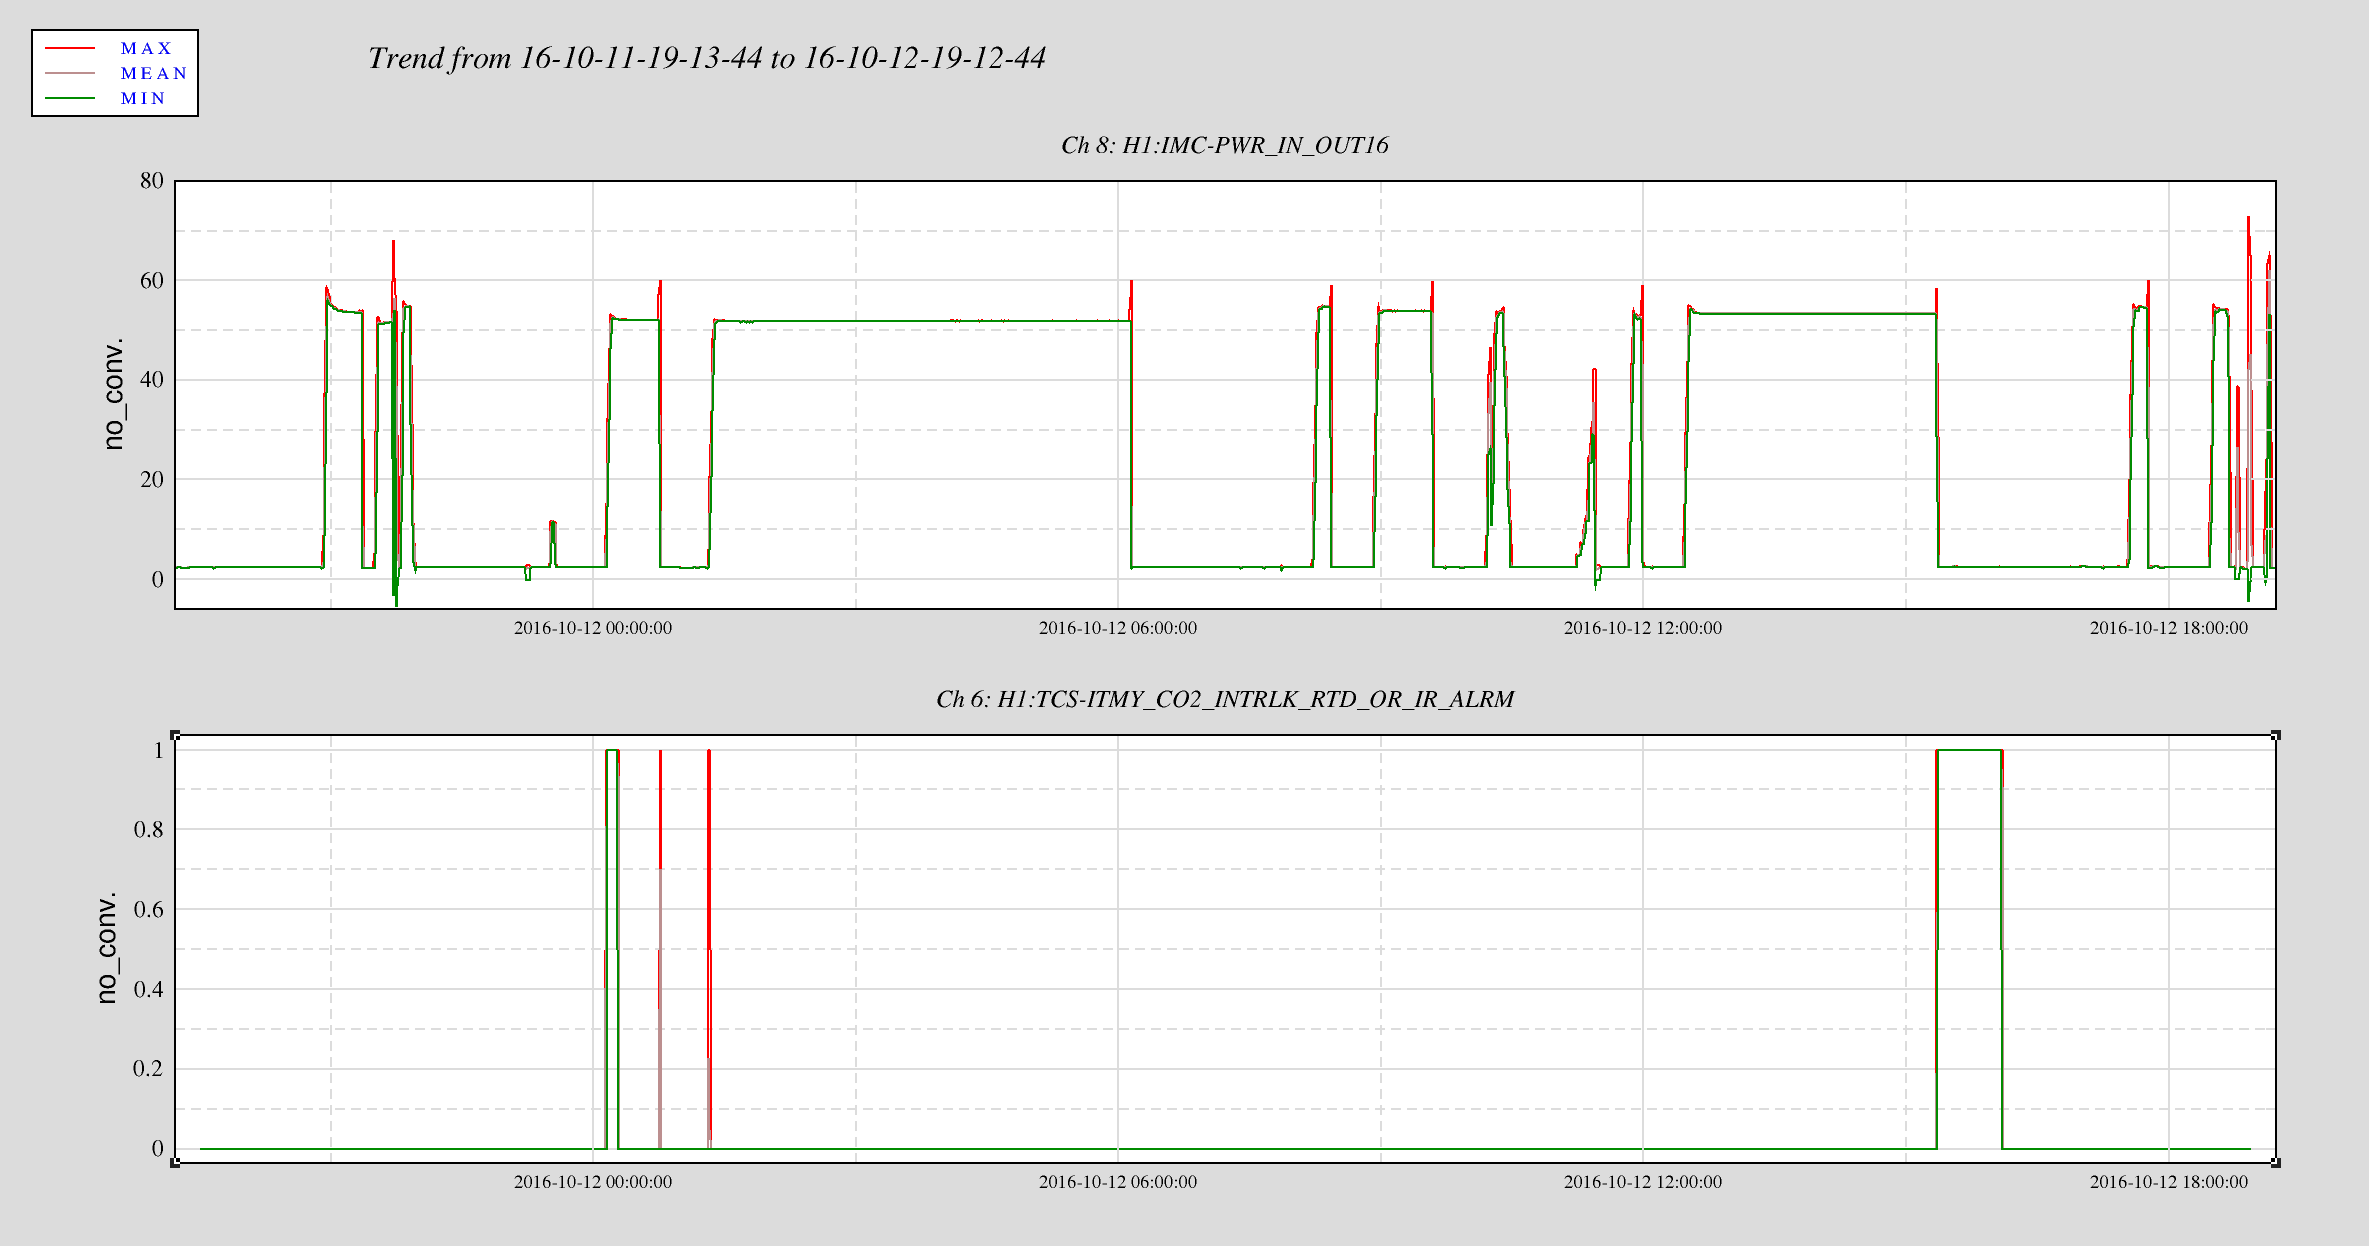
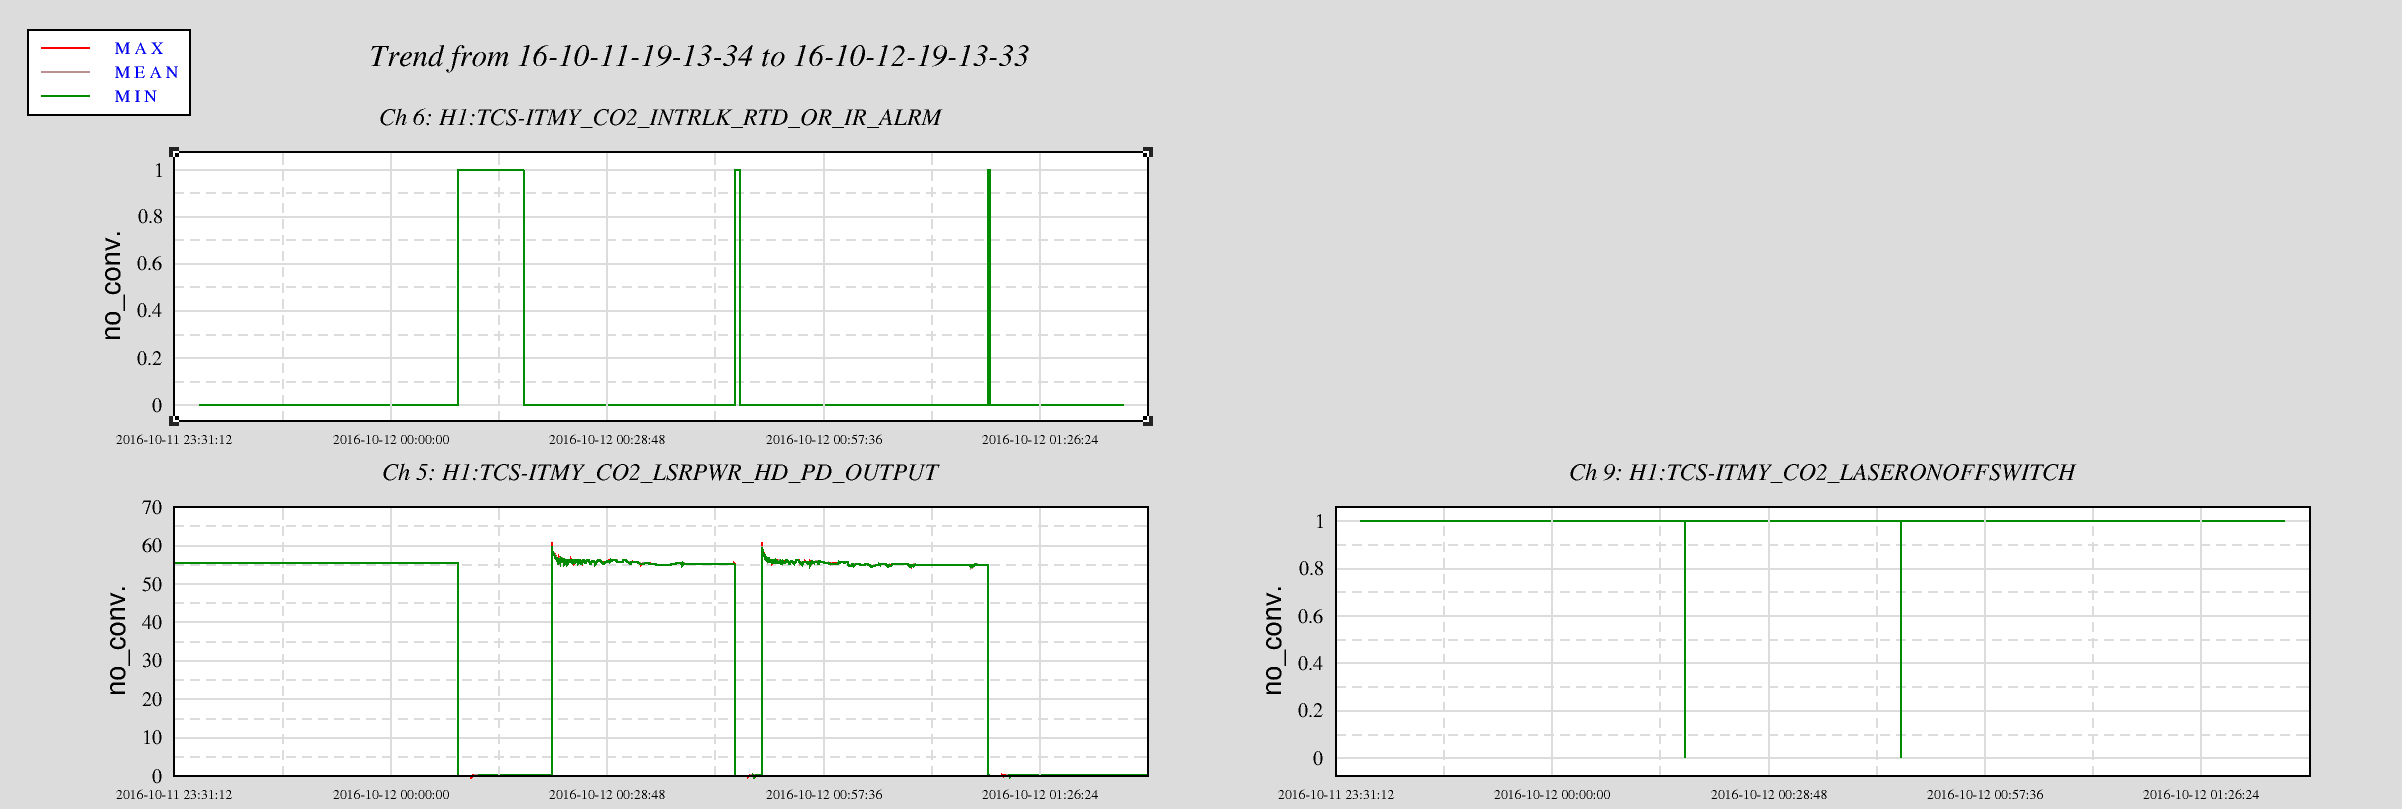
Quick conclusion: It's probably related to the CO2Y rotation stage.
Lengthy details: Dave notcied TCSY chiller DAC output went crazy yesterday. After making sure that it wasn't the model update (alog30429, alog30384) that did it we investigated further. The crazy output to the chiller was due to TCS guardian trying to lock the laser when there were no laser (as the result the guadian keeps increasing and decrasing chiller temperature by about 1 deg C).
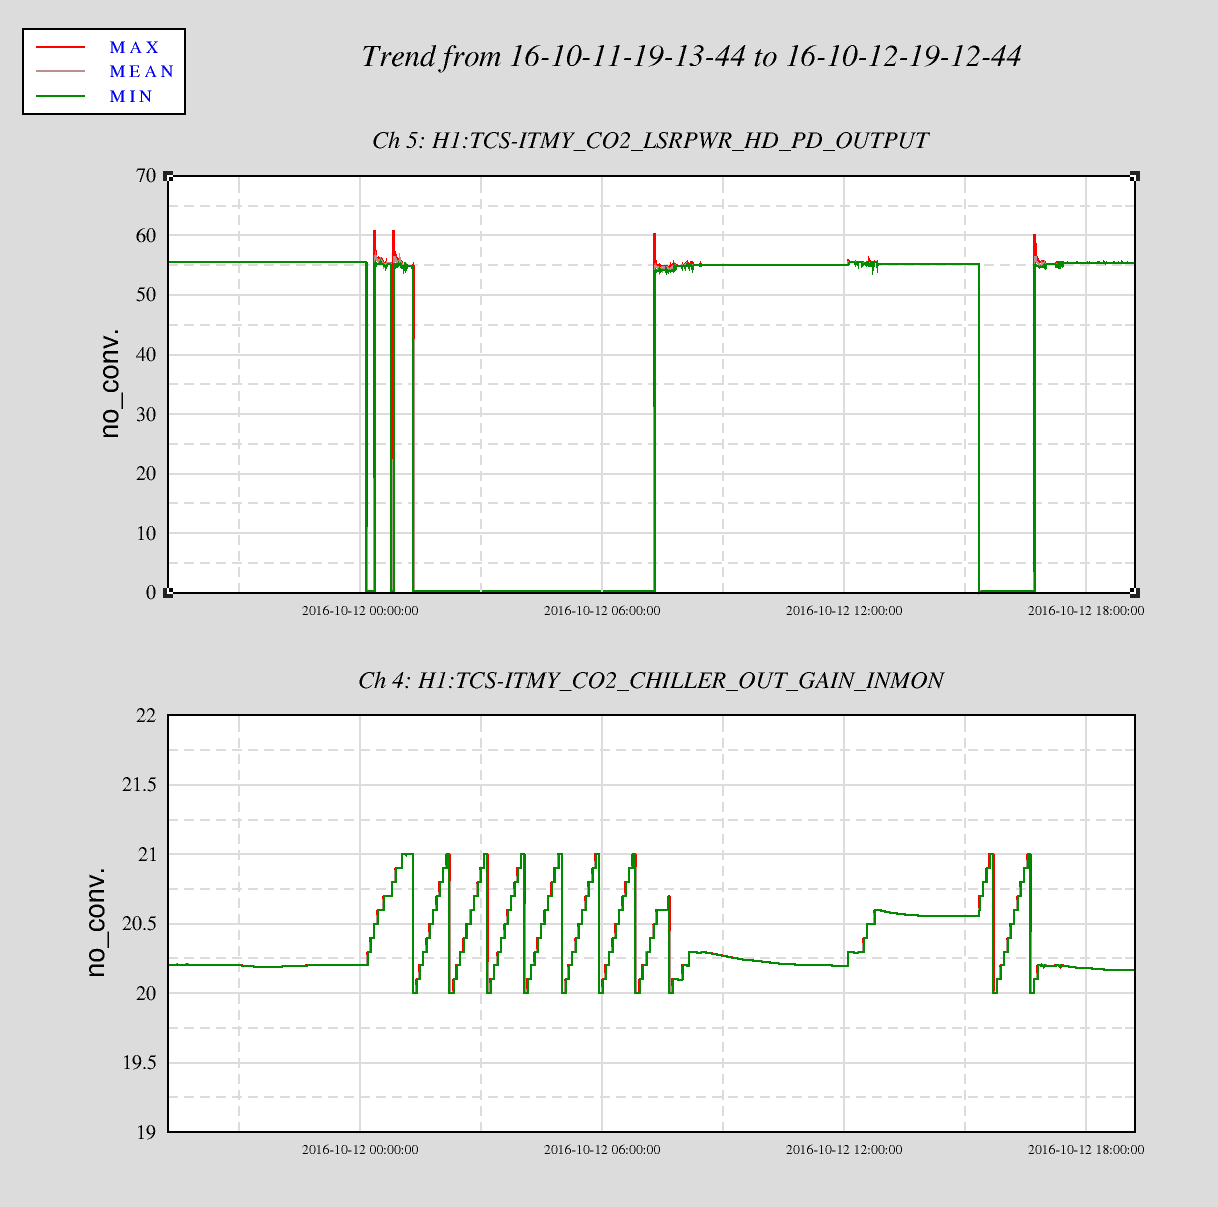
The cause of CO2 laser trips was due to RTD/IR ALARM interlock tripped, which always coincide with either power-up state and lockloss state. Although not every power-up or locklosses caused CO2Y to trip. We also looked at POP but it's not showing here.
This immediately made us think of the CO2Y rotation stage that would only move during these times. Could this be either Beckhoff or electronics issue? The fact that it actually tripped the interlock box made me think of grounding issue. But I always blame grounding.
Also Kiwamu was able to untrip the RTD/IR interlock and get the CO2 into "ready" state just by toggling LASER ON/OFF button. This is what we don't understand. How is this even possible?
The End.
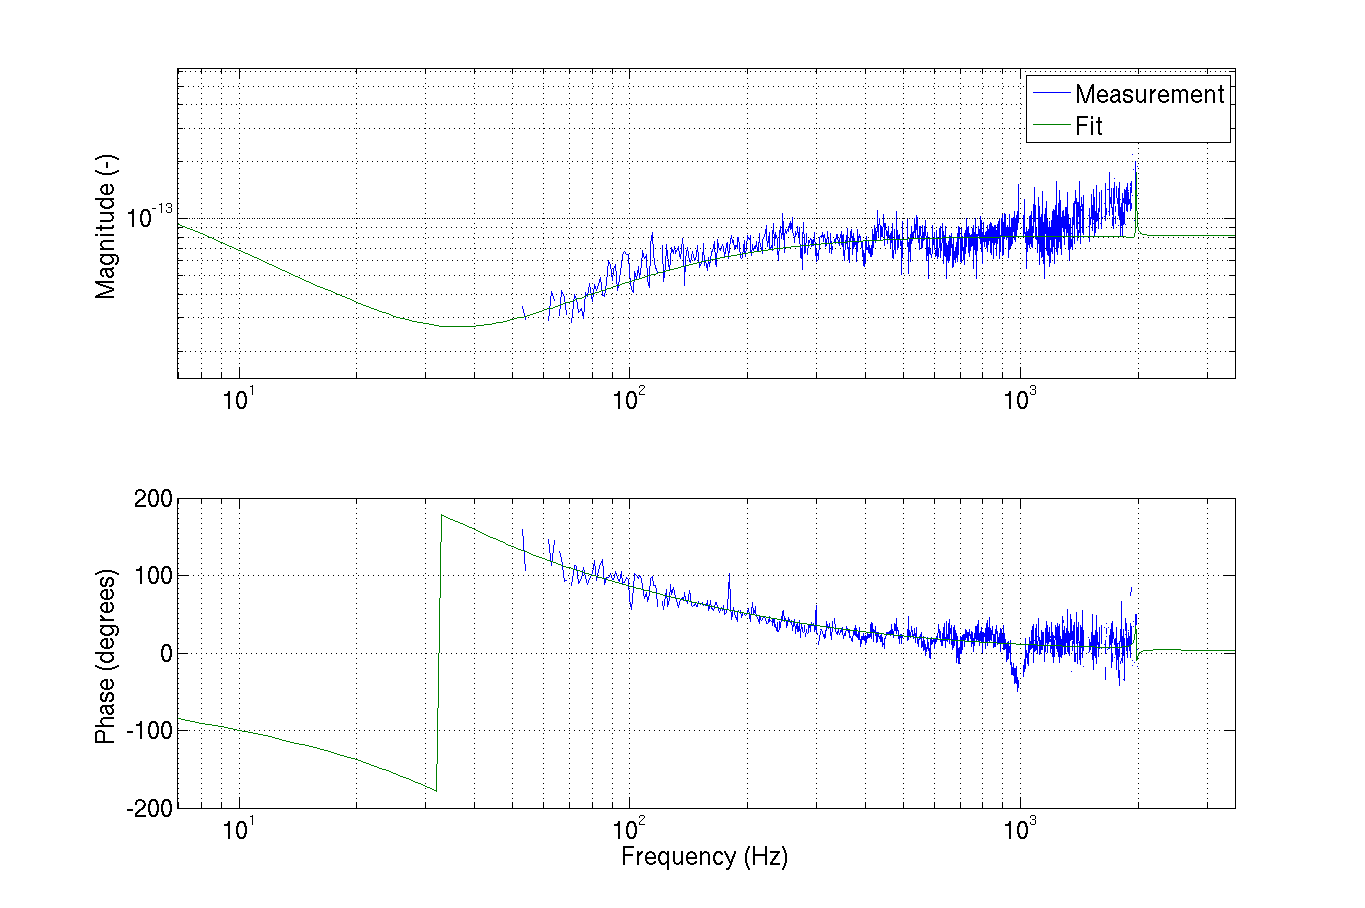
Tried the new feedforward path, adding the DBB Q1Y signal to the DARM IN1 signal. It's working.
First, I measured the transfer function from Q1Y to DARM (no noise injection), and fitted it. The result is shown in the first figure (I removed from the fit the 2kHz sharp feature which is clearly a misfit artifact). The filter is implemented in the LSC-JITTERFF bank.
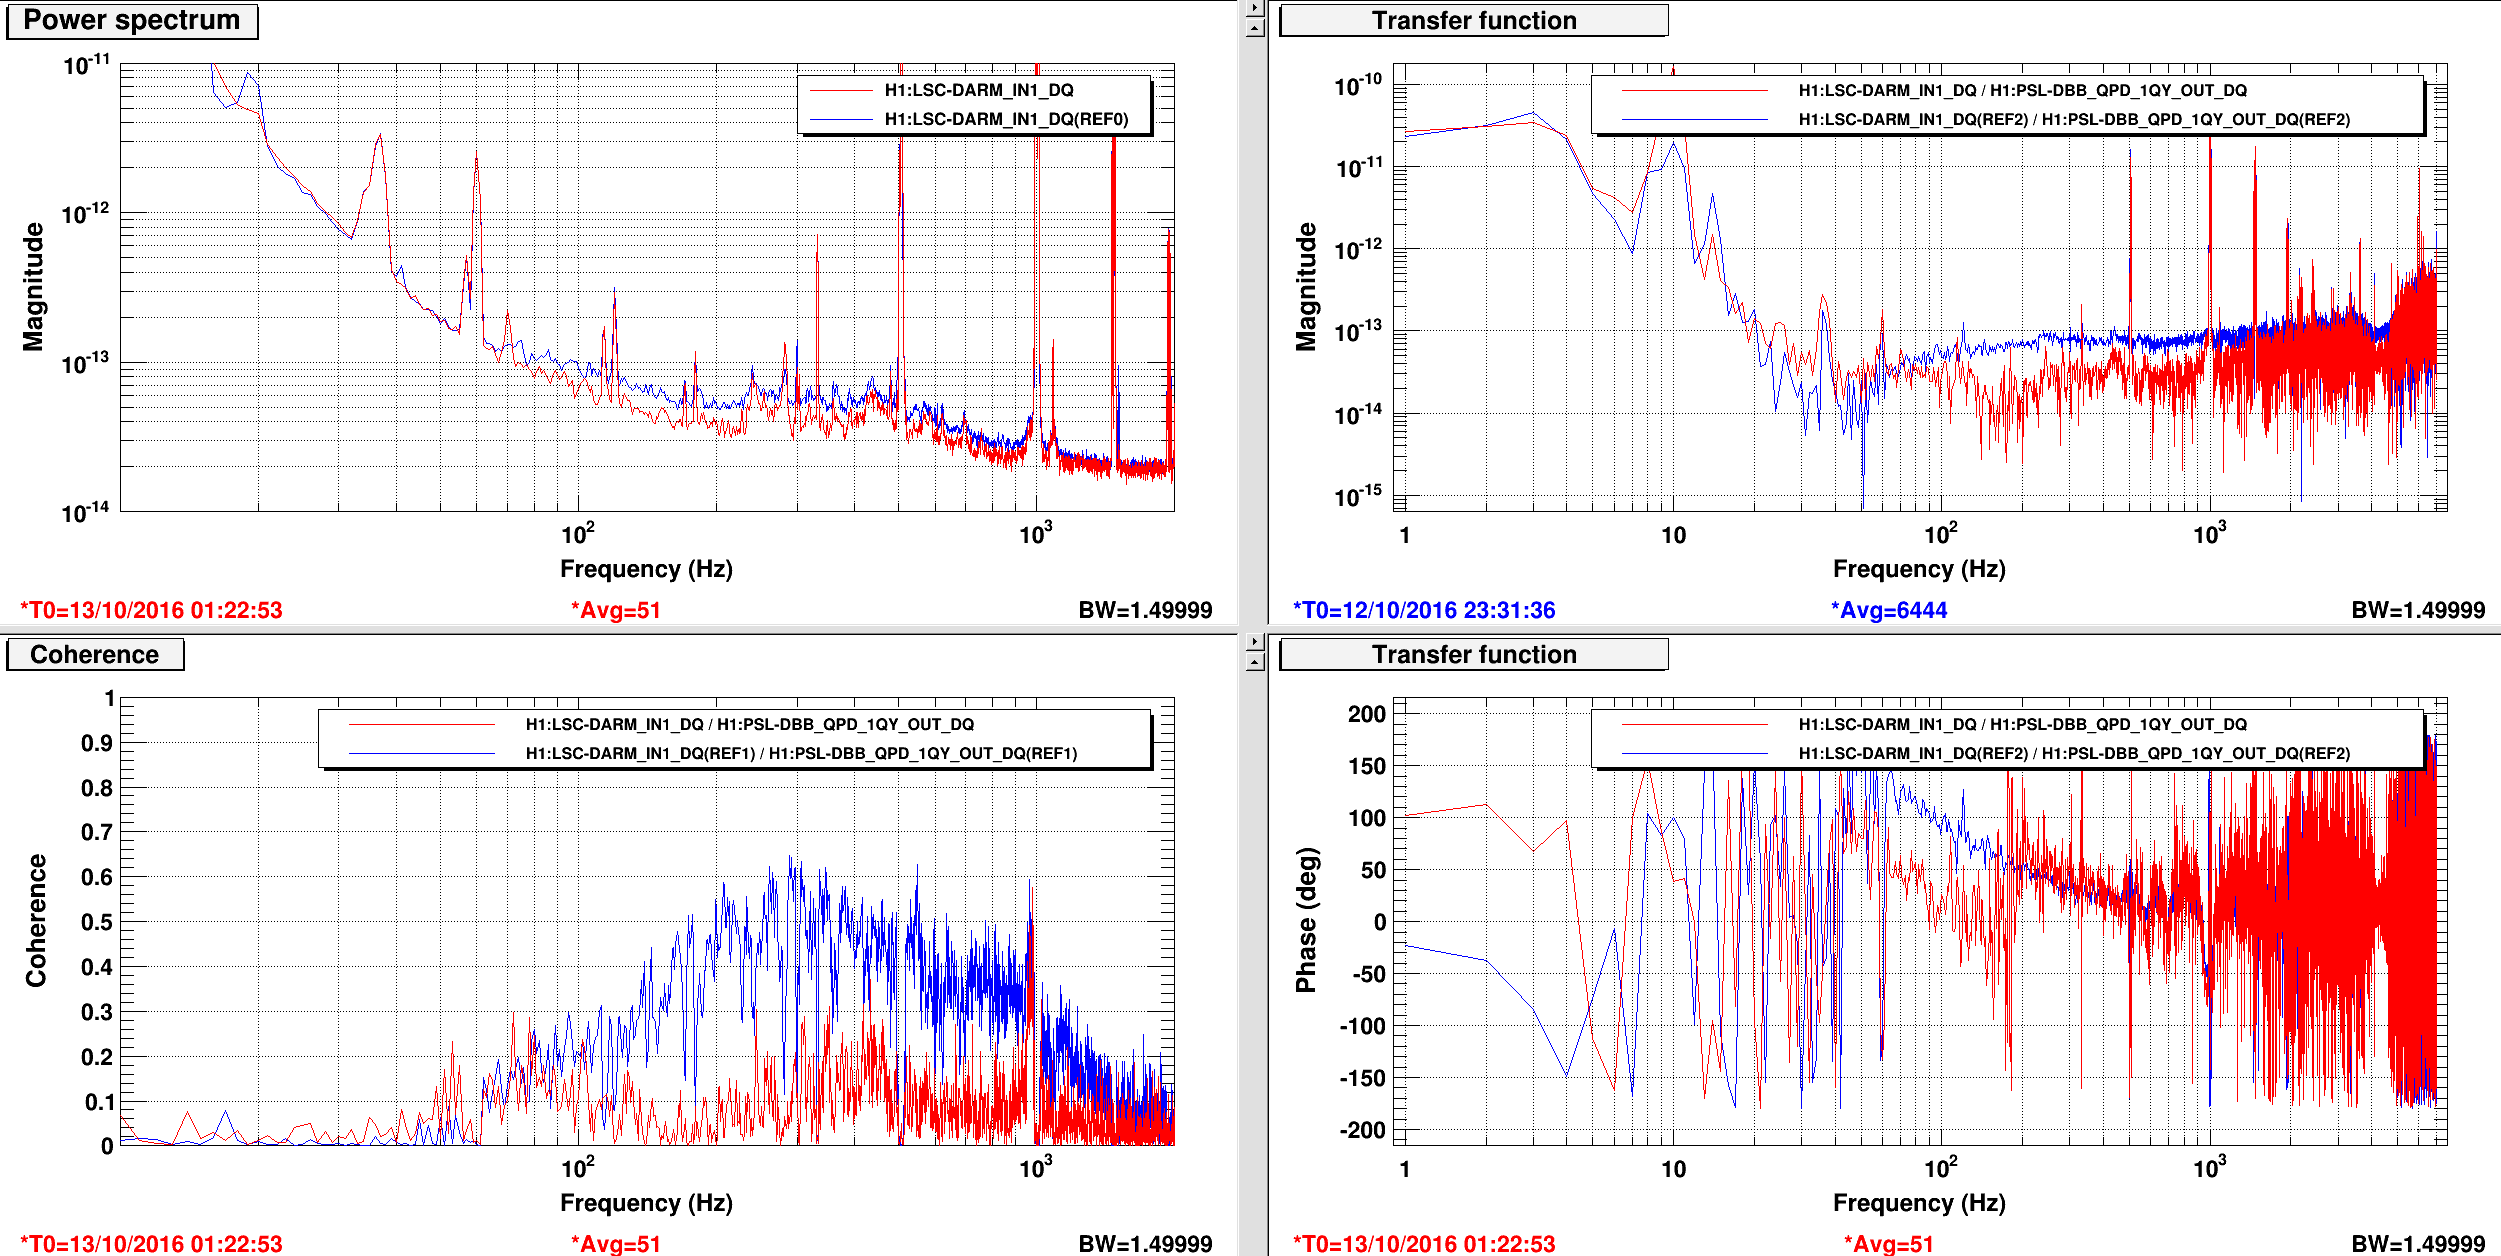
The second plot shows the improvement in the DARM signal and the reduction of coherence whe the feedforward is on (blue reference with FF off, red with FF on). All the peaks remaining in the DARM signal are not due to the HPO jitter.
We shall see how stable this is over time.
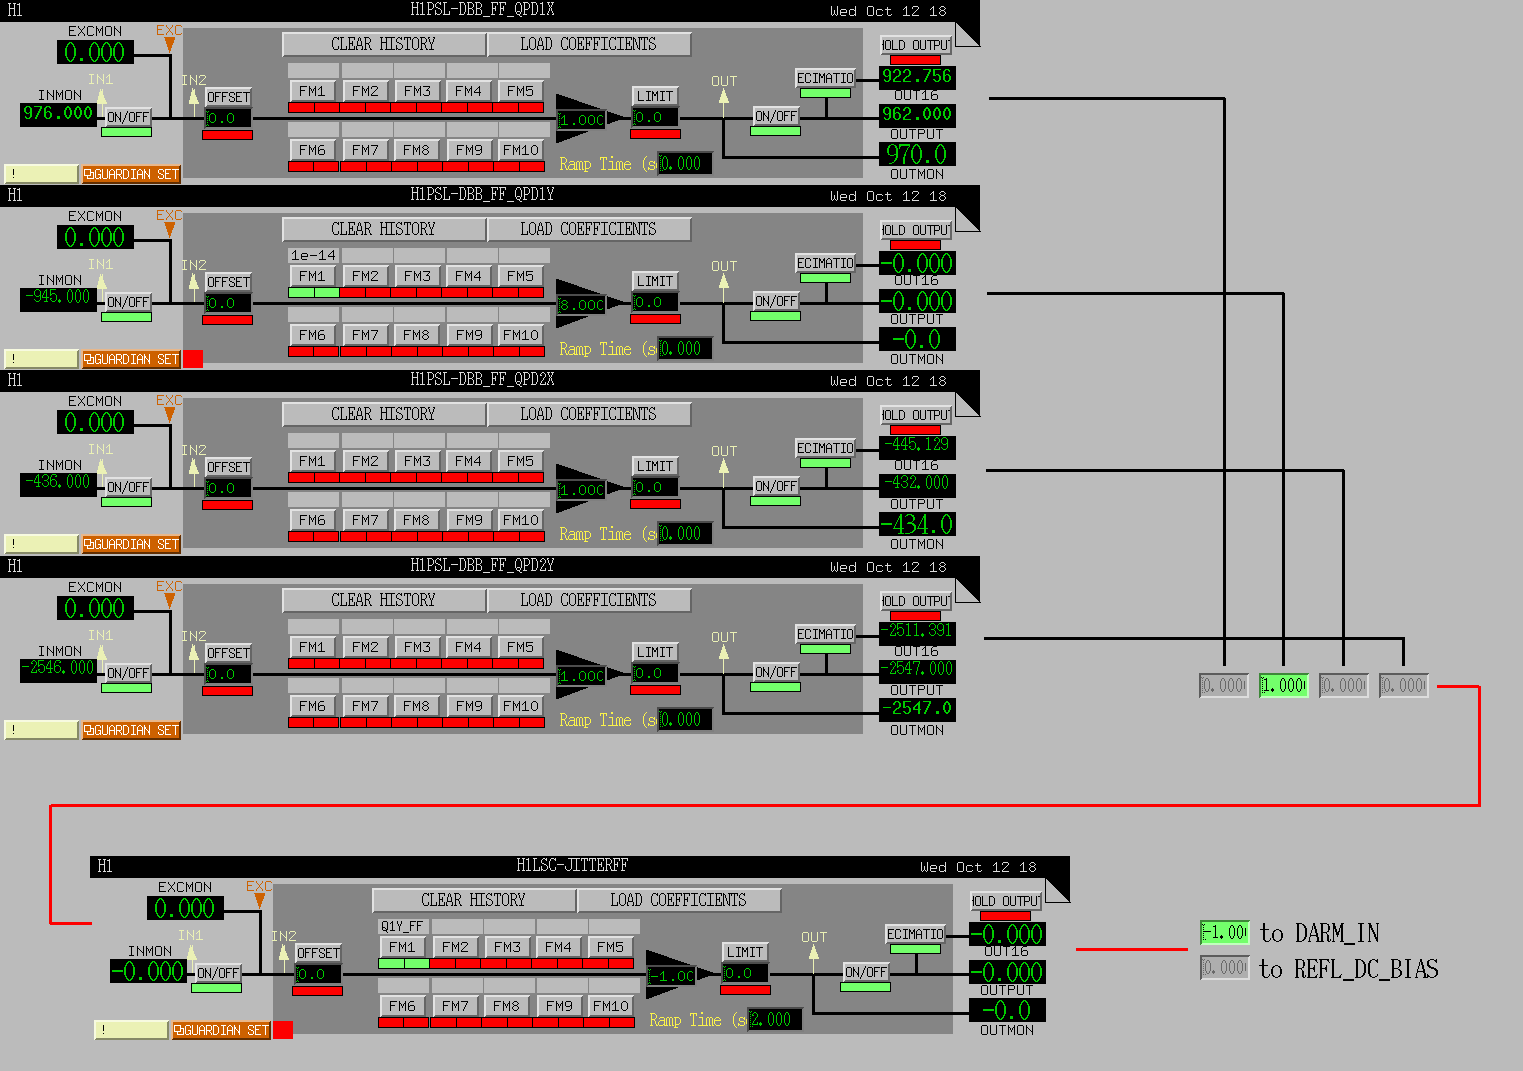
A temporary MEDM screen for the jitter feedforward can be found here
/opt/rtcds/userapps/release/isc/h1/medm/JITTER_DBB_FF.adl
It's been linked to the LSC menu in the sitemap.
The model modifications are described in 30412.
On Tuesday 11th October we installed the ITMX and ETMX hardware watchdog chassis (HWWD) in monitor mode, which completes the install of the four HWWD chassis.
Previously we had found that the ITMY HWWD reported LED-current-monitor undervoltages which were not been seen on ETMY. In the past 24 hours we have now seen similar events on ITMX, which suggests the longer cabling to the ITM systems may be a factor.
For the past 20 hours, I plotted the ITMX HWWD LED-current-monitor status against an OSEM coil drive signal (I chose top stage F1 as a representative example). There is a clear correlation between coil drive activity and the detection of a low voltage on the LED-current-monitor as seen by the HWWD (shows up as STAT_OUT = 8). I've attached two plots, one showing the two signals separately, on the other I have scaled the coil drive signal to a compatible Y-axis scale and plotted them together.
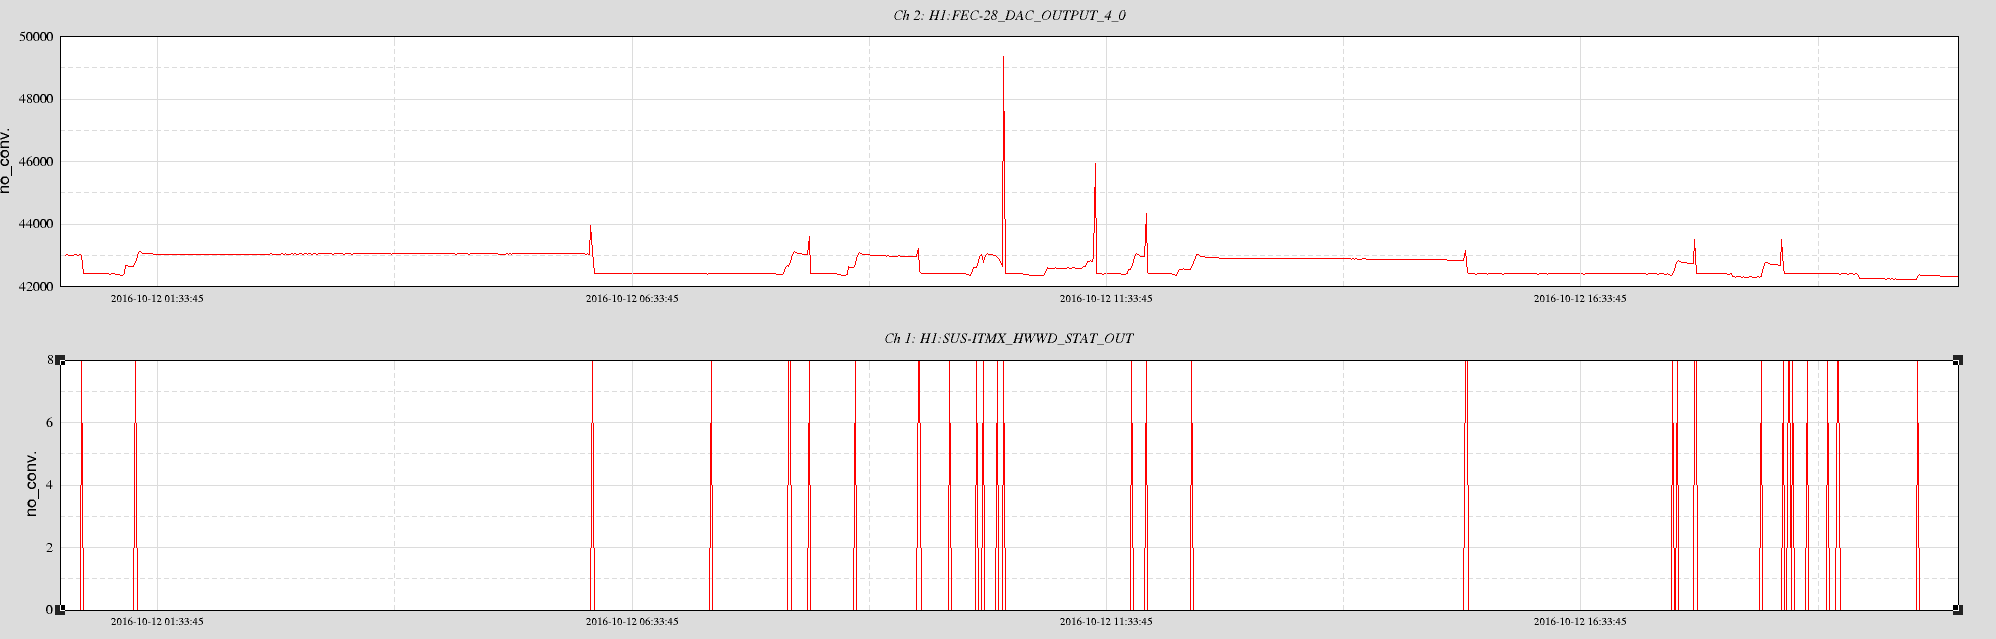
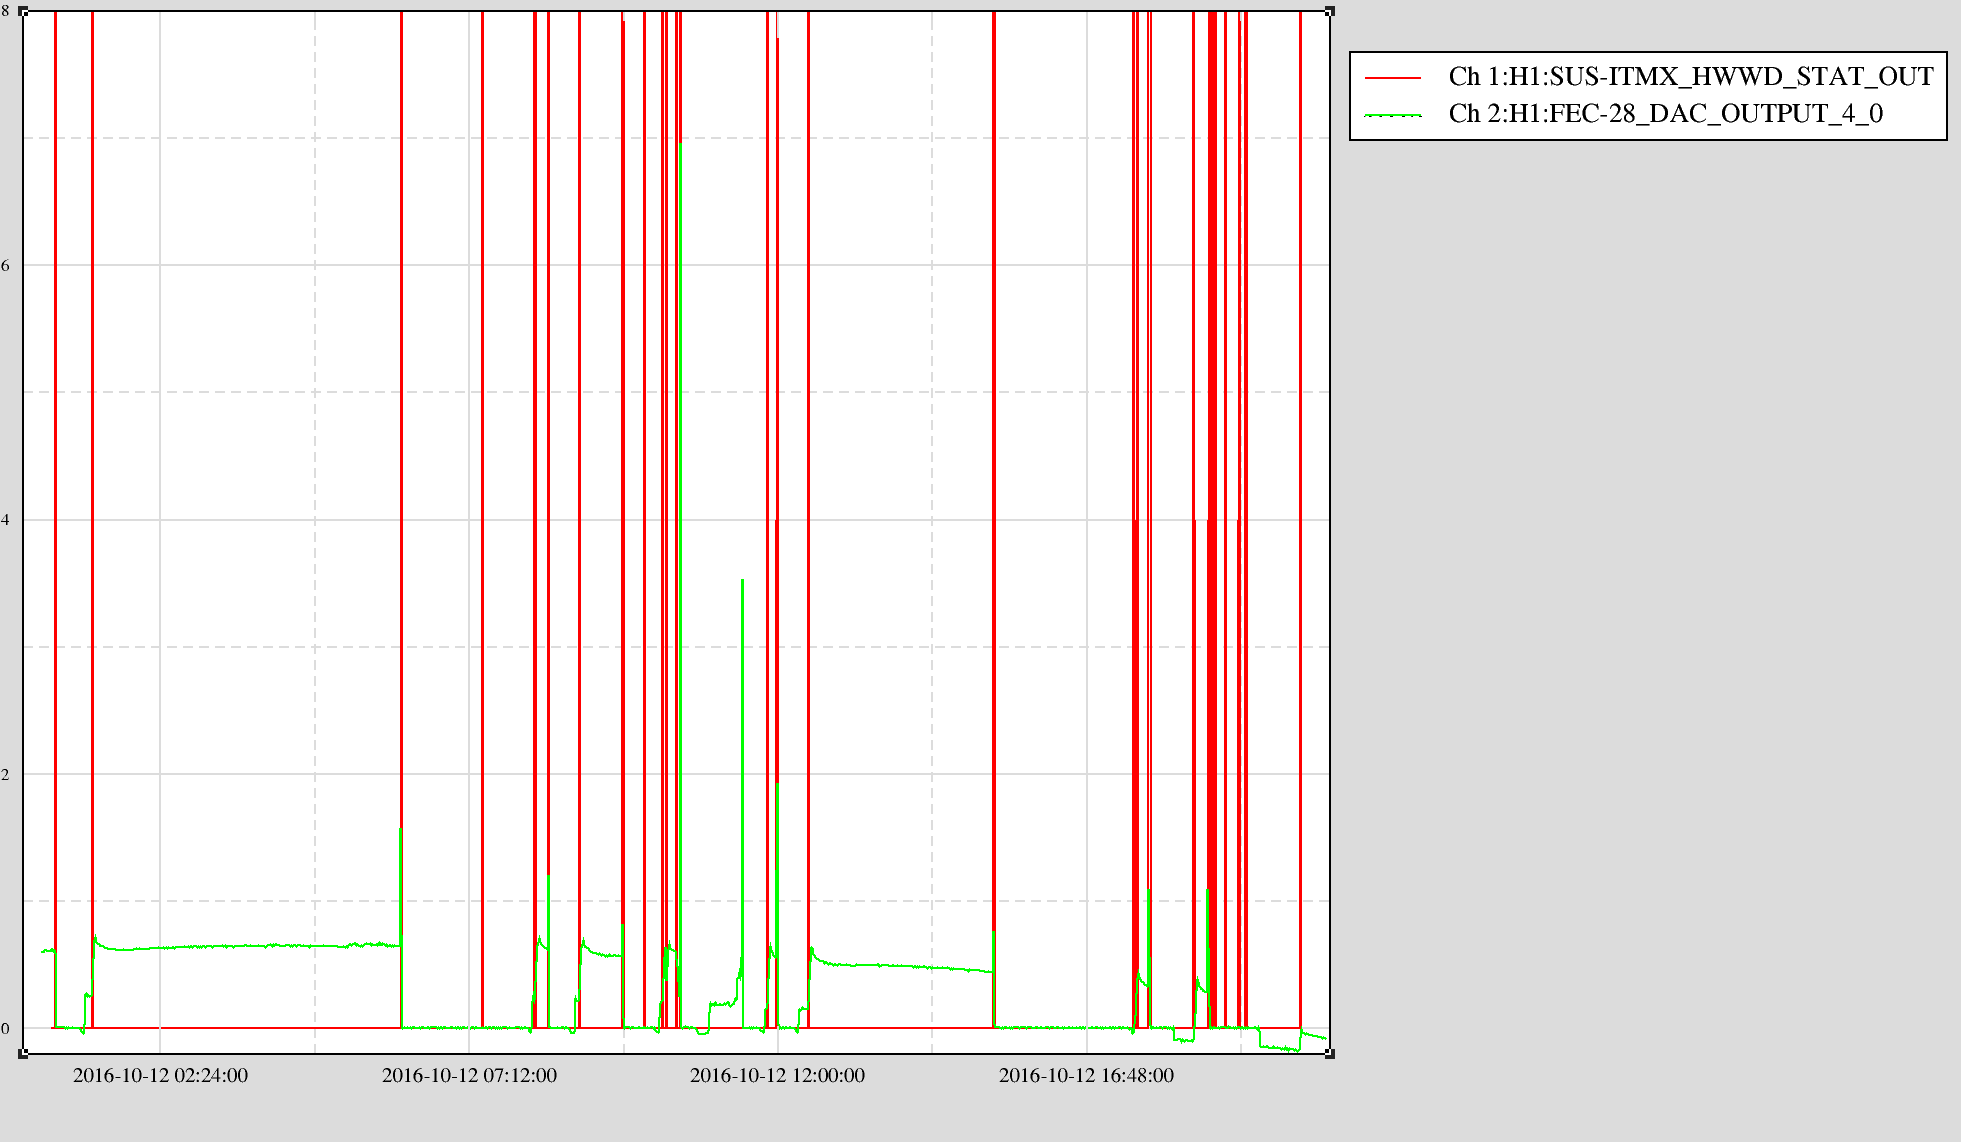
Hmm - perhaps current-loop would have been a better design given the long cables?
[Jenne, Cheryl, Nutsinee]
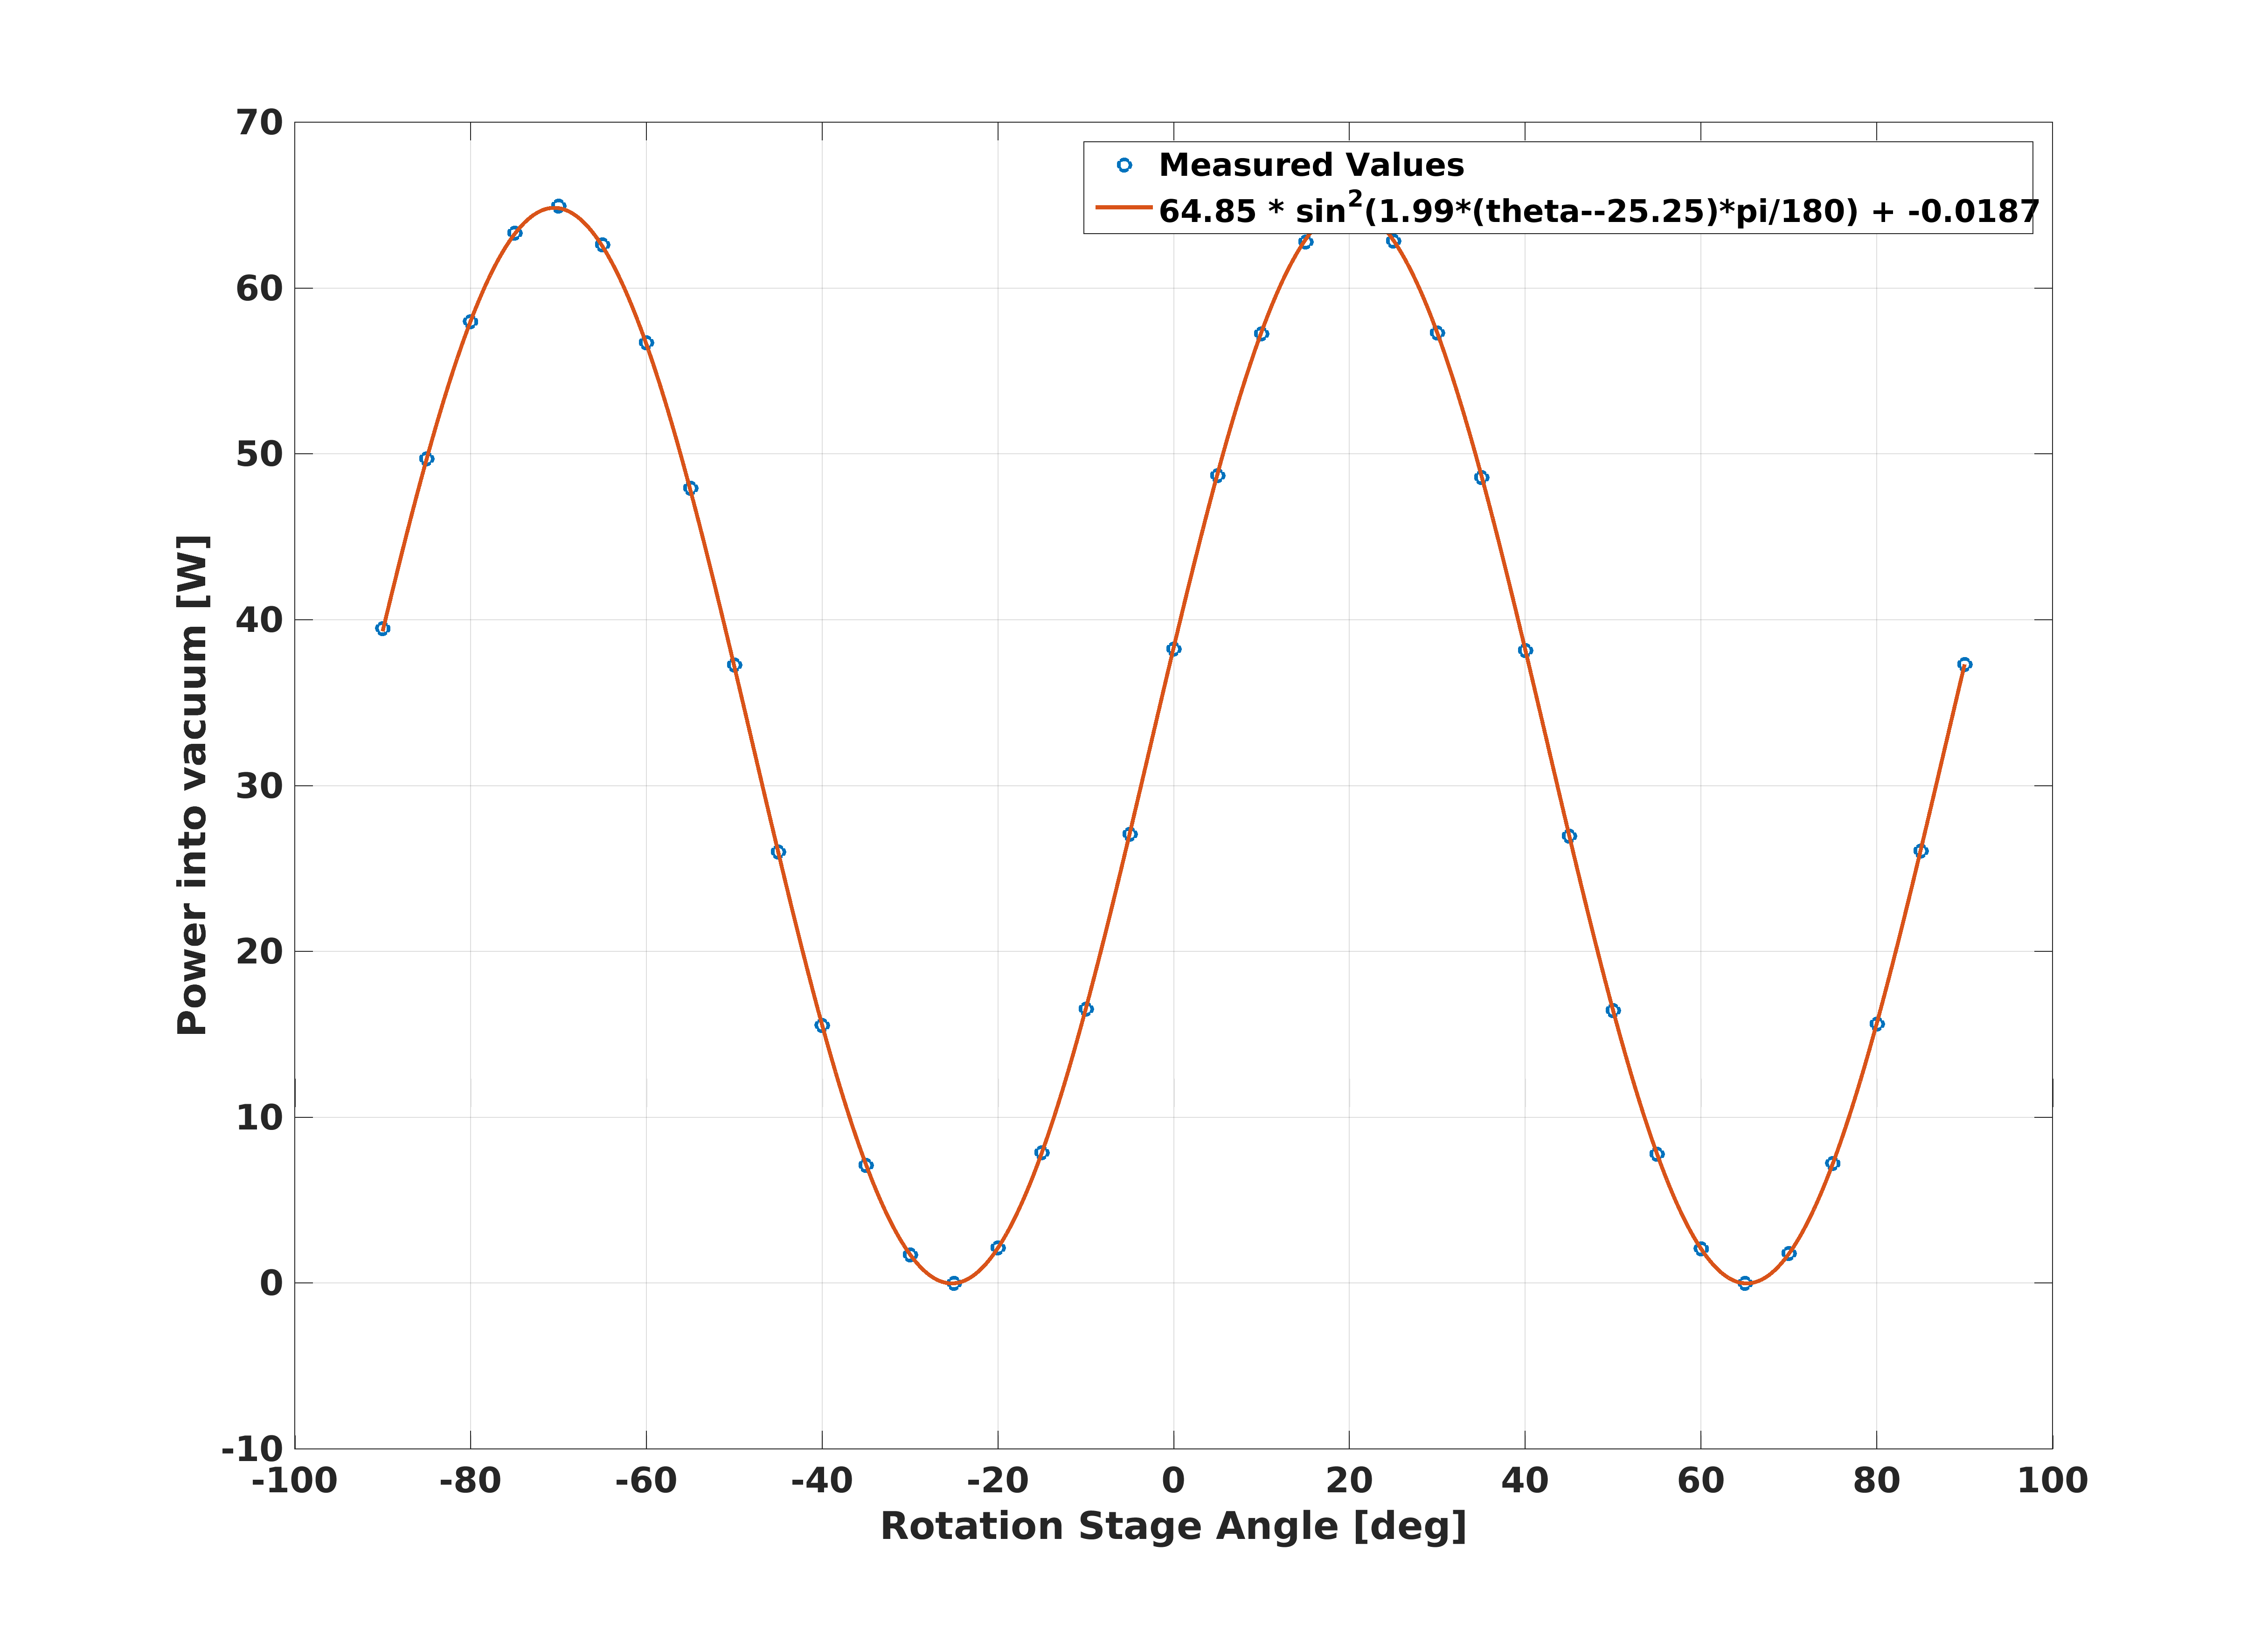
We tweaked the calibration of the PSL rotation stage, which hadn't been done since the power incident on the rotation stage was adjusted about a week ago. Now hopefully a 50W request will give us 50W, rather than some higher value. Nutsinee has her script ready for next time, so we can try doing it automatically rather than by hand.
I have written a fitting script for PSL rotation stage calibration, and put it in ...../userapps/psl/h1/scripts/RotationStage/
First, run Nutsinee's script MoveRotationStage.py, which will move the rotation stage from -90deg to +90deg, in 5 degree steps, and record the measured angle and the power at the PSL periscope to a text file.
Then with Matlab, run CalibRotStage.m. This will load the data, calibrate it, and give you a plot with the fitted calibration parameters in the legend.
Finally, move those values to the PSL rotation stage's calibration screen.
Unfortunately though, when we use the LASER_PWR guardian to request 50W, we only get about 48W. This was true earlier with my hand-tuned calibration, as well as with the fits. This is something that could be looked into.
J. Kissel, D. Tuyenbayev

We've grabbed another set of calibration measurements of the IFO's sensing function in order to build confidence in our newly commissioned front-end tracking of time dependent model parameters, and to confirm the discrepancy seen yesterday (LHO aLOG 30391) was not something funny about that lock stretch. Indeed the discrepancy remains.

We've found bugs in our code that compares our DARM model against these measurements, so we can't yet confirm exact numbers like optical gain, DARM coupled cavity pole frequency, or SRC detuning spring frequency to offer a proposed change to the CAL-CS front-end parameters to fix it. We'll hopefully have something by tomorrow.

Attached are screenshots of the measurements and the DARM loop parameters during the measurement.

Timeline: (in UTC)
2016-10-12
01:30:00 -- IFO in stable Nominal Low Noise (PCALY calibration lines are ON); IFO undisturbed
01:46:00 -- IFO sufficiently thermalized to start measurements; PCALY lines turned OFF
01:47:48 -- PCAL2DARM measurement begins
02:05:48 -- DARM OLGTF measurement begins
02:24:00 -- measurements done; PCALY lines turned back ON; IFO undisturbed
02:40:00 -- Official Undisturbed period ends (but no one has done anything with the IFO since, up to 03:06 UTC)

Data files (which are exported and committed to the SVN):
/ligo/svncommon/CalSVN/aligocalibration/trunk/Runs/PreER10/H1/Measurements/
DARMOLGTFs/2016-10-12_H1_DARM_OLGTF_4to1200Hz.xml
PCAL/2016-10-12_H1_PCAL2DARMTF_4to1200Hz.xml
J. Kissel, D. Tuyenbayev,
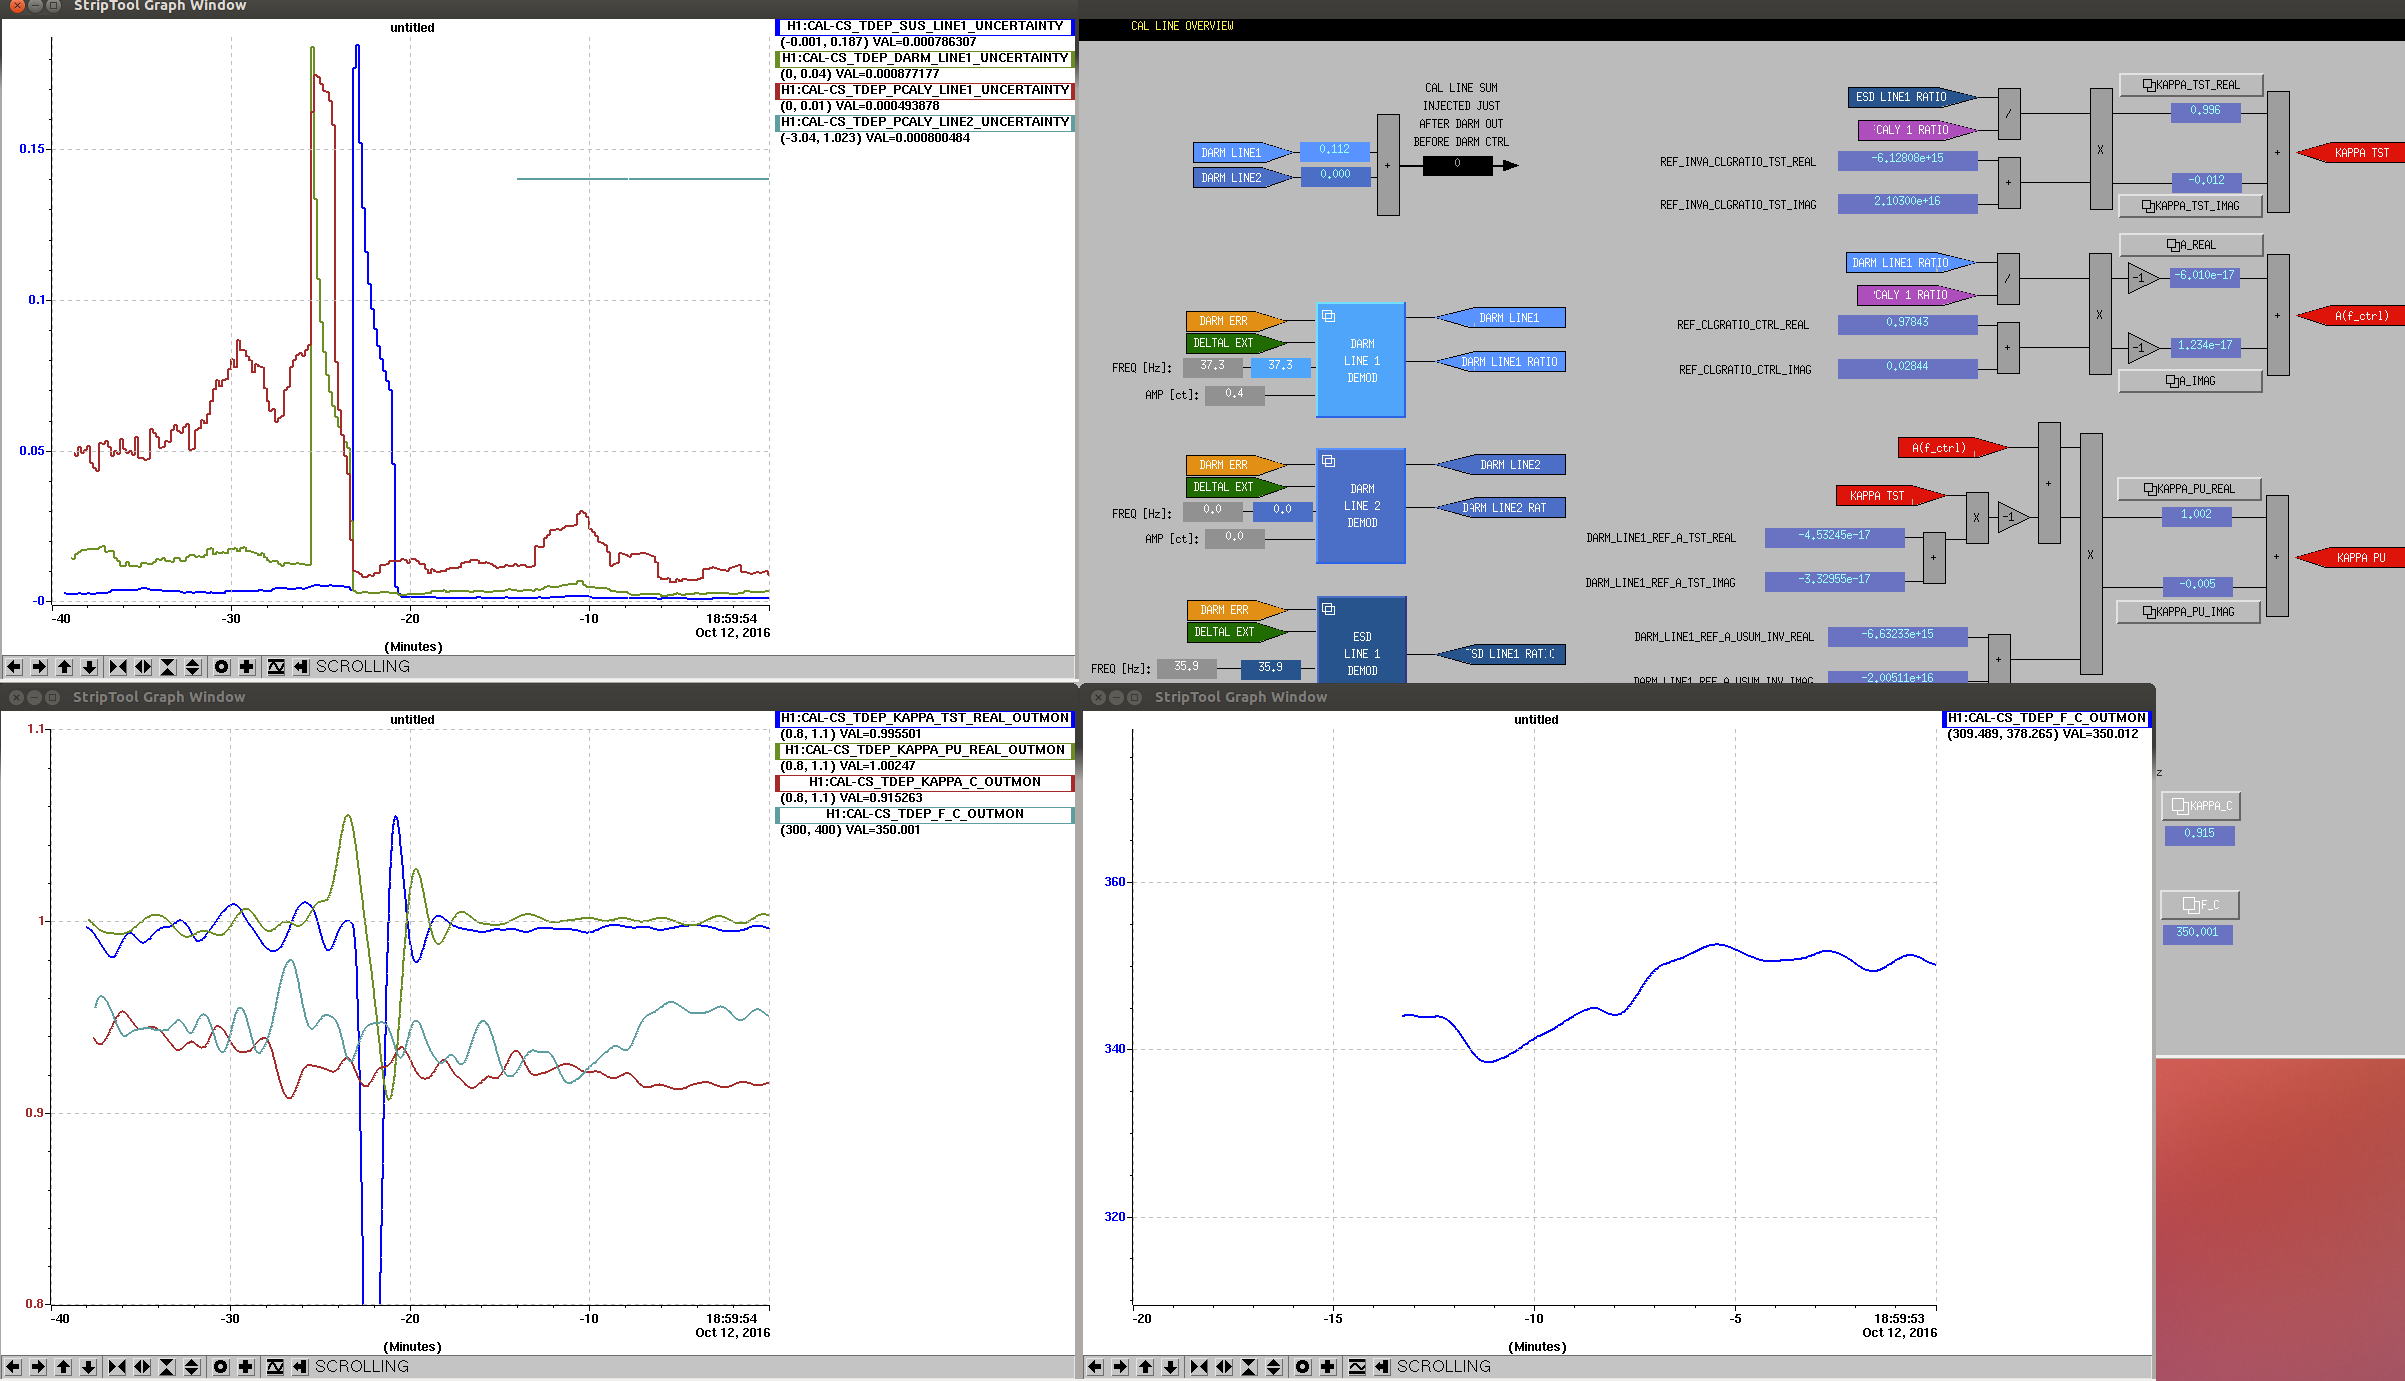
These are kappas calculated in the front-end after the TF measurements have been completed.
The optical gain is still ~15% lower w.r.t. the value in the DARM model parameters and the coupled-cavity pole frequency is ~ 340-350 Hz, which is higher compared to the yesterday's value (LHO alog 30391).
There's still more noise in the calculated values of fC. The SNR of the 331.9 Hz line is affected by a slightly increased noise in the [0.2, 1.0] kHz band.
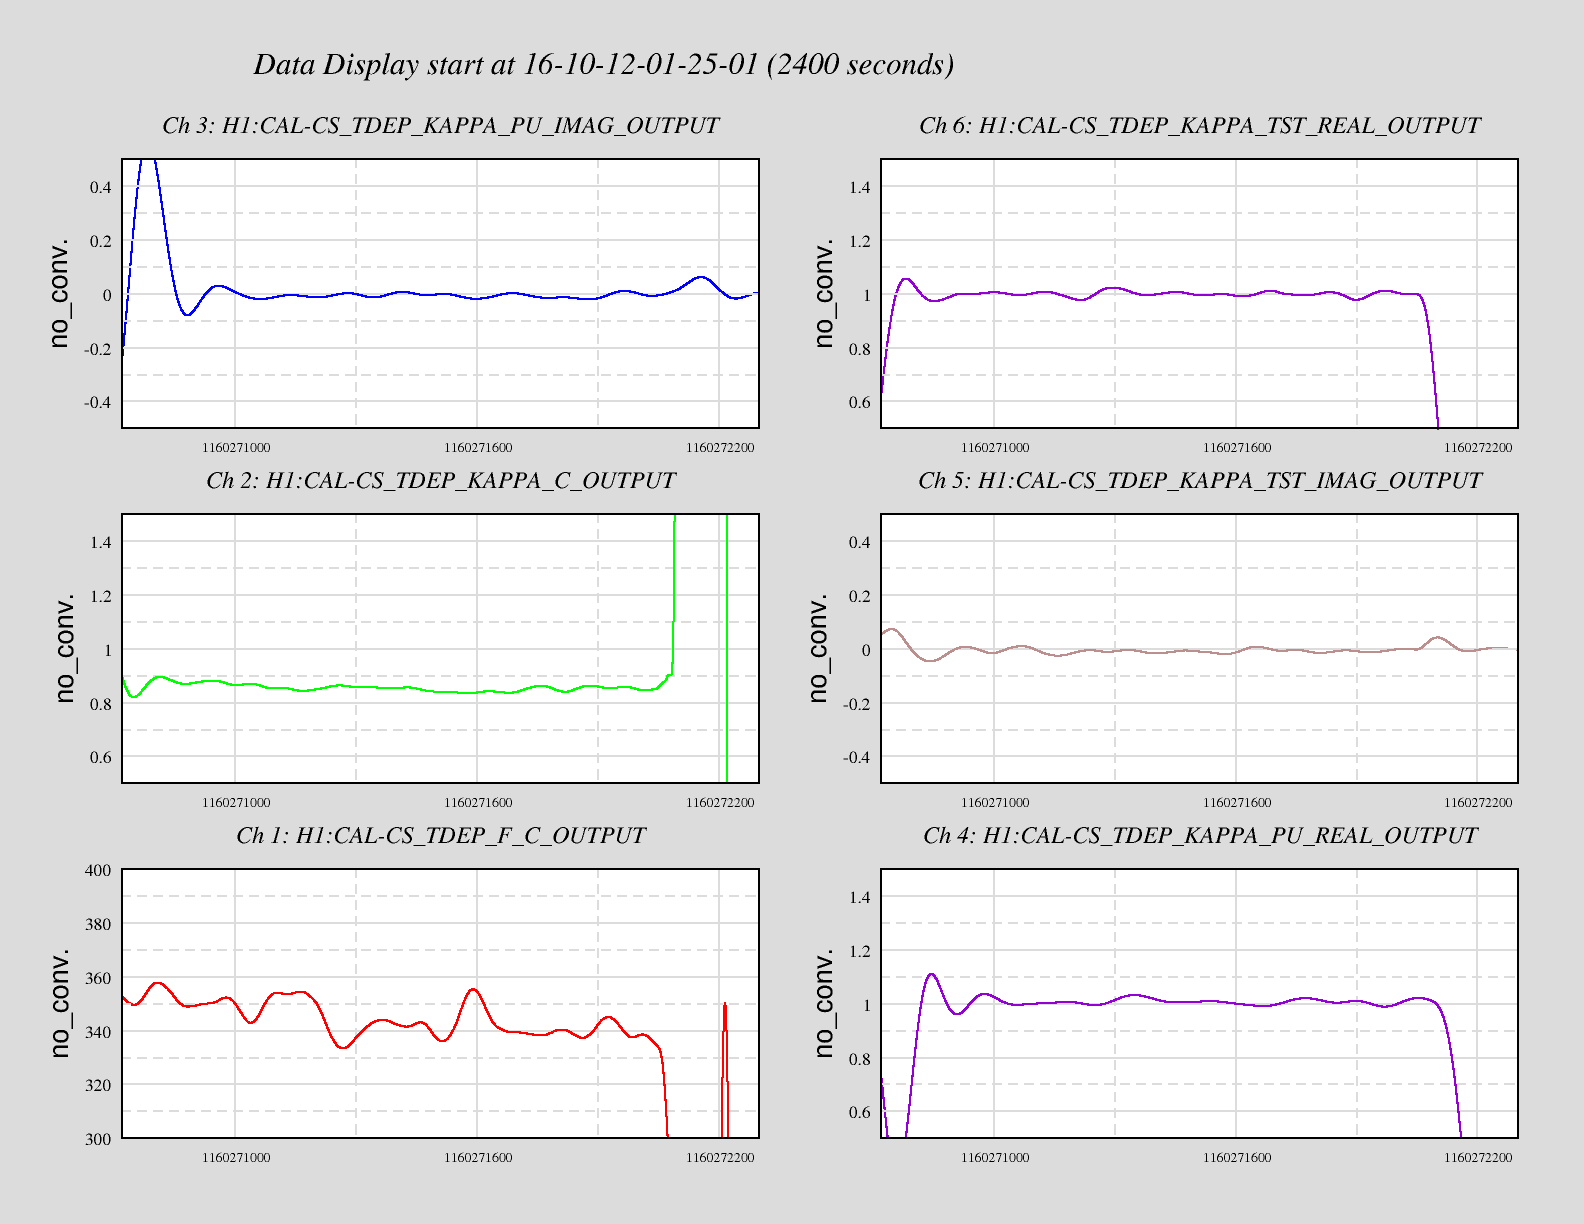
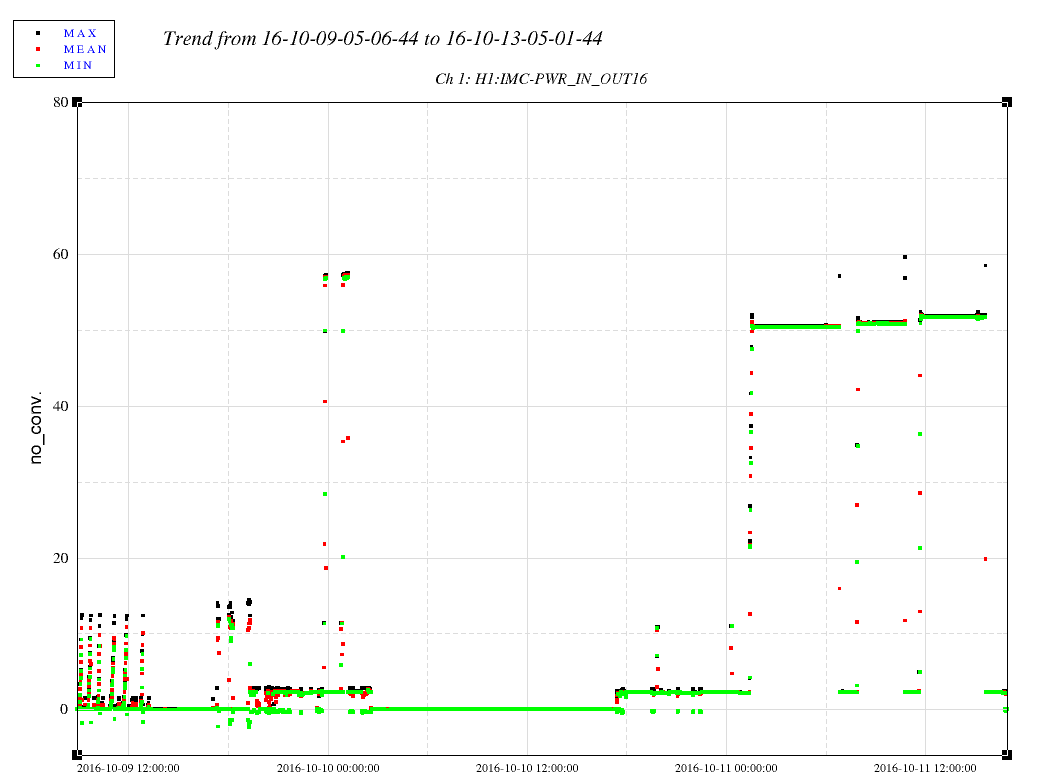
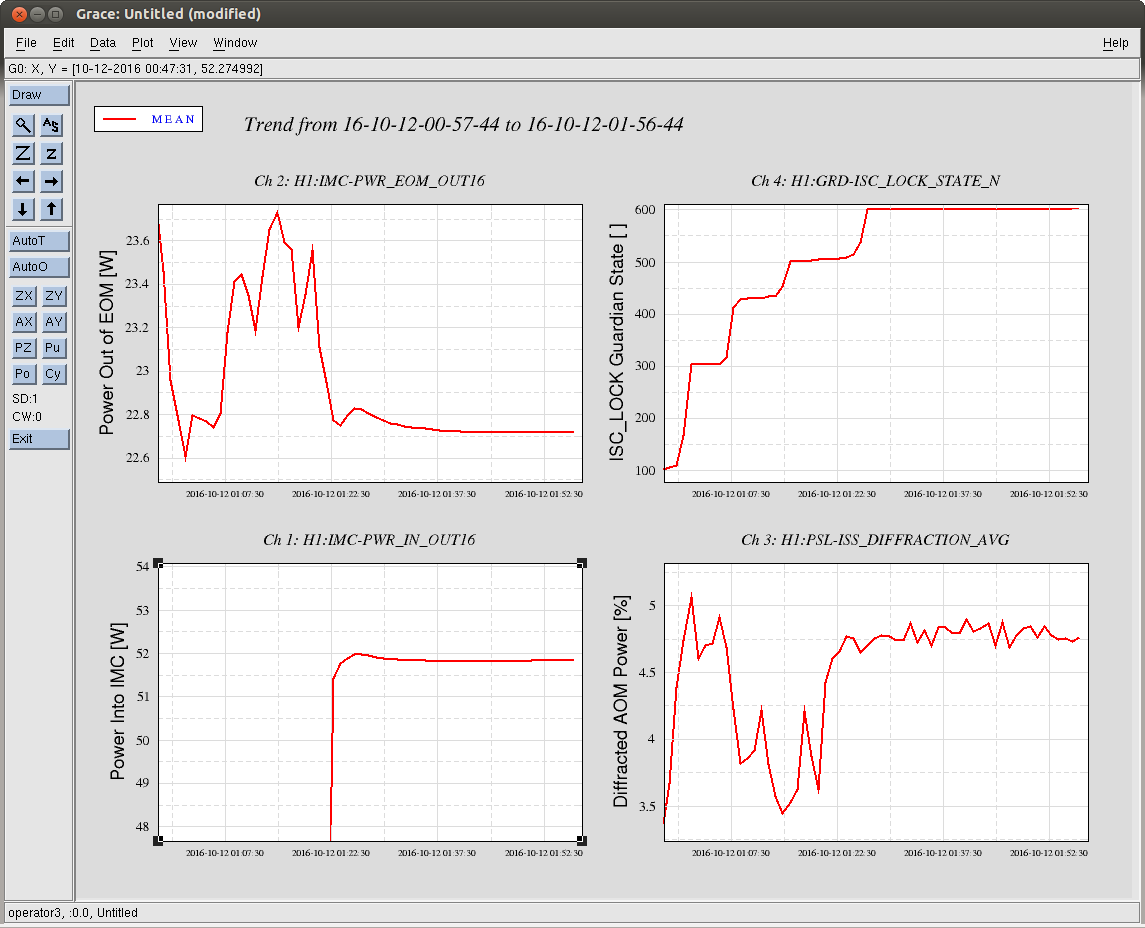
Doing the same thing as was done in LHO aLOG 30475,

I've grabbed similar undisturbed data from the times quoted in the original entry, and replotted them in matlab after doing some rudimentary math. The 15 minute (900 sec) average value (starting at Oct 12 2016 02:39:00 UTC) for all of the time dependent parameters just after the sweeps are:

Param            Units        Mean      Std
kappa_{C}        [ ]          0.868     pm 0.01
f_{cc}           [Hz]         325       pm 5.5
Re: kappa_{PU}   [ ]          1.01      pm 0.0089
Im: kappa_{PU}   [ ]          0.0007    pm 0.015
Re: kappa_{TST}  [ ]          0.998     pm 0.011
Im: kappa_{TST}  [ ]          -0.010    pm 0.0091

Input Power      [W]          51.8      pm 0.029

The script to generate these values lives in
/ligo/svncommon/CalSVN/aligocalibration/trunk/Runs/PreER10/H1/Scripts/CAL_EPICS/get_fe_tdep_params.m
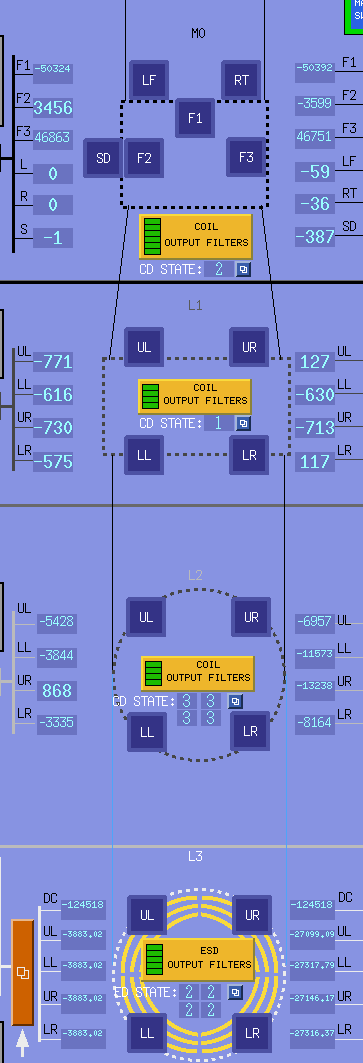
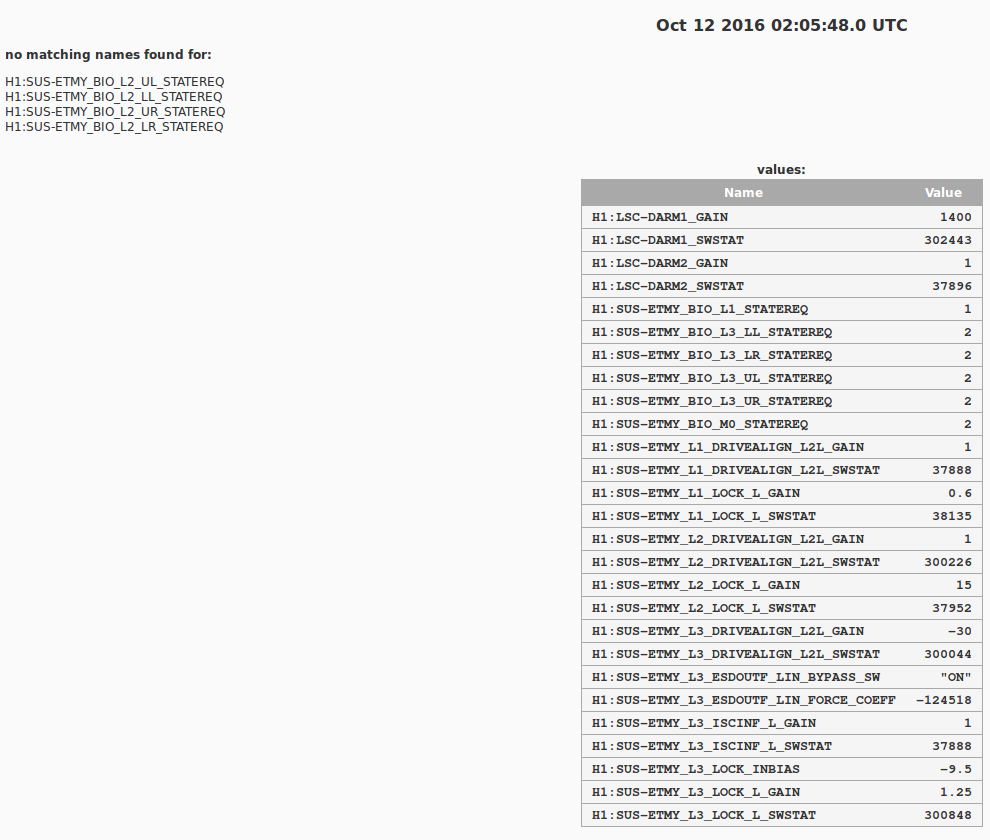
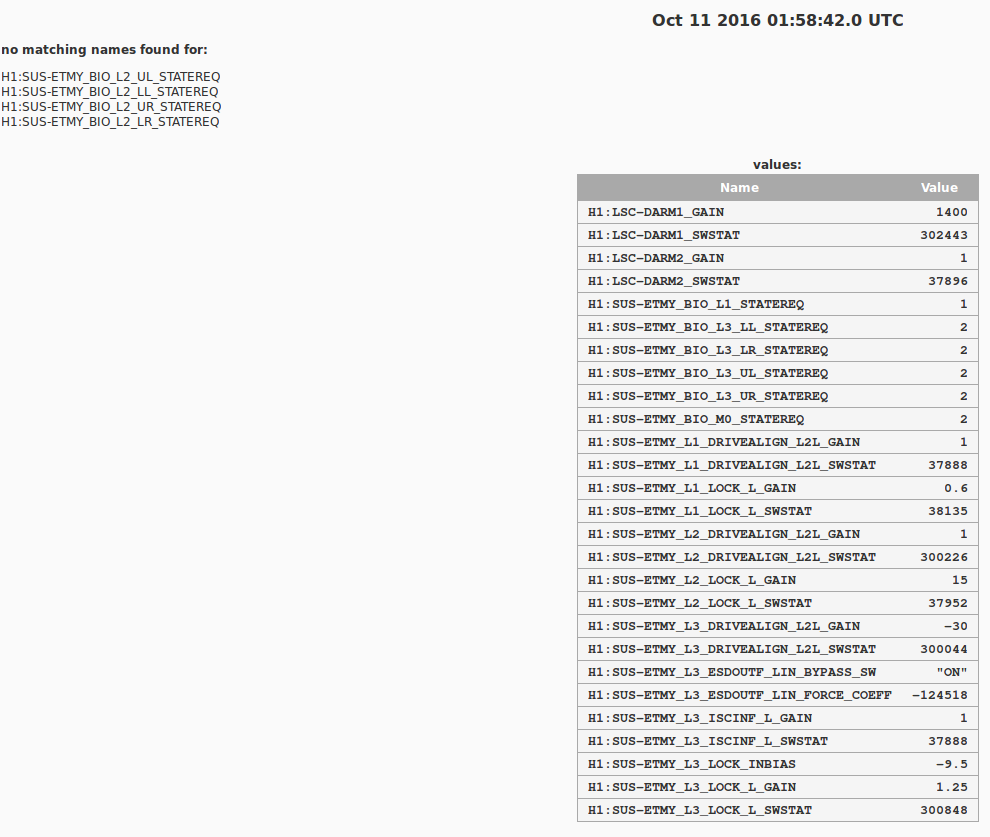
J. Kissel

I've used Kiwamu's templates (LHO aLOG 29860) to gather new DARM OLG and PCAL2DARM transfer functions, to help increase the number of data points for darm coupled cavity pole and SRC detuning spring frequencies. In doing so, I've found that PCAL suggests that CAL-DELTAL_EXTERNAL is wrong low by ~20% above 50 Hz, in a frequency dependent fashion (confirmed by the phase and ridiculously high coherence).

We will analyze the data in-full, and report what the measured pole and spring frequencies are in the morning. We'll also show trends of calibration line heights, such that eventually we can confirm the frequencies over time.

This frequency dependent error in CAL-DELTAL_EXTERNAL may be because the DARM coupled cavity pole frequency programmed into the CAL CS fron end is 342 Hz, and that's just not correct for this lock stretch. We have to turn OFF the PCALY calibration lines during the measurement due to range issues, but the front end calculation of the DARM cavity pole, after the measurement, suggests anywhere for 315 Hz to 340 Hz. Unclear whether we can trust the online calculation just yet, so we're leaving the IFO alone for ~30 minutes after the measurement to be able to confirm offline later.

Recall that we're still not controlling the cavity waist angle/translation of the SRC entirely: the SRC1 loop (nominally controlling SRM alone) is OFF, but the SRC2 loop (controlling SRM and SR2) is ON.

Undisturbed time post-sweeps:
Start    Oct 11 2016 02:36:00 UTC   Oct 10 2016 19:36:00 PDT  1160188577
Stop     Oct 11 2016 03:07:00 UTC   Oct 10 2016 20:07:00 PDT  1160190437

The new measurements have not yet been exported, but have been committed to the CalSVN here:
/ligo/svncommon/CalSVN/aligocalibration/trunk/Runs/PreER10/H1/Measurements/
DARMOLGTFs/2016-10-10_H1_DARM_OLGTF_4to1200Hz.xml
PCAL/2016-10-10_H1_PCAL2DARMTF_4to1200Hz.xml


EDIT: I've added two screenshots showing the digital settings relevant to the DARM loop parameters. Unfortunately, the production conlog is down for maintenance/upgrades, but thankfully Patrick setup a test bed a few nights ago (goto http://conlog-test-replica/), I was able to pull the list of channels I needed. FAlso for the record, some of those channels have changed since O1, so I quote the new list here for easier copy and paste in the future:
H1:LSC-DARM1_SWSTAT
H1:LSC-DARM1_GAIN
H1:LSC-DARM2_SWSTAT
H1:LSC-DARM2_GAIN
H1:SUS-ETMY_L1_LOCK_L_SWSTAT
H1:SUS-ETMY_L1_LOCK_L_GAIN
H1:SUS-ETMY_L1_DRIVEALIGN_L2L_SWSTAT
H1:SUS-ETMY_L1_DRIVEALIGN_L2L_GAIN
H1:SUS-ETMY_L2_LOCK_L_SWSTAT
H1:SUS-ETMY_L2_LOCK_L_GAIN
H1:SUS-ETMY_L2_DRIVEALIGN_L2L_SWSTAT
H1:SUS-ETMY_L2_DRIVEALIGN_L2L_GAIN
H1:SUS-ETMY_L3_ISCINF_L_SWSTAT
H1:SUS-ETMY_L3_ISCINF_L_GAIN
H1:SUS-ETMY_L3_LOCK_L_SWSTAT
H1:SUS-ETMY_L3_LOCK_L_GAIN
H1:SUS-ETMY_L3_DRIVEALIGN_L2L_SWSTAT
H1:SUS-ETMY_L3_DRIVEALIGN_L2L_GAIN
H1:SUS-ETMY_L3_LOCK_INBIAS
H1:SUS-ETMY_L3_ESDOUTF_LIN_BYPASS_SW
H1:SUS-ETMY_L3_ESDOUTF_LIN_FORCE_COEFF
H1:SUS-ETMY_BIO_M0_STATEREQ
H1:SUS-ETMY_BIO_L1_STATEREQ
H1:SUS-ETMY_BIO_L2_UL_STATEREQ
H1:SUS-ETMY_BIO_L2_LL_STATEREQ
H1:SUS-ETMY_BIO_L2_UR_STATEREQ
H1:SUS-ETMY_BIO_L2_LR_STATEREQ
H1:SUS-ETMY_BIO_L3_UL_STATEREQ
H1:SUS-ETMY_BIO_L3_UR_STATEREQ
H1:SUS-ETMY_BIO_L3_LL_STATEREQ
H1:SUS-ETMY_BIO_L3_LR_STATEREQ
J. Kissel, D. Tuyenbayev,
Kappas calculated in the front-end suggest that an optical gain was lower compared to the reference time (optical gain in the DARM model) by ~15% and the coupled-cavity pole frequency was ~325 Hz at the TF measurement time.
Also it seems that the SNR of 331.9 Hz line is not sufficient - higher statistical noise in the calculated κC and fC.
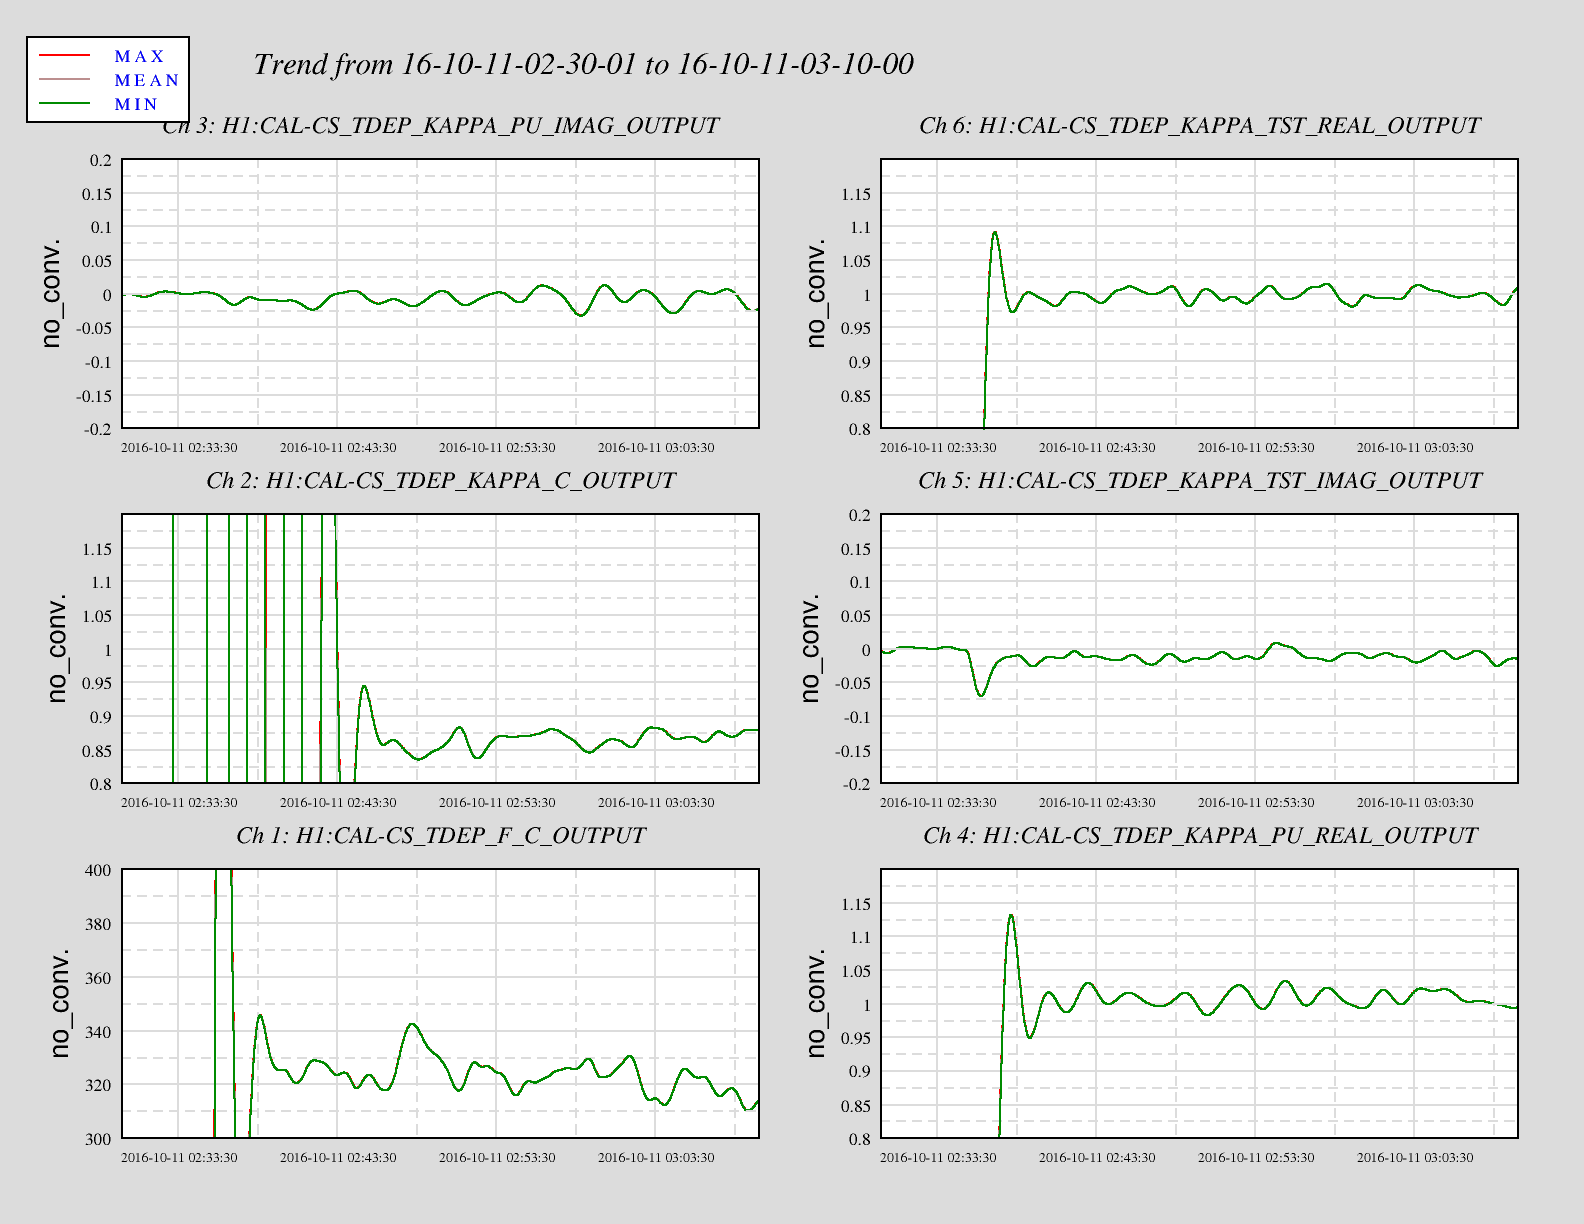
A little bit more quantitative assessment if the time dependent correction factors as computed by the front end (or "kappas"):

I've grabbed similar undisturbed data from the times quoted in the original entry, and replotted them in matlab after doing some rudimentary math. The 15 minute (900 sec) average value (starting at Oct 11 2016 02:51:00 UTC) for all of the time dependent parameters just after the sweeps are:

Param            Units        Mean      Std
kappa_{C}        [ ]          0.866     pm 0.011
f_{cc}           [Hz]         323       pm 4.5
Re: kappa_{PU}   [ ]          1.01      pm 0.011
Im: kappa_{PU}   [ ]          -0.007    pm 0.012
Re: kappa_{TST}  [ ]          0.998     pm 0.0085
Im: kappa_{TST}  [ ]          0.0095    pm 0.0065

Input Power      [W]          50.5      pm 0.031

The script to generate these values lives in
/ligo/svncommon/CalSVN/aligocalibration/trunk/Runs/PreER10/H1/Scripts/CAL_EPICS/get_fe_tdep_params.m

And for ease of copy and paste for someone in the future, I'm gathering the following channels (which correspond to the parameters in the same order as the table above)
H1:CAL-CS_TDEP_KAPPA_C_OUTPUT
H1:CAL-CS_TDEP_F_C_OUTPUT
H1:CAL-CS_TDEP_KAPPA_PU_REAL_OUTPUT
H1:CAL-CS_TDEP_KAPPA_PU_IMAG_OUTPUT
H1:CAL-CS_TDEP_KAPPA_TST_REAL_OUTPUT
H1:CAL-CS_TDEP_KAPPA_TST_IMAG_OUTPUT
H1:IMC-PWR_IN_OUTPUT
Evan, Daniel
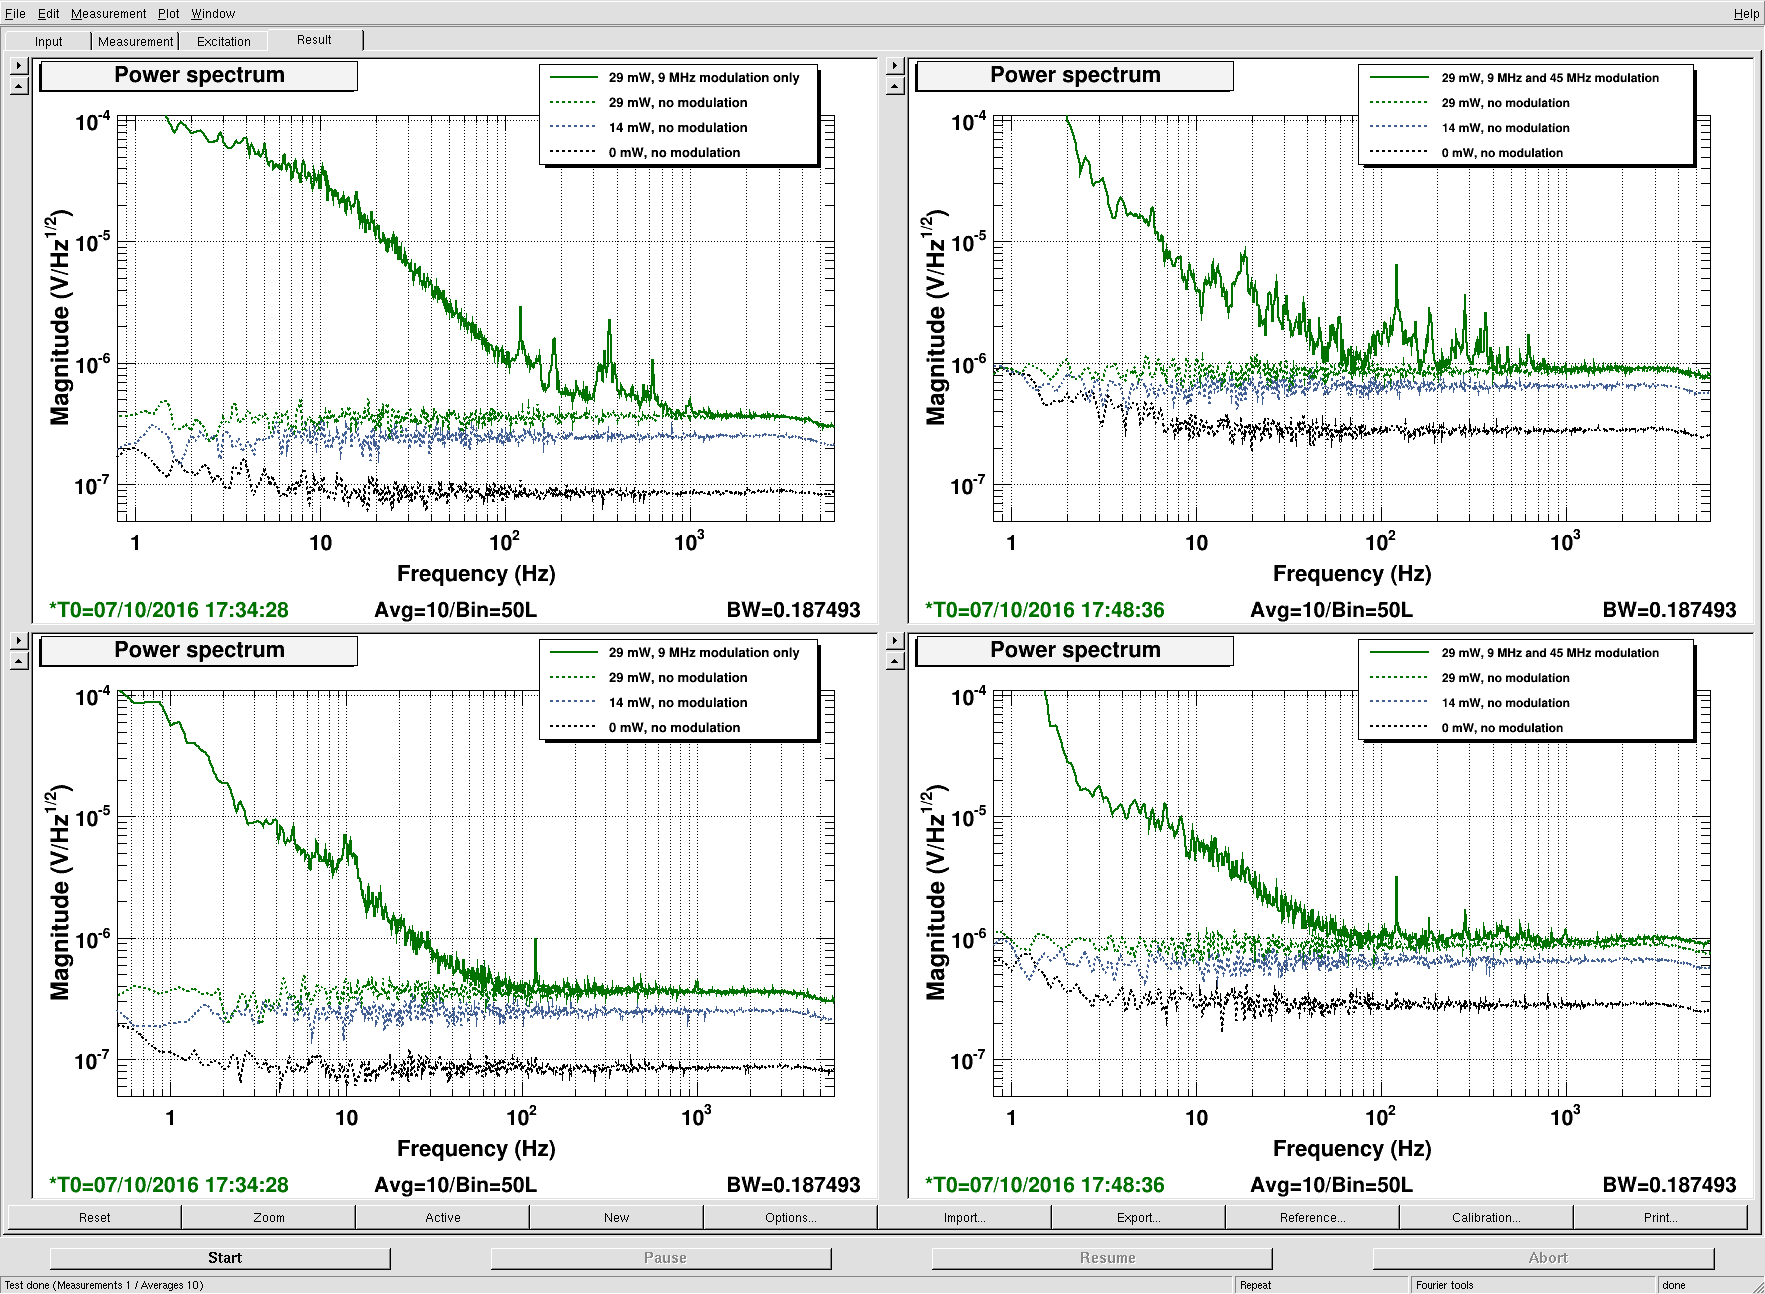
17:12:30 UTC Oct 7 2016:
17:16:30 UTC Oct 7 2016:
17:18:30 UTC Oct 7 2016:
17:24:30 UTC Oct 7 2016:
17:32:00 UTC Oct 7 2016:
17:34:30 UTC Oct 7 2016:
18:06:30 UTC Oct 7 2016:
Spectra attached.
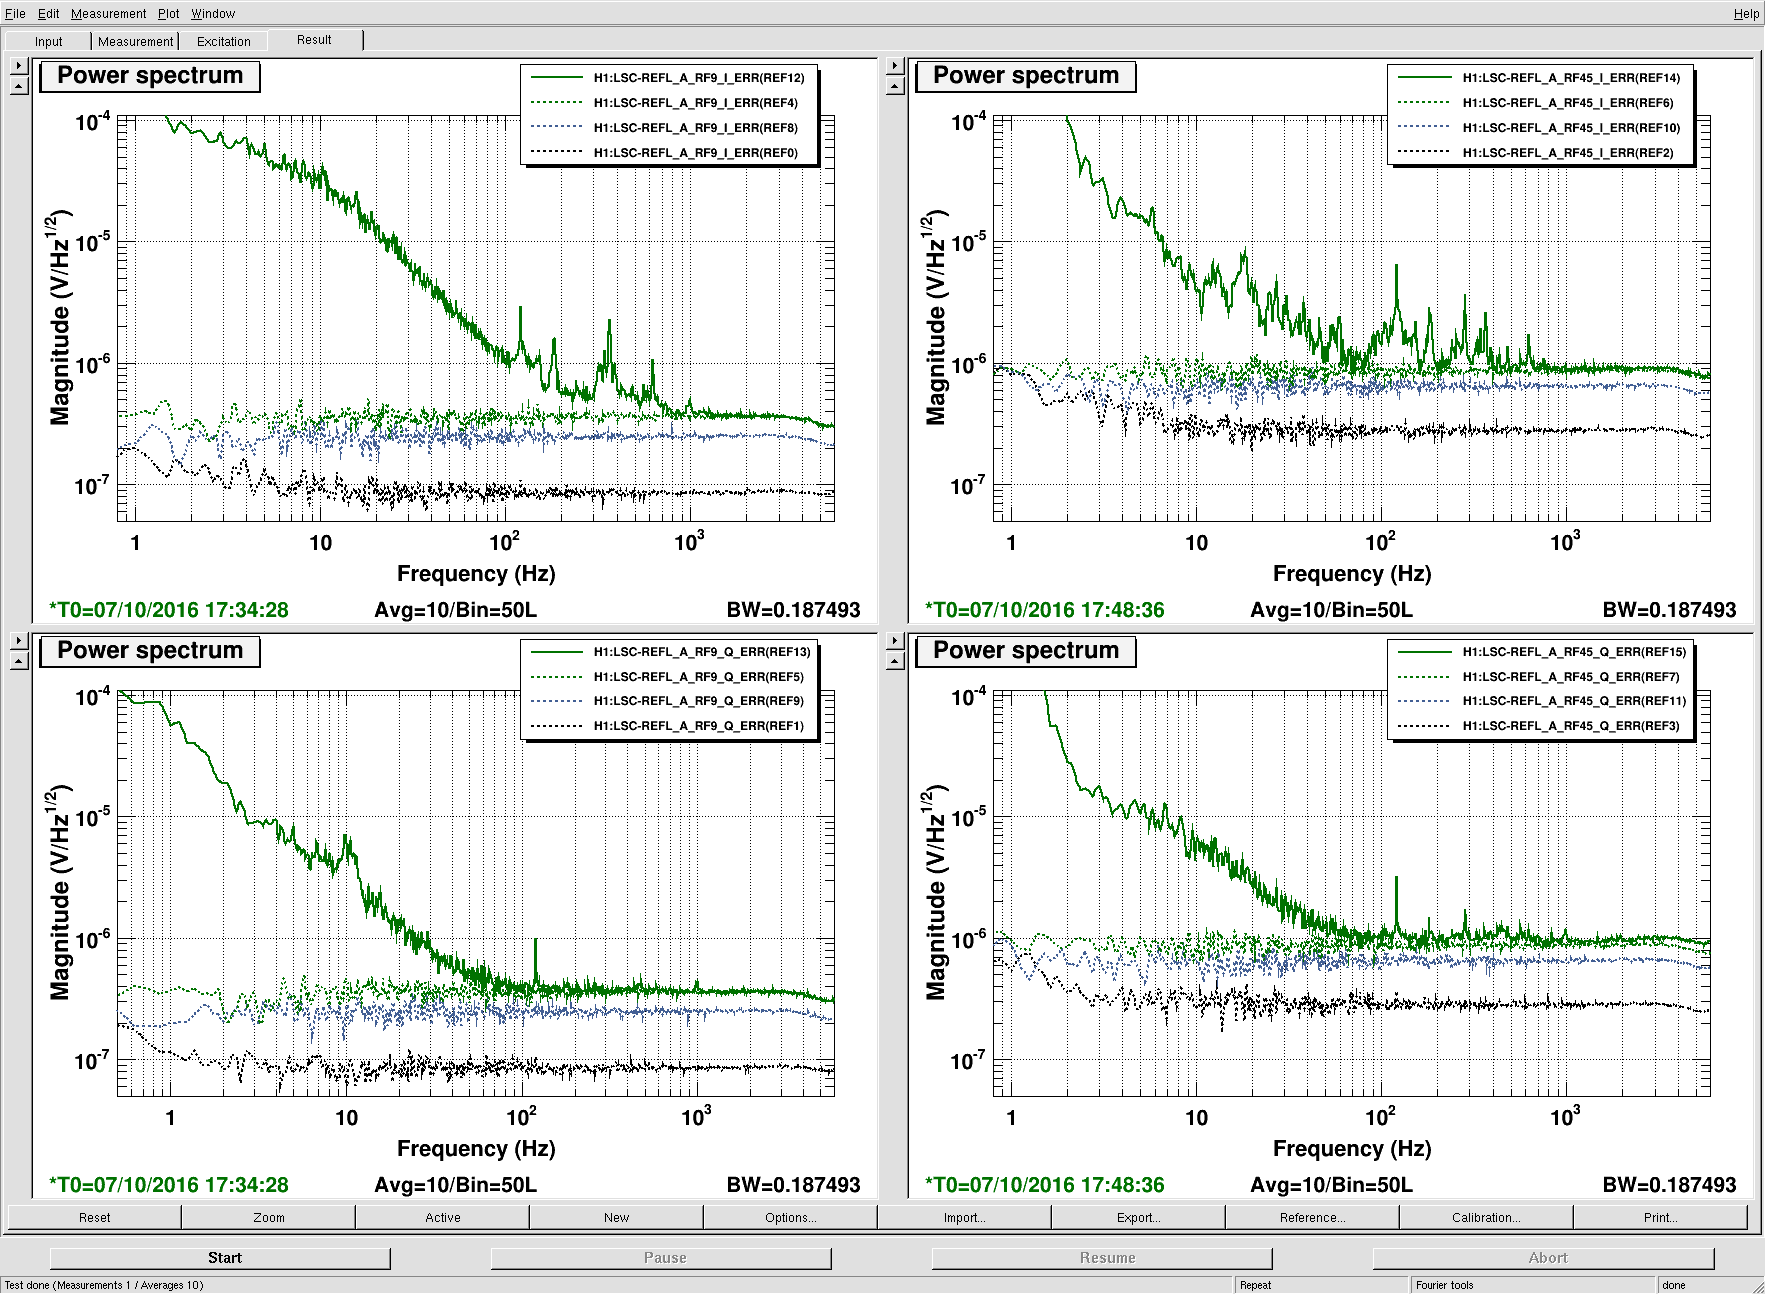
Coherence (modulation on)
Using 2600 V/W for the demod gain and transimpedance, and 29 mW of dc PD power, this implies the following AM depths:
| I | Q | |
| 9 MHz | 0.95×10⁻⁴ | 2.4×10⁻⁴ |
| 45 MHz | 1.9×10⁻⁴ | 8.2×10⁻⁴ |
Using 0.22 rad and 0.28 rad for the 9 MHz and 45 MHz modulation depths, this implies the following AM/PM ratios:
| I | Q | |
| 9 MHz | 0.43×10⁻³ | 1.1×10⁻³ |
| 45 MHz | 0.67×10⁻³ | 2.9×10⁻³ |
The attachment contains a budget of the expected CARM residual. The in-loop error point is taken from the CM board control signal, as was done previously. Here I used 2600 V/W for the transimpedance and demod gain.
The other measured traces are taken from the REFL9I readback (not from the CM board), so in principle there could be some extra dark noise at the error point from the summing node board or CM board. However, based on the O1 level this is of the same order as the shot noise (so we are not missing a huge amount of extra noise in this estimate).
Attaching earlier RAM plot, this time with informative labels
Here is a time series of REFL LF during the modulation depth reductions that happen during lock acquistion.
During the 9 MHz depth reduction (from 0.22 rad to 0.11 rad), the dc power changes from 4.83(3) mW to 4.27(3) mW. That means that after the modulation depth reduction, 4.08(4) mW of the dc light is from the carrier and 0.19(2) mW of the dc light is from the 9 MHz sideband (this assumes the 45 MHz contribution is negligible).
Note that the dc level is still settling to its final value of ~3.7 mW, so it's possible that these power ratios are evolving during the lock.


