edmond.merilh@LIGO.ORG - posted 00:00, Wednesday 02 November 2016 (31104)
PSL Dust Alarm
PSL101 Yellow alarm at 6:59UTC 300NM
PSL101 Yellow alarm at 6:59UTC 300NM
I added a PRM_SPOT_MOVE state similar to the PR2_SPOT_MOVE and PR3_SPOT_MOVE states (see alog <a href="https://alog.ligo-wa.caltech.edu/aLOG/index.php?callRep=30754">30754</a>)
It allows moving IM3 to adjust only the PRM spot position.
To use it, just like with the other two scripts, turn off the PRC1 ASC loops.
The only issue with this state is that IM3 is very close to saturation already, so there is not much room.
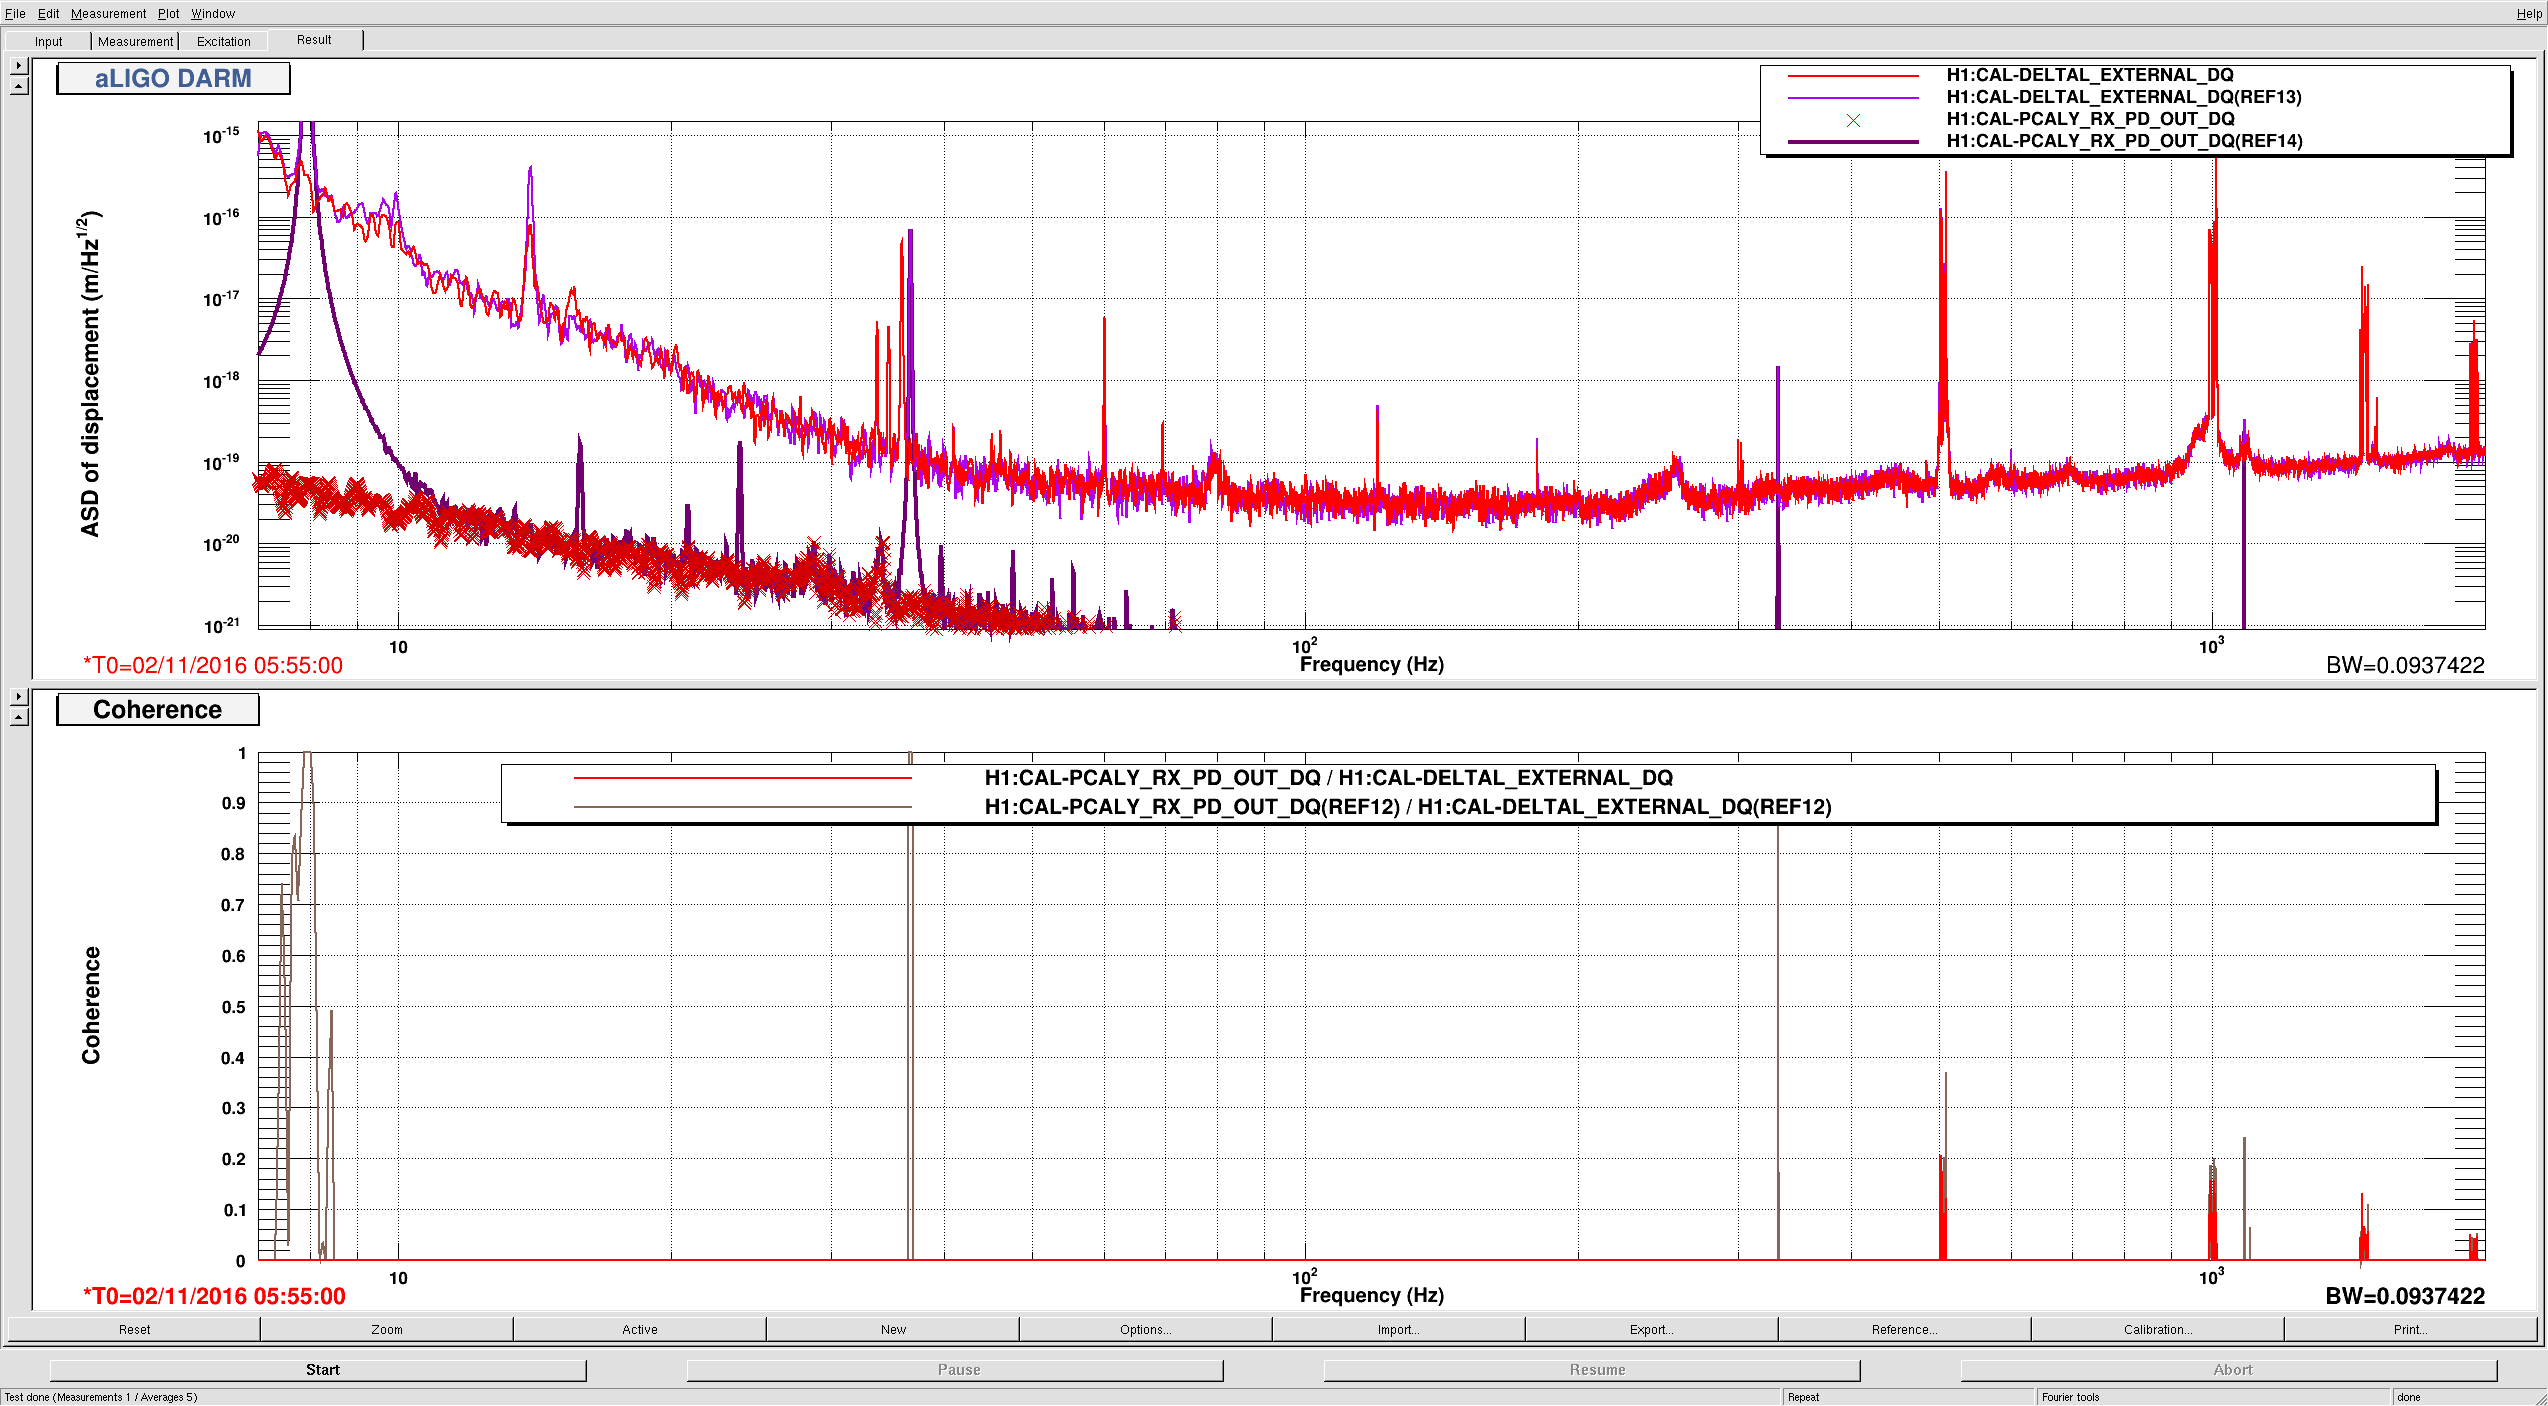
J. Kissel, M. Evans

Matt over heard me talking to Yuki about PCAL actuation and asked the time-honored question of whether the current "large" calibration lines were causing any non-linear impact in the DARM sensitivity. I've not proved this suspicion wrong in a few months, and not after starting the huge 7.9 Hz SRC detuning tracker line, so I figured I'd oblige.

As such, I've turned off the PCALY lines during this lock stretch at 05:51:42 UTC, and restored them at 06:11:00 UTC.
(Note, for those who are looking behind me, we were running A2L for the majority of the time between reaching nominal low noise and starting this test. Commissioning also broke the lock just after the test.)

The current line amplitudes do not adversely affect the DARM sensitivity in any other way than expected. Also for the record BNS range was identical between ON vs OFF as well.
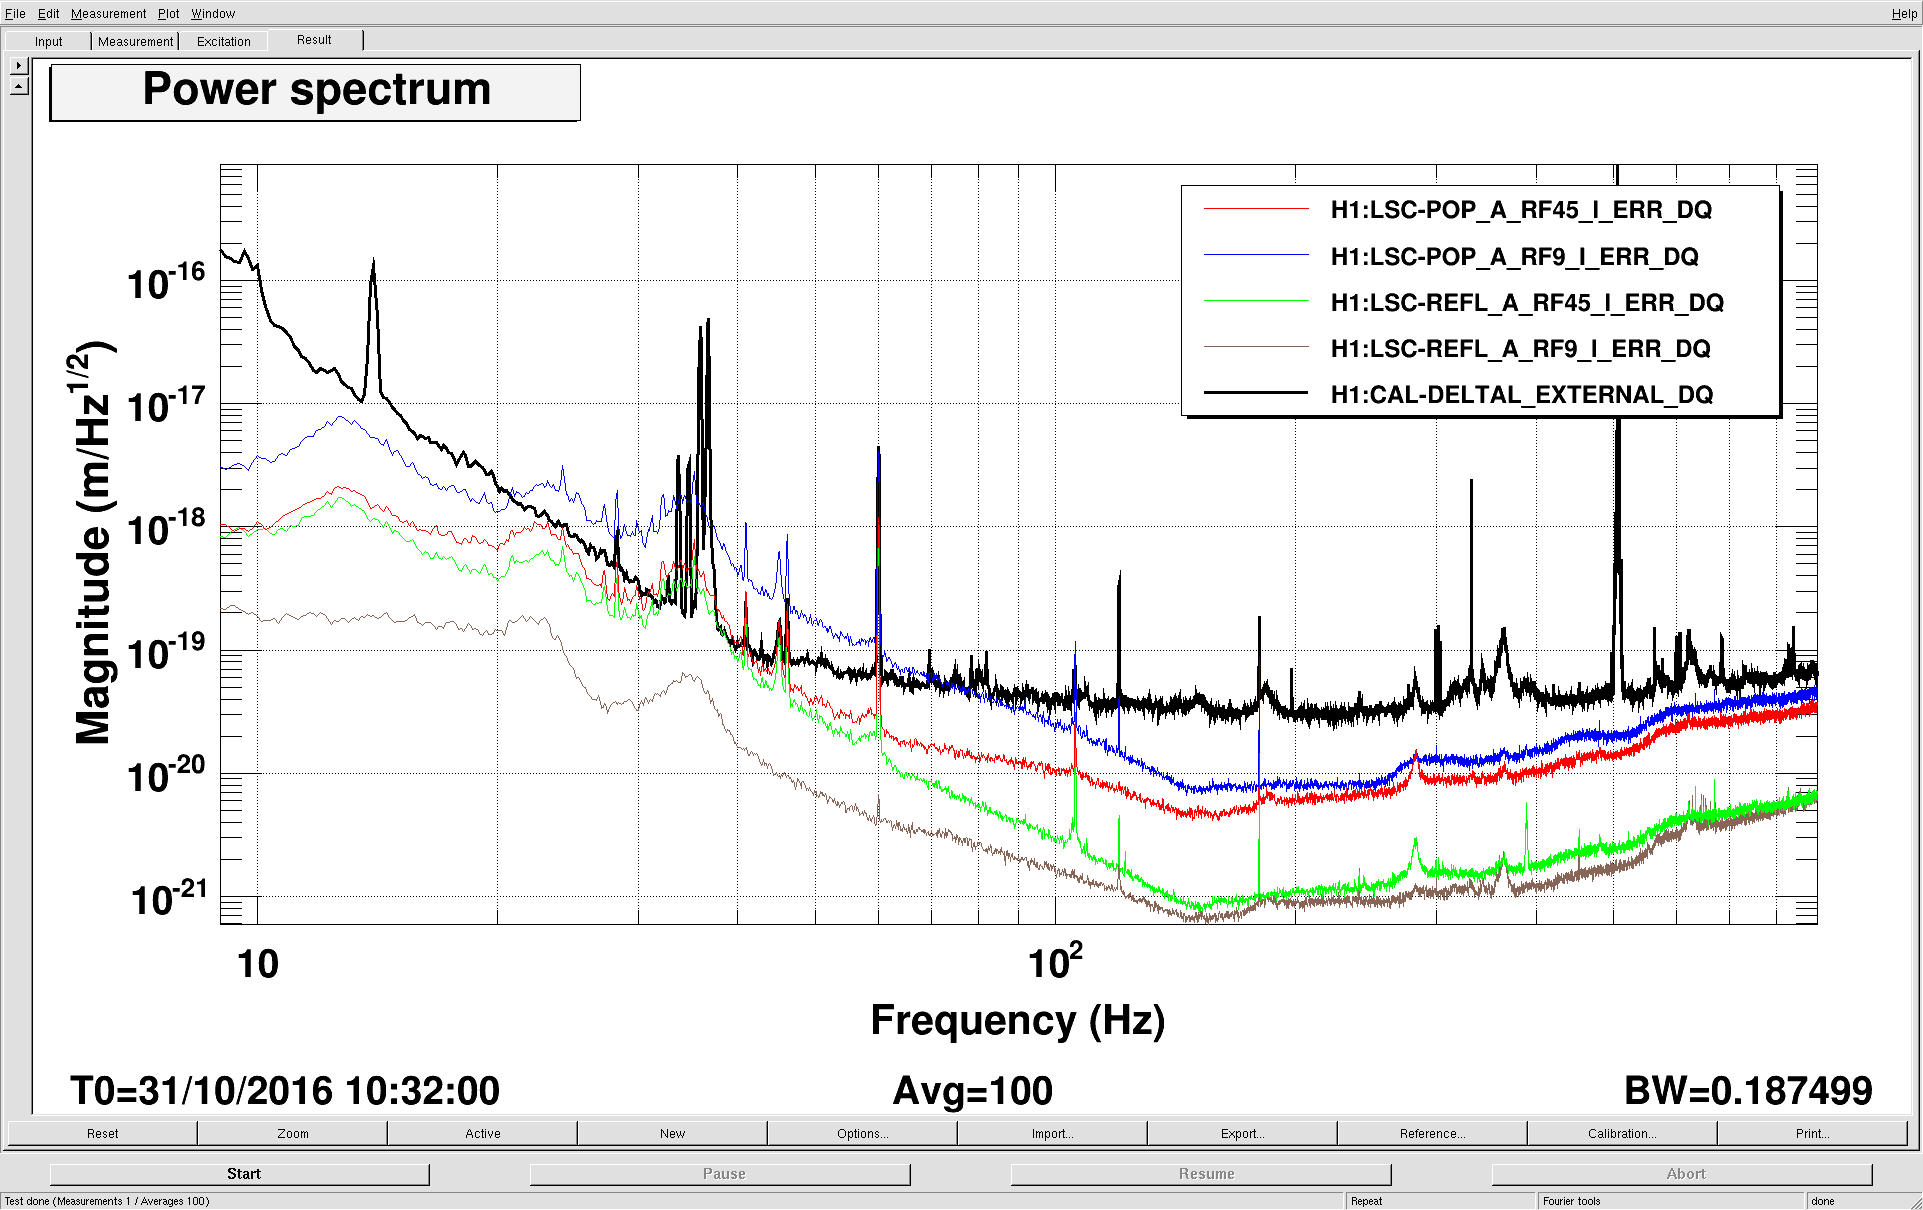
Since we didn't have the interferometer today, I stiched together some previous measuremnts of frequency noise and transfer function. In particular:
alog 30610: Out-of-loop frequency noise sensors (POP9, REFL45, POP45): Caveat: The alog only accurately calibrated them at high frequency - I suspect the sensor disagreement at low frequency is a deviation form the simple scalar calibration.
alog 29893: Transfer function in m/W (the template also has m/ct). Caveat 1: This was measured at 50W - need it at 25W, Caveat 2: The transfer function is known to vary, see alog 30440.
That said, I can ignore all the caveats for now (until we redo the measurments at 25W) and use the three out-of-loop frequency noise sensors to predict the DARM contribution. Specifically, I cast POP9, REFL45 and POP45 into REFL9 counts using alog 30610, and then apply the transfer function from aLog 29893. I woudn't trust the result better to about a factor of 3 - mostly because we don't have an accurate frequency noise calibration of those sensors at low frequencies. But the result is in the attached plot.
Clearly, this needs to be redone with more precision. But if this theory holds up, then what we are seeing is REFL9 sensing noise (due to scatter or donut jitter or something else), being imprinted on frequency noise, coupling to DARM.
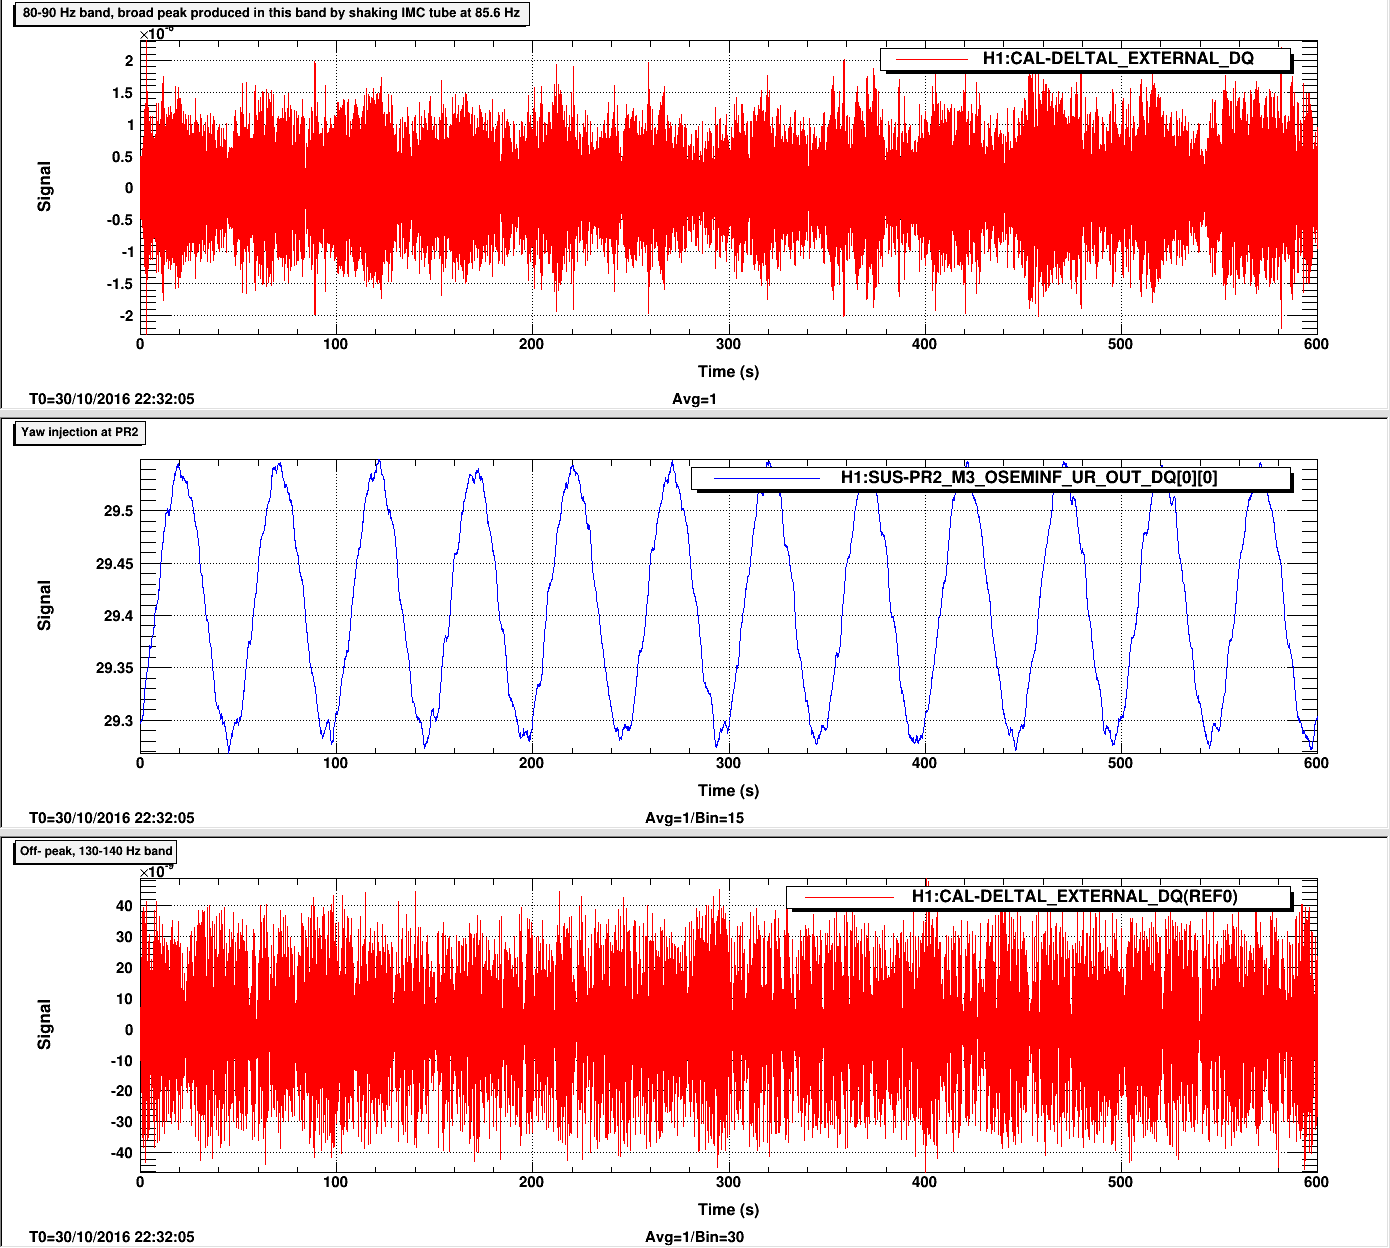
Over the weekend I wanted to try modulating PR2 in yaw, pitch, and length, as well as CPs, etc. to see the effect on shaking-enhanced scattering peaks. I haven’t got a chance to do more than the first of these yet but the attached plot shows that the peak in DARM did modulate with a slow yaw injection at PR2, while nearby parts of the spectrum did not. The plot suggests a better parking place, but the stationarity of the optimal yaw needs studying.
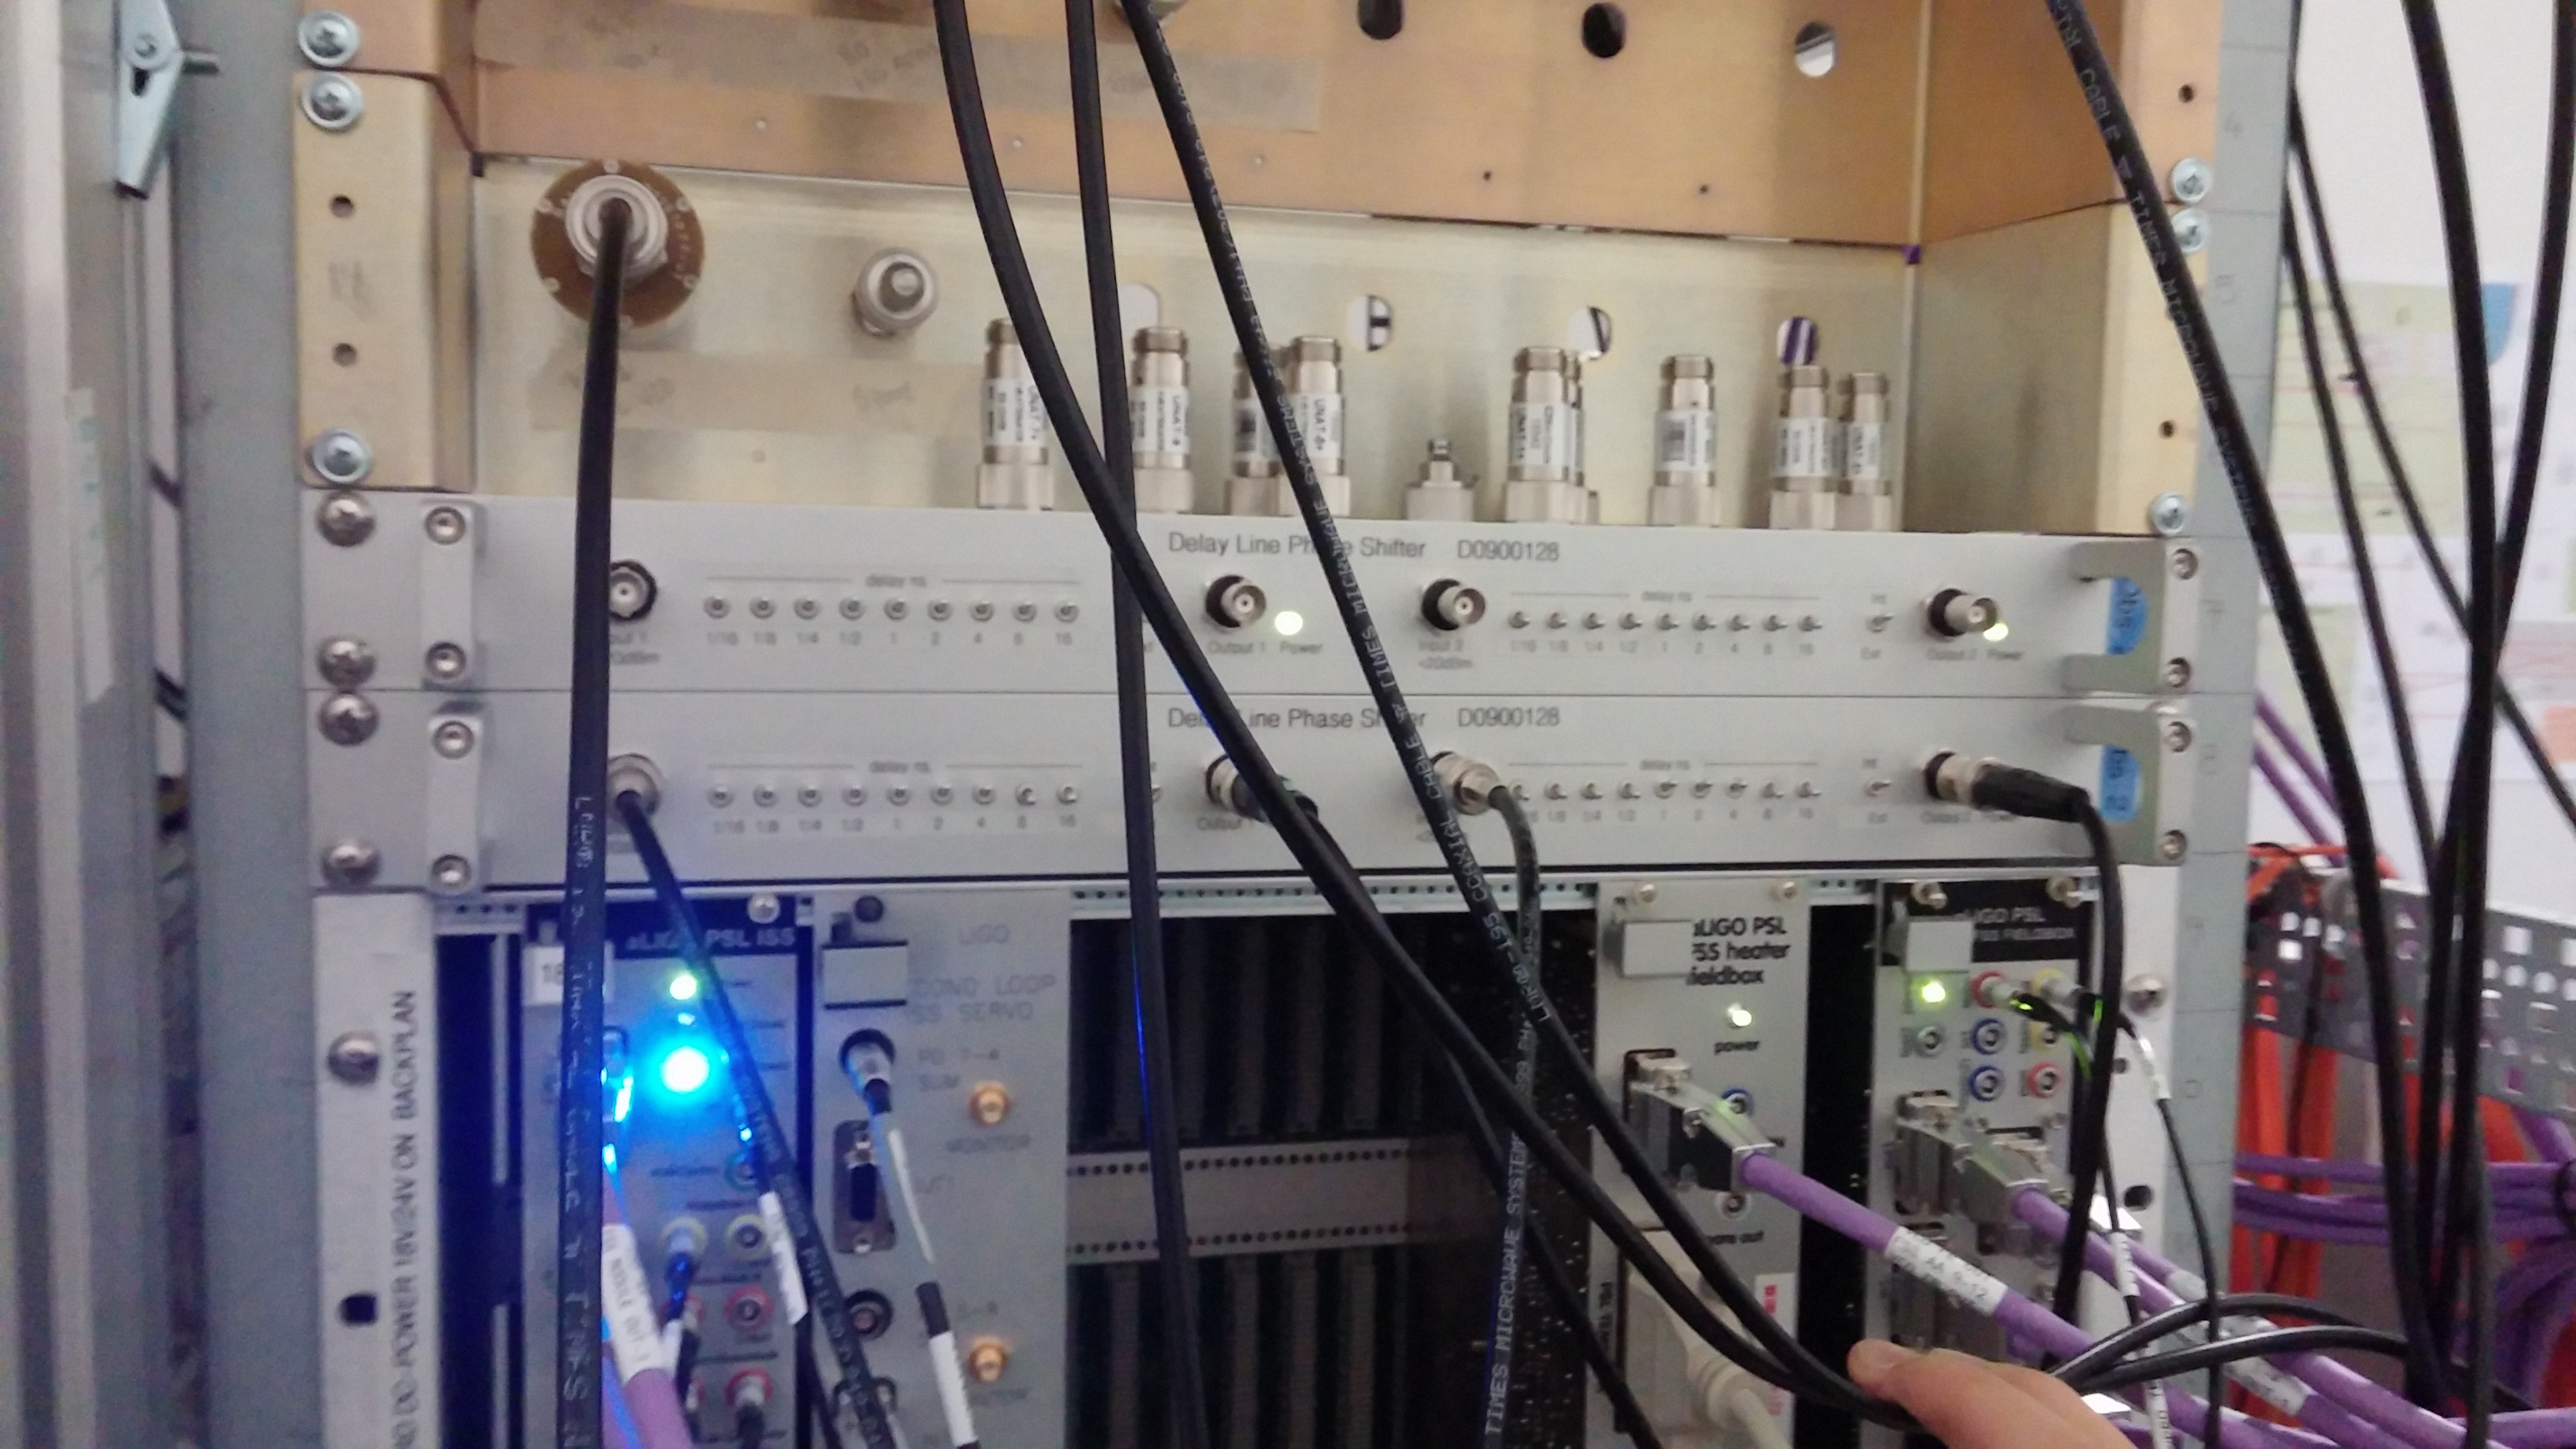
For both PMC locking and injection locking, servo board and field box board were modified as per FRS 6500 (FRS id=6500 and alog 31047).
After the modified boards went in, we removed the 20dB attenuator on the PSL rack RF patch panel for 35.5MHz for PSL EOM.
This seems bump up the ILS and PMC length locking optical gain by about a factor of 10 (for ILS the analog gain was changed to compensate).
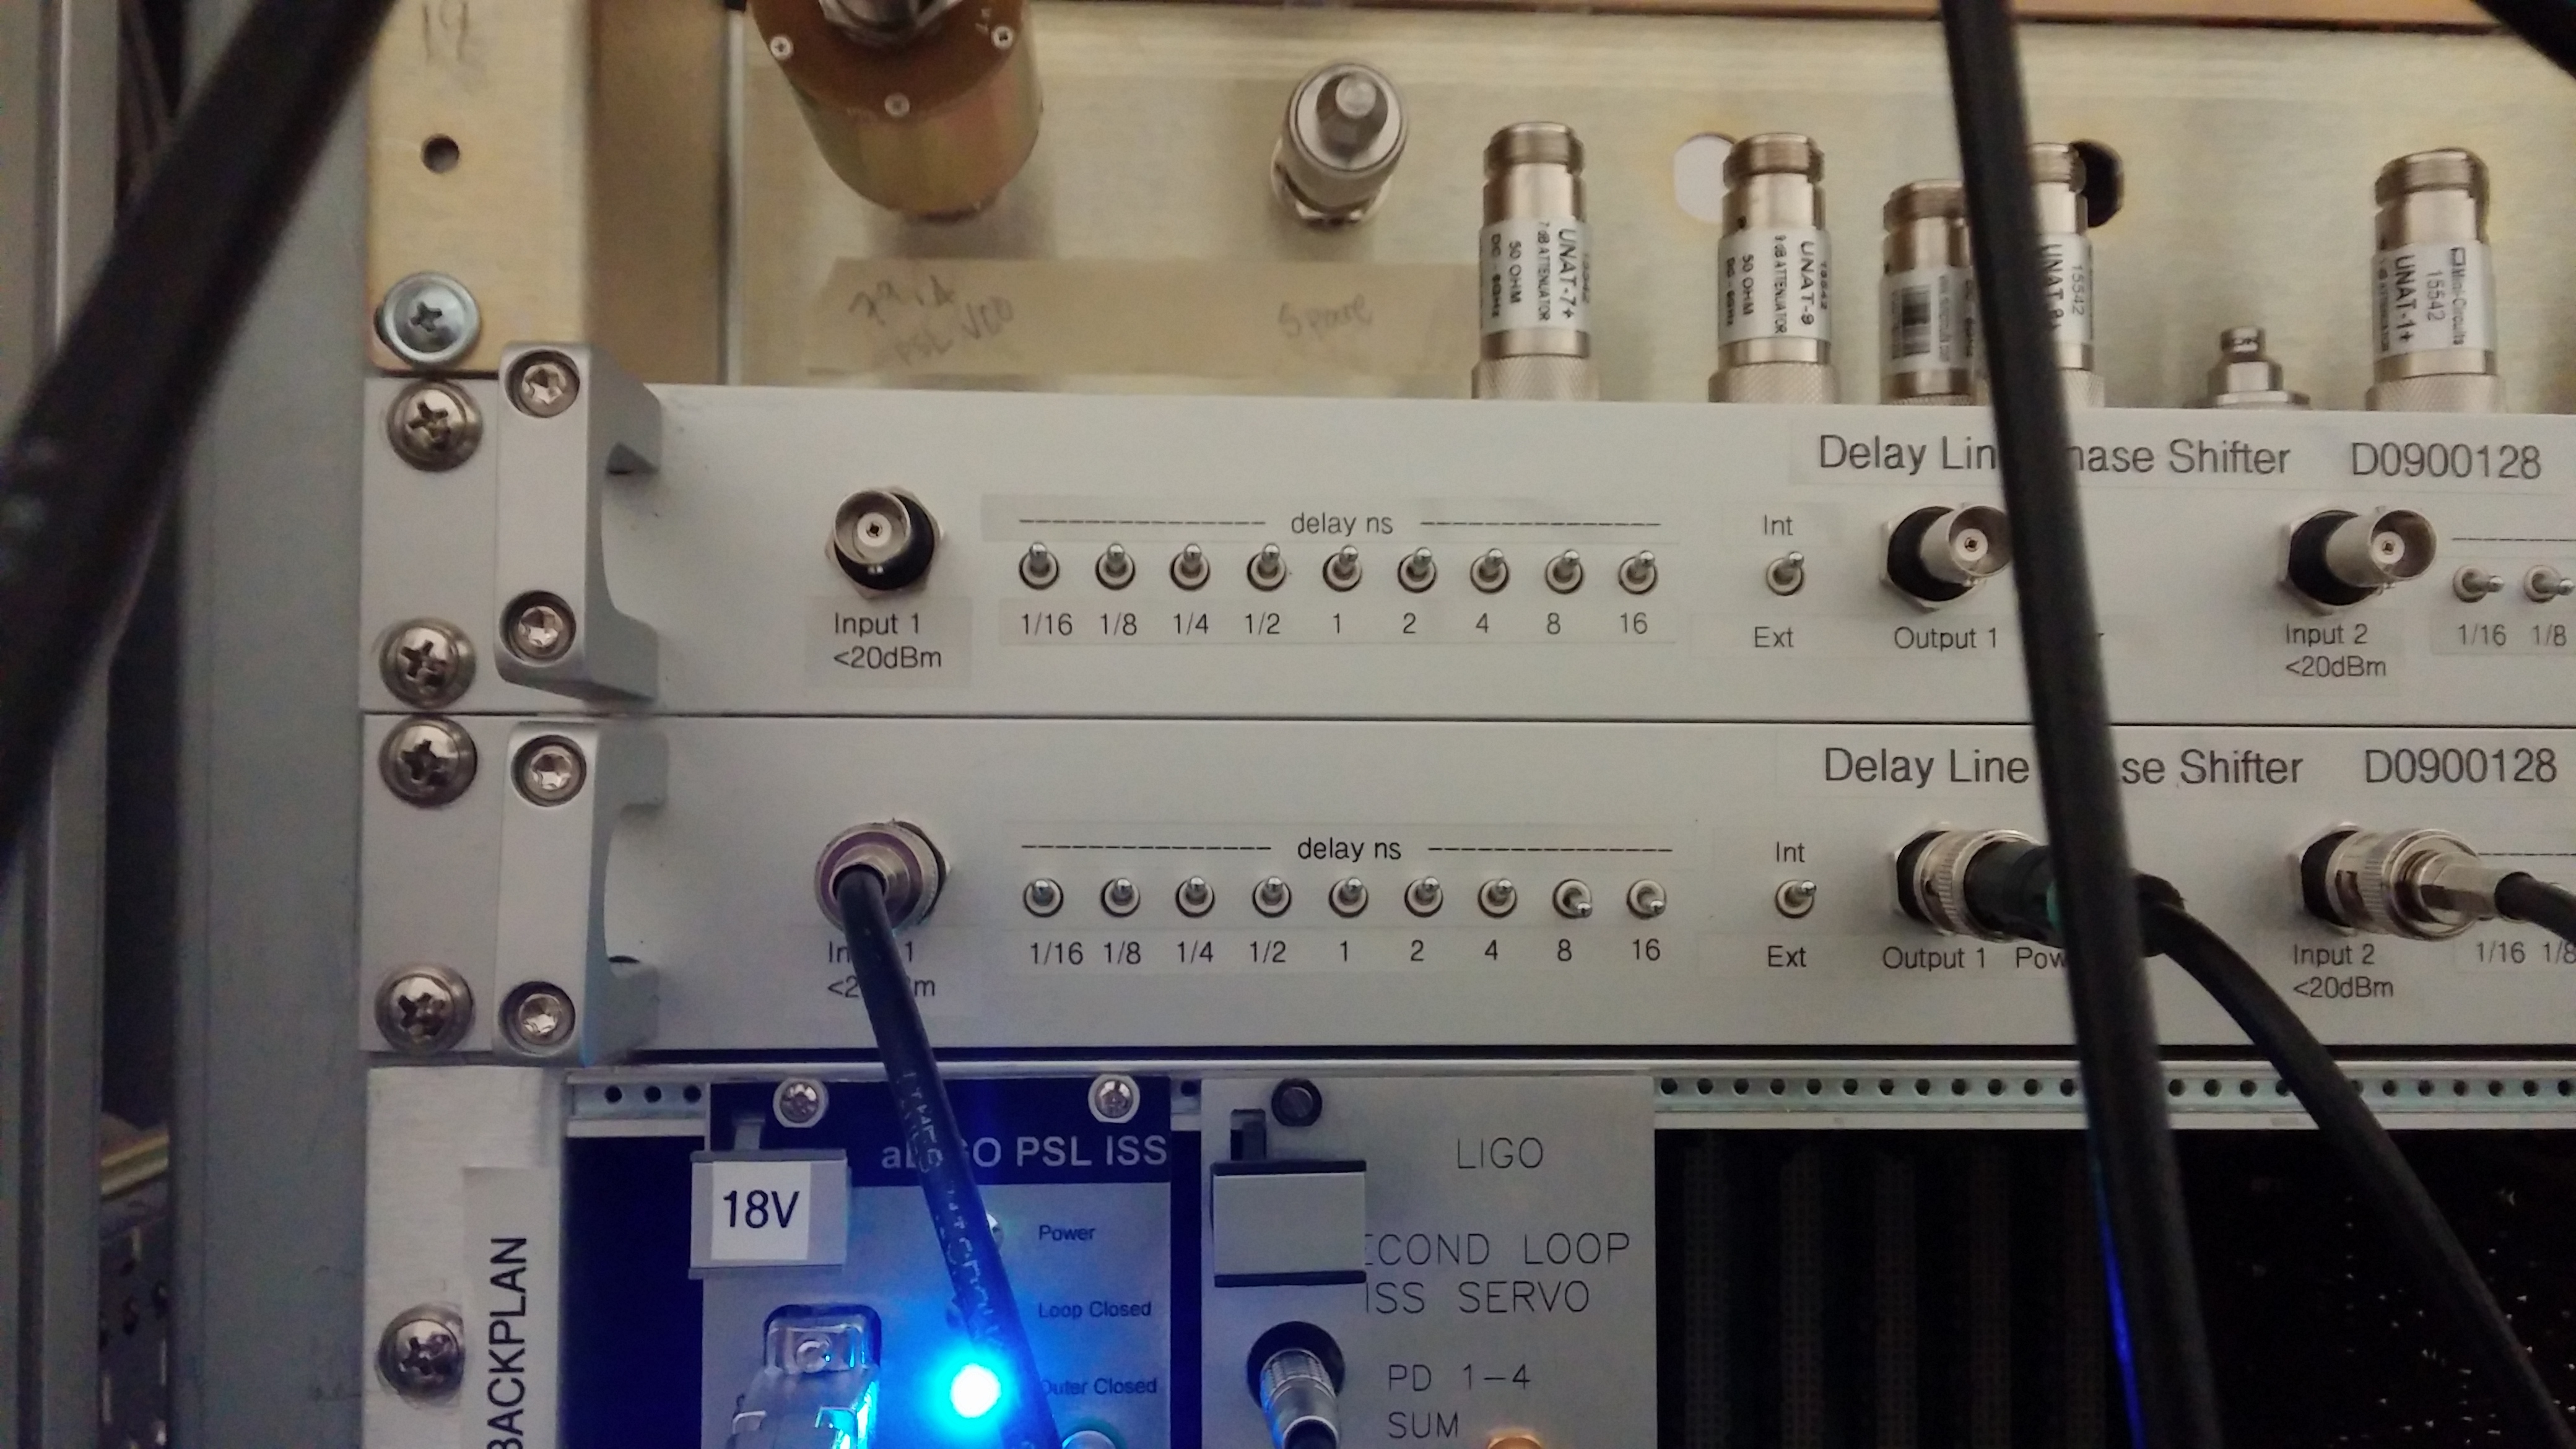
We also remeasured the demod phase for ILS and PMC length locking. For ILS we didn't see much change (1ns), but PMC was significant, we ended up changing 3ns, i.e. 39 degrees for 35.5MHz.
Demod setting are shown in the first two pictures, ILS (first attachment) and PMC (second). Third picture shows that the ILS is on the left bottom of the four delay lines, and PMC is on the right bottom.
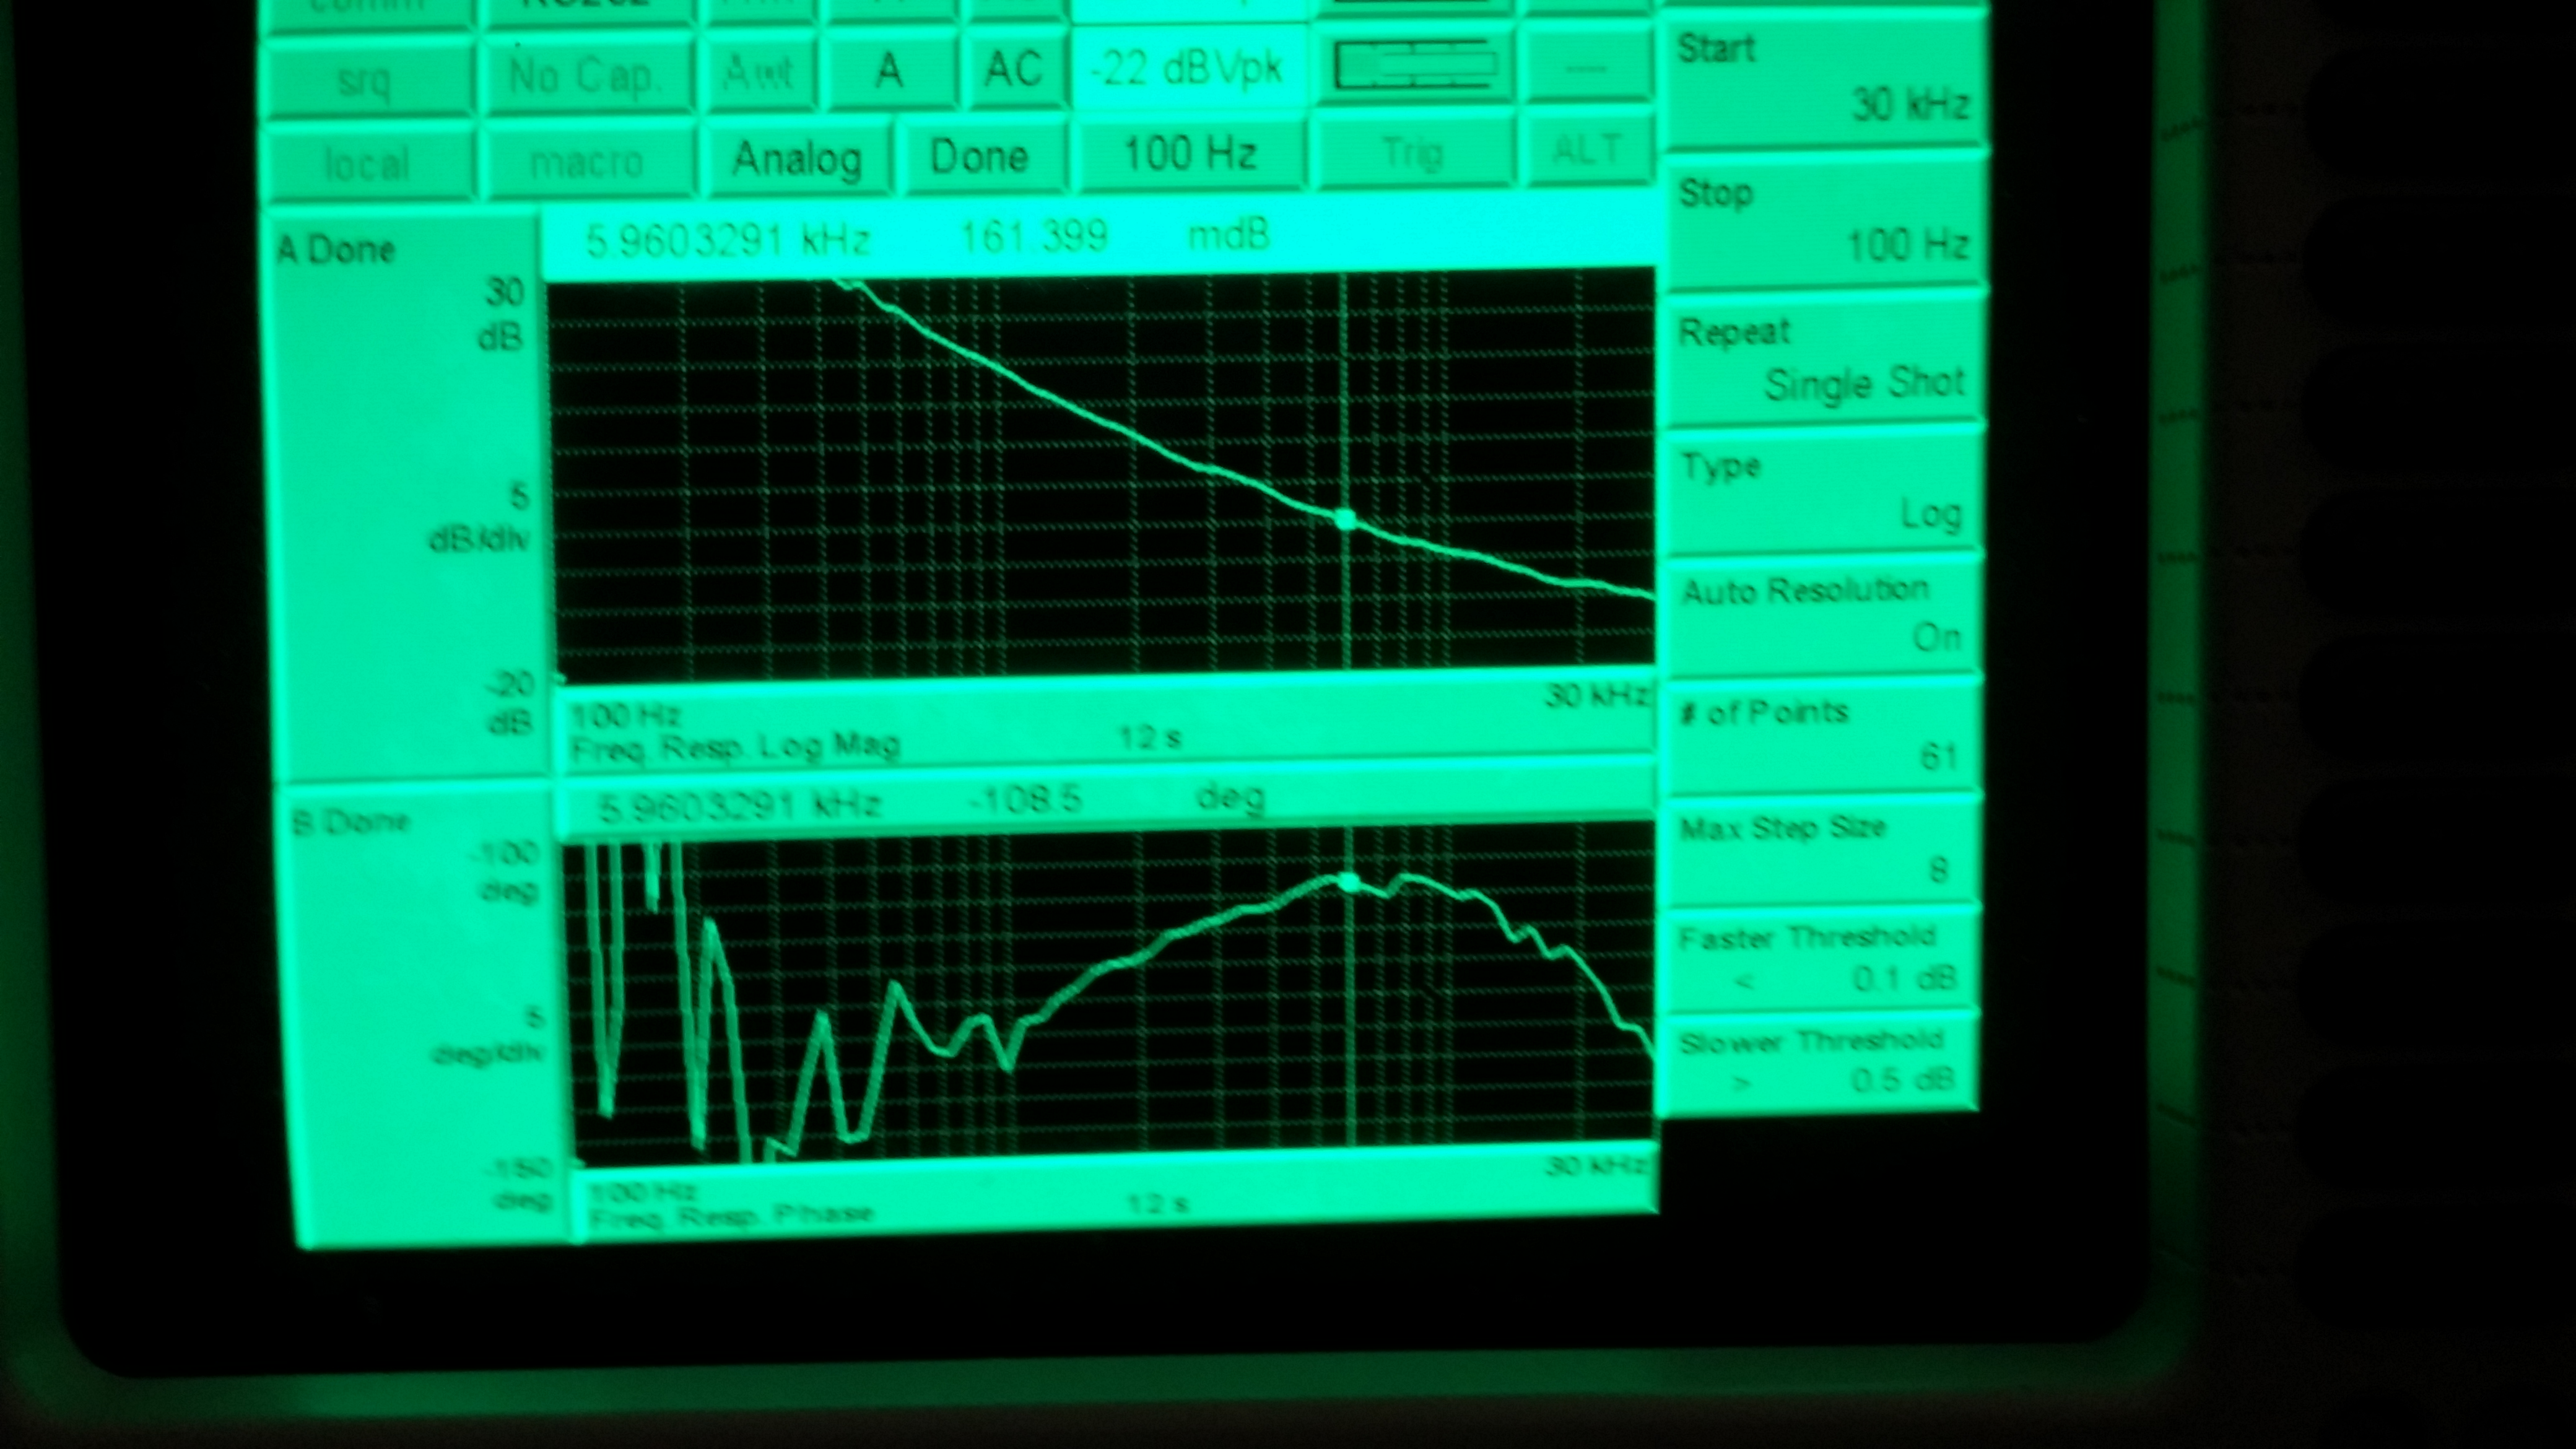
The fourth picture shows the OLTF of PMC that is pretty close to the one we have now. Note that UGF is much much higher than before simply because of the optical gain and the demod phase (might have to change).
Unfortunately the floppy for SR785 failed, so we'll remeasure the ILS loop gain again tomorrow.

Here are the spectra of HVMons and Mixer_out, both in counts at the input and in calibrated in Volts.
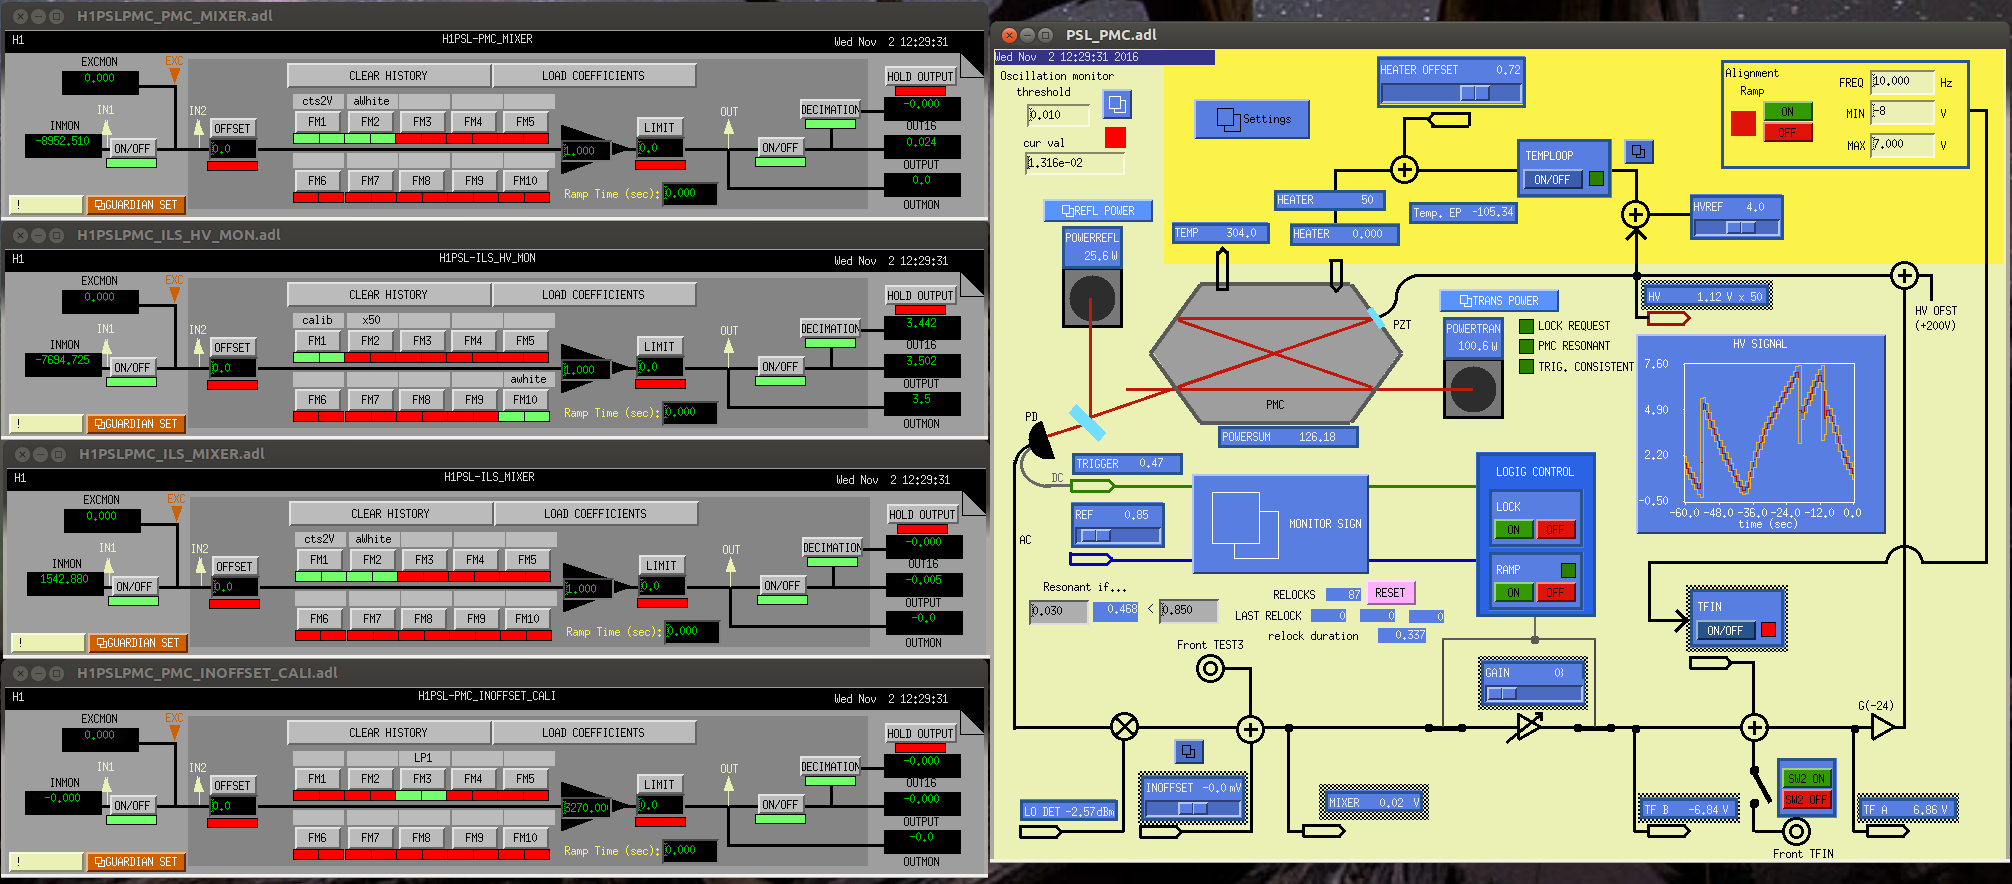
J. Kissel, for M. Evans, D. Sigg, K. Kawabe

With these electronics changes comes new compensation filters scattered throughout the PMC model, which has resulted in SDF differences.

The following filter banks now have new filters that have been accepted into the SDF system as ON:

H1:PSL-PMC_INOFFSET_CALI   FM3      "LP1"        zpk([],[1],1,"n")
H1:PSL-PMC_MIXER           FM2      "aWhite"     gain(-0.005)
H1:PSL-ILS_MIXER           FM2      "aWhite"     gain(-0.005)
H1:PSL-ILS_HV_MON          FM10     "aWhite"     zpk([100],[1],-1,"n")
Robert called from EY to info me that he was going into the VEA area near the BRS
I get a notification that Not all nodes arrived. Sheila had a look at the configuration and it seems that the BRS IS turned off and things look ok.
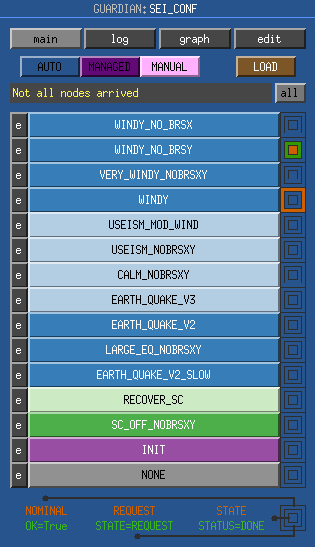
I switched to VERY_WINDY_NOBRSXY. There are two people out at end stations and both end station lights are on. No answer on the phone.
WP 6292
Installed Safety System Controls chasiss in MSR and LVEA chiller closet. Fiber is patched through MSR and LVEA patch panel (next to HAM 2). A new fiber was pulled from HAM2 to to the LVEA chiller closet. EtherCAT cable connecting to the EP1908 units (TwinSAFE digital inputs) was terminated. As of now, we are in a monitor state only.
(Patrick, Gerardo)
Degassed 2 nude ion gauges in the corner station, PT170 and PT180. We did the degassing twice since the first time the degassing was terminated too early for both gauges, we sent second command before the 3 minutes were up, and it turns out that if you do send the command degassing stops. As usual pressure went up to 10-07 torr for both gauges while degassing then, trended down after.
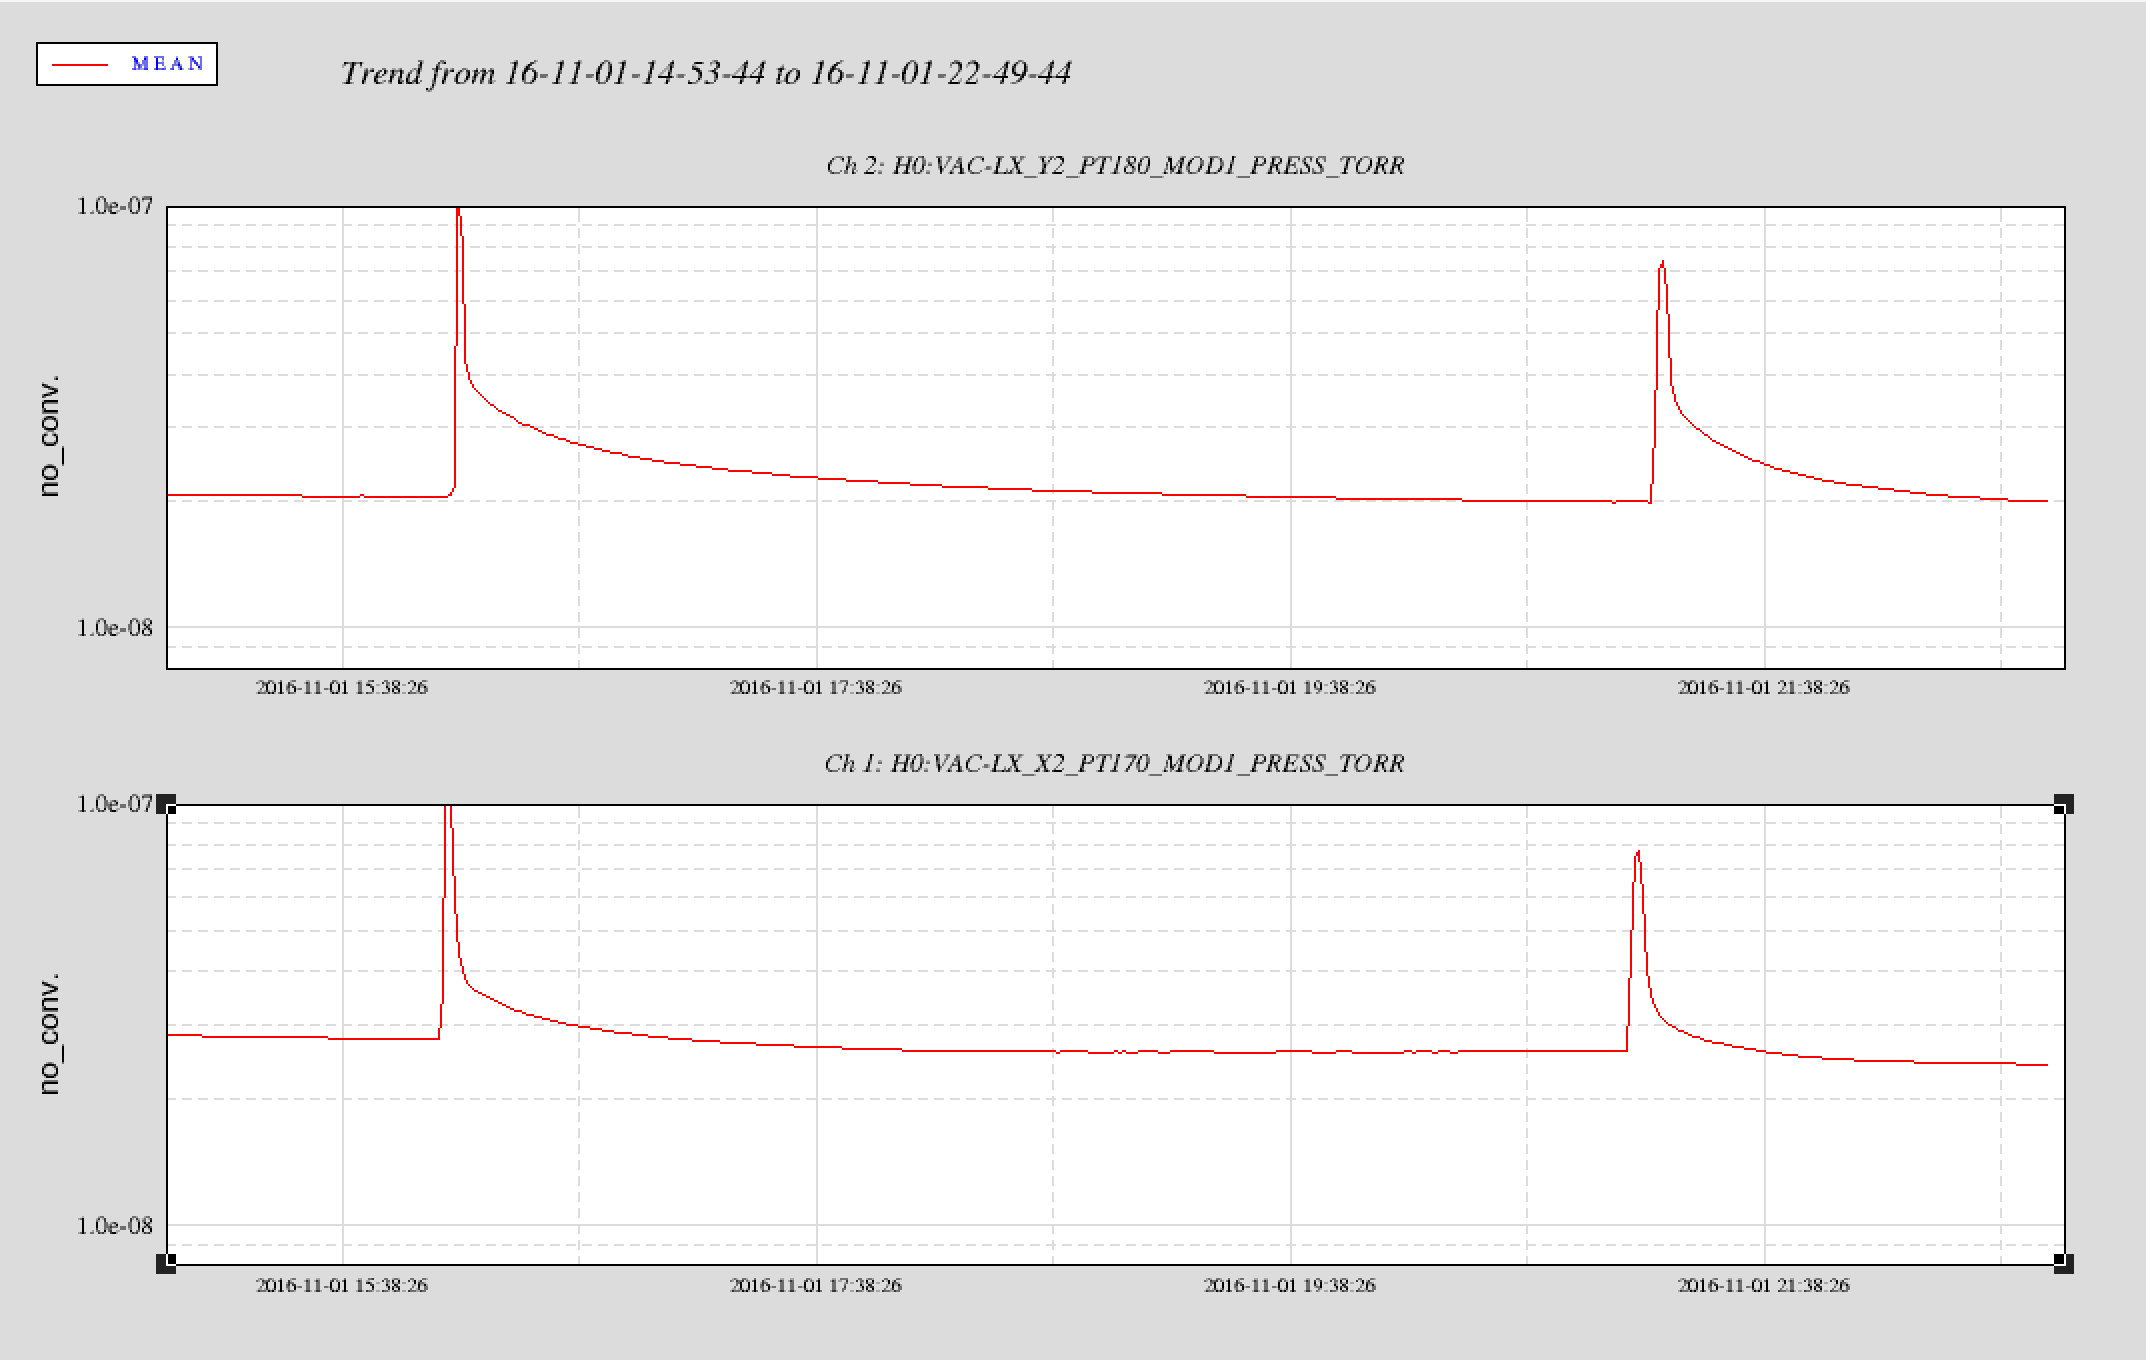
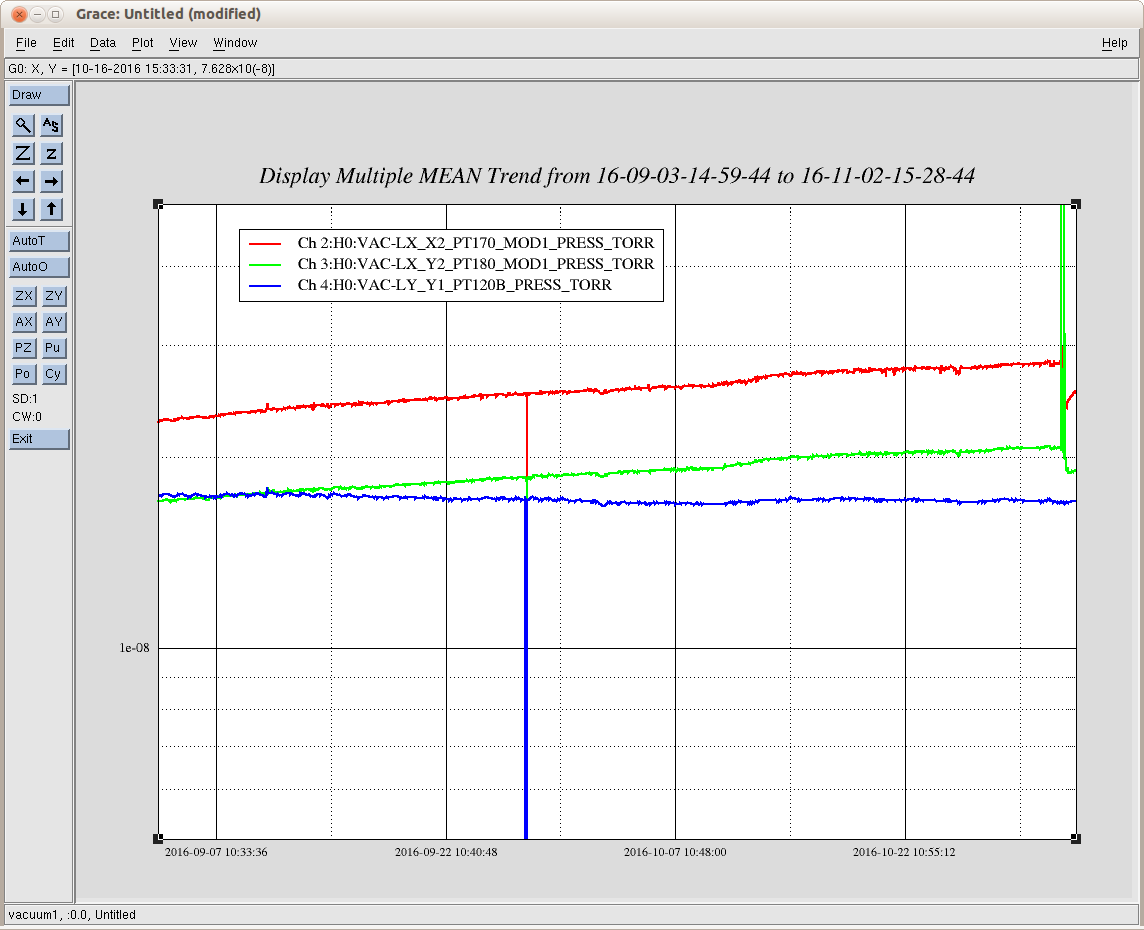
Trends for Inficon gauges PT170 and PT180 (BSC7 and BSC8) over 60 days, compared to the signal from PT120B (BSC2) using a MKS HPS 903 inverted magnetron cold cathode.
Note that PT120B trend has been shifted up to compare slope of signals, the other trends remain unchanged.
Did not receive expected Grace test alert. Did receive SNEWS test alert at 16:03 UTC. TCSY laser tripped off around 15:52 UTC, cause unknown. Attempt to add an ADC card to h1oaf brought down the dolphin network and the TCS chillers. Bad Beckhoff terminals in corner chassis 3 found and replaced. Currently waiting for PSL work to complete.

Peter K in PSL enclosure
14:35 UTC Bubba to end X and end Y with Apollo to look at sensors. I set ISI config to VERY_WINDY_NOBRSXY.
14:37 UTC Hanford phone call notification of siren testing in 100K, 200E, 200W and 400 areas.
15:01 UTC Set IMC guardian to DOWN to disable MC locking per Peter's request
15:06 UTC Karen to end Y to clean
15:13 UTC Chris to escort pest control company to LVEA
15:23 UTC Mark P. to CER (WP 6246)
15:31 UTC Notification of remote login (Carlos)
15:32 UTC Jeff B. to LVEA West bay to look for 3IFO part and then to HAM3 clean room curtains
15:39 UTC Kyle to end X to run RGA scan
15:40 UTC Jim W. to end Y to recenter BRS
15:43 UTC Hanford phone call notification that siren testing is complete
15:43 UTC Joe to LVEA (eye wash stations, batteries)
15:46 UTC Jason to PSL enclosure
16:03 UTC SNEWS alert (test)
16:05 UTC Mat cleaning company through gate
16:09 UTC Gerardo and I finished degas of PT170 and PT180, but turned off the degas too soon.
16:22 UTC Gerardo to end X (WP 6290)
I restarted frozen video0
16:32 UTC Karen done at end Y
16:35 UTC Filiberto running fiber from HAM2 to chiller closet
16:35 UTC Betsy to LVEA West bay to store item on shelf and then to optics lab
16:45 UTC Kiwamu to LVEA to check TCSY front panel to diagnose laser trip
Dave to take down h1oaf frontend to add ADC card to IO chassis (WP 6287)
17:01 UTC LN2 delivery through gate
17:06 UTC Pratt electronics delivery for Richard through gate
17:07 UTC Betsy done
17:10 UTC Karen to LVEA to clean
17:12 UTC Joe done
17:14 UTC Hugh to end stations for weekly HEPI maintenance
17:20 UTC h1oaf frontend down. Dave to CER to add ADC card.
17:22 UTC Jeff B. done
17:25 UTC Pest control company done
17:45 UTC Jim W. back
17:48 UTC Richard to CER to check on Mark and LVEA to check on Filiberto
17:58 UTC Dave and Jim done in CER. h1oaf took dolphin network down.
18:07 UTC Bubba taking Apollo to LVEA to look at sensors
18:09 UTC Joe back to LVEA
18:10 UTC Dave and Jim removing ADC card that was added to h1oaf IO chassis
18:29 UTC Mark and Filiberto pulling Beckhoff corner chassis 3 from rack
18:32 UTC Ryan patching alog
18:33 UTC Dave rebooting guardian machine
18:39 UTC Hugh back
18:39 UTC Joe done
18:41 UTC Jeff restarted TCS chillers
18:43 UTC Hugh to HAM2 to plug STS2 back in
18:49 UTC Dave to end X
18:53 UTC Hugh back
18:54 UTC Chris opening rollup door for cardboard
19:11 UTC Gerardo done
19:12 UTC Dave back from end X
19:38 UTC Cheryl opening/closing ALS shutters from new medm screen
19:51 UTC Jim W. to end Y
20:32 UTC Set ISI back to VERY_WINDY_NOBRSXY again from INIT.
20:32 UTC Hugh taking HAM2 down
20:58 UTC Jim W. back
21:02 UTC Mark P. to mid Y to get parts
21:05 UTC Started degas of PT170
21:09 UTC Kyle back
21:10 UTC Stopped degas of PT170
21:11 UTC Started degas of PT180
21:15 UTC Stopped degas of PT180
21:47 UTC Mark done fixing Beckhoff chassis 3. TCS chiller flows are back.
21:51 UTC Gerardo to LVEA to turn on TCS lasers
21:58 UTC Filiberto to LVEA to continue WP 6292
Compressors #1 and #2 were greased and pressure tested.
Compression test results: #1 at 135 psi, and #2 at 125 psi.
All compressors and electrical motors were greased.
Replaced the pressure relief valve for compressor #2, the valve for compressor #1 was OK and it passed its test.
All compressor assemblies were run tested after service was performed.
Work performed under WP#6290.
WP6288 Dave, Jim:
We cleanly power cycled h1iscex and its IO Chassis this morning between 11:45 and 12:06 PDT. We were not able to reproduce the slight offset on an ADC channel (see attached). Note this channel is actually only seeing ADC bit-noise, so the offset is in the micro-volt level.
Sheila,.Jeff, Ed
This was an attempt to fix the drop in green arm power that happened last sunday. 30884
Since it didn't work, operators will continue to see that green power from the X arm is low.
If this can't be fixed, we can just rescale the normalization.
BRSY has been continuing its slow drift off of the photodiode, and was about 2-300 counts from the edge, so this morning I went to EY to try to recenter it. I think I was successful, but will need a couple hours to tell. Right now it's still rung up pretty bad, so we will need to wait for it to damp down on it's own a bit before trying to re-engage it. For now, operators should use one of the seismic configurations that doesn't use BRSY.
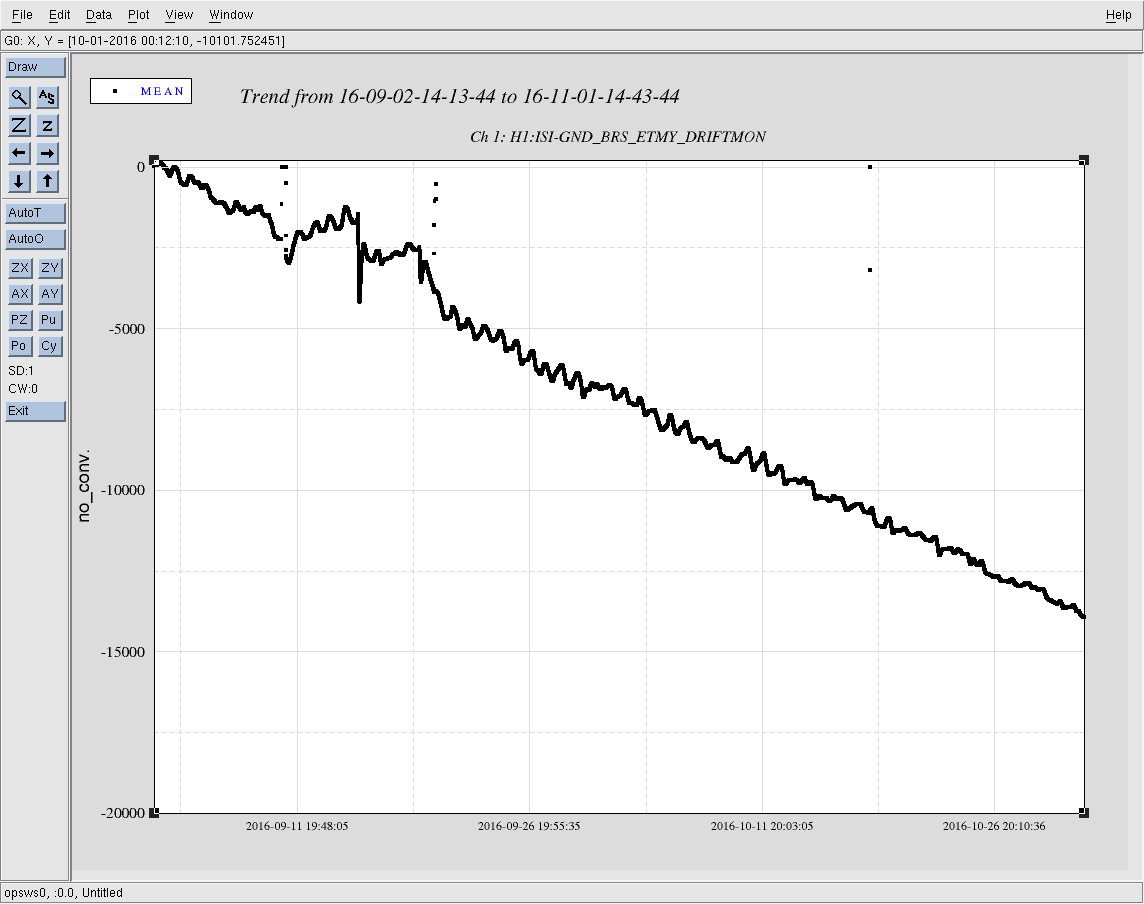
Looks like BRSY is closer to center now (at ~ -3000) than before, but given the current drift of ~1500 cts/week I didn't get as much margin before the next adjustment as I'd prefer. Will probably have to do this again in ~2 months.
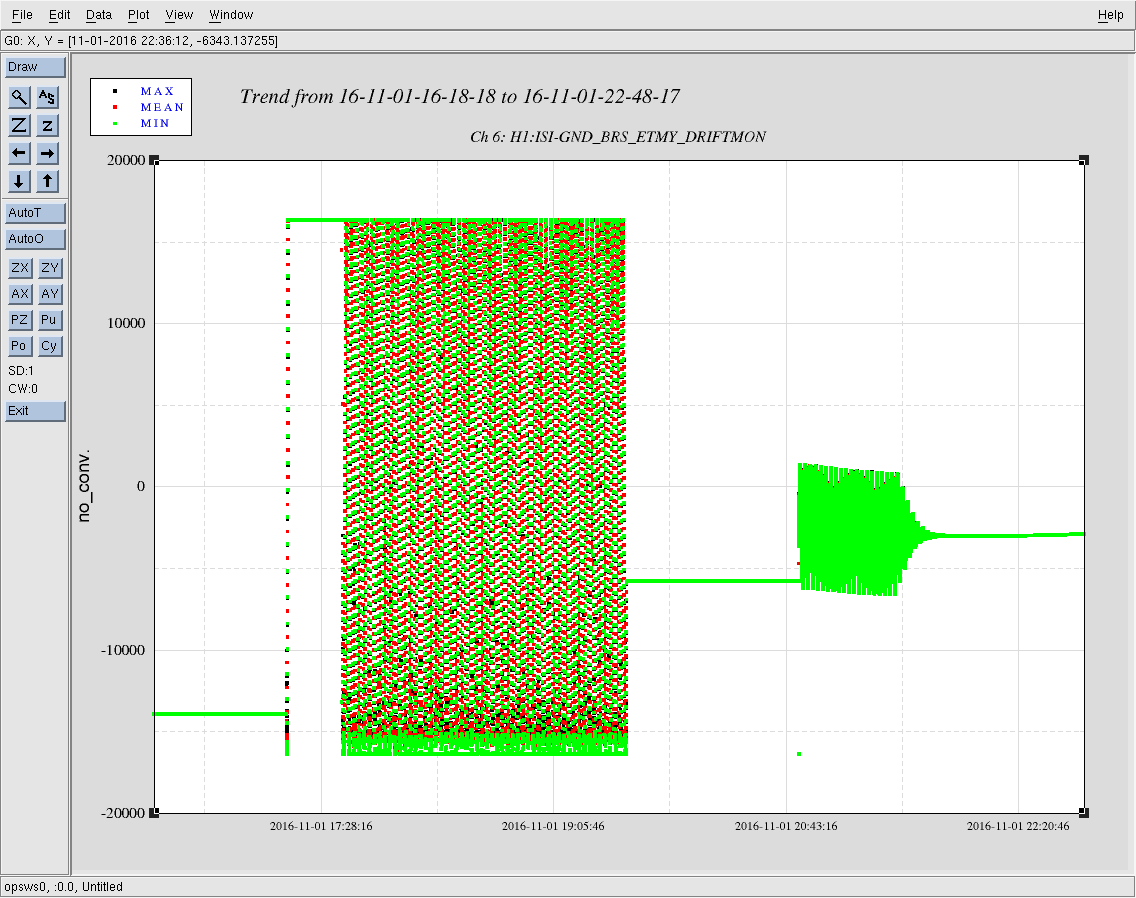
Remember it will probably drift up because of the slow thermal equilibration for the next 1-2 days, probably ending up above 3k counts. I think that is very good. Good job, you have mastered the BRS!
