This will reduce unnecessary HEPI slow system movement. This movement could be causing creek and maybe slow albiet minor alignment changes.
When both the ISI and HEPI Isolation loops are closed, the first step is to measure the free hanging position so the loop starts with zero DC shift. Once the loop is fully engaged, the "Target Reference Location" is ramped into the loop to put the alignment of the platform to a repeatable place. This restoration of position happens for all HEPIs and the HAM ISIs. The BSC ISIs do not restore a Target position; no evidence to show now, but we don't see large shifts or wanderings of the BSC ISI positions.
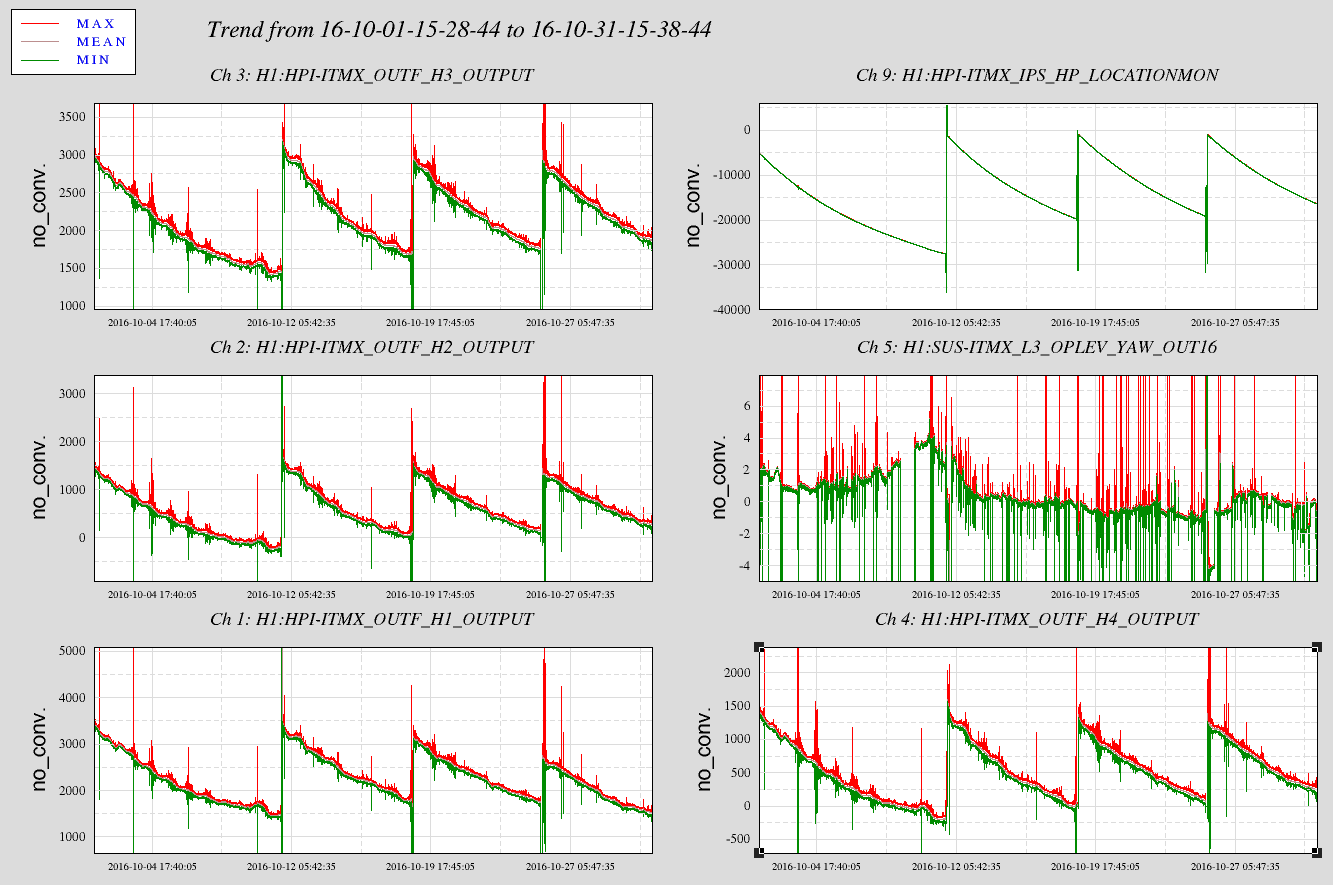
Okay, for the HEPIs, the Vertical and Horizontal Pringle modes are overconstrained dofs of the HEPI platforms--8 actuators with 6 degrees of freedom. As such these isolation loops are not DC coupled as are all the other dofs X Y Z RX RY & RZ. As such though, the restoration of a Target position into the AC coupled loop puts a large step into the loop and drives. Attached are 30 day trends showing four ITMX HEPI trips. The large step up on the horizontal Actuator drives are the restoration of the old target position of 900nm (upper right trace.) This HP measurement is literally a distortion of the platform, some taken up by the soft Actuator connection and some by actual stress in the platform. I would be most worried about yaw alignment shifts but there are none evident in the optical levers. Given the length of this trend plot though, most of the optical lever data here may be in-loop. There is probably some ASC output I could trend for that.
The bottom line is that since these are AC coupled loops and over some time, the offsets are AC'd out of the loop, why put them in in the first place. Start the loop in the free hanging location like all loops and let this AC loop slowly go where it will. We don't expect them to go much of anywhere. Just avoid the potential problems no matter how minor.
I propose all HEPI Pringle loops be removed from the Target location restoration list (Guardian chamber edits.) This has been discussed in the weekly SEI subsystem call and principals agree.