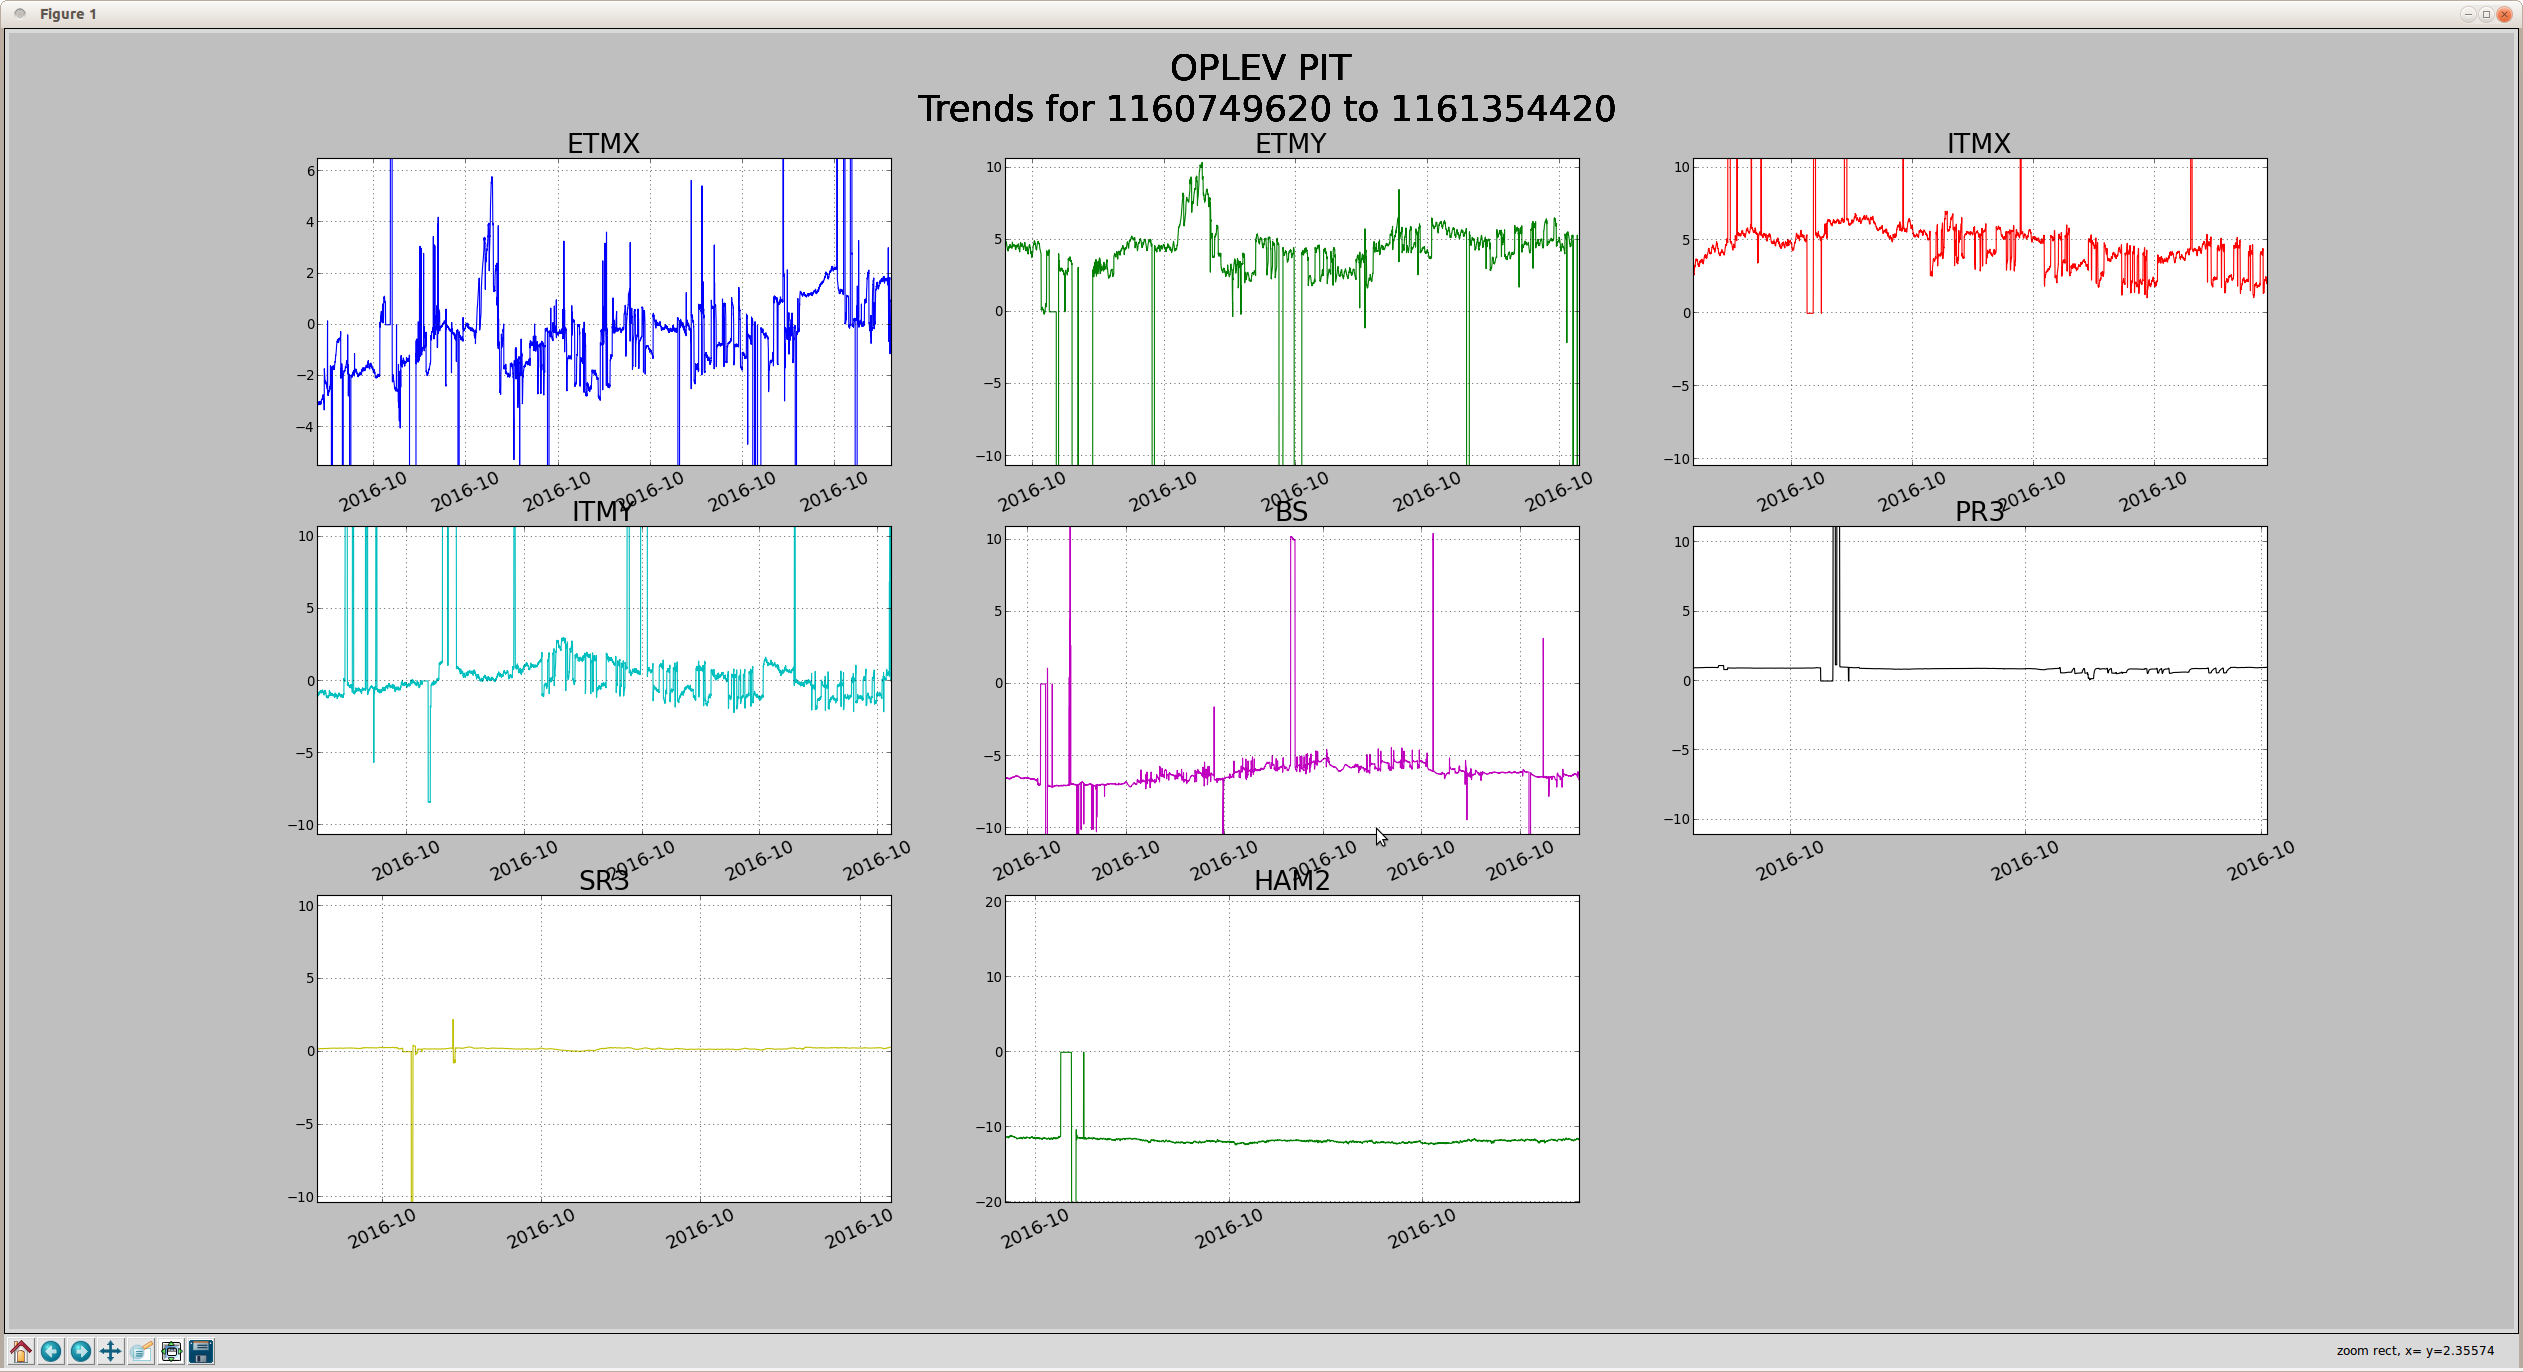
Keita, Sheila, Kiwamu
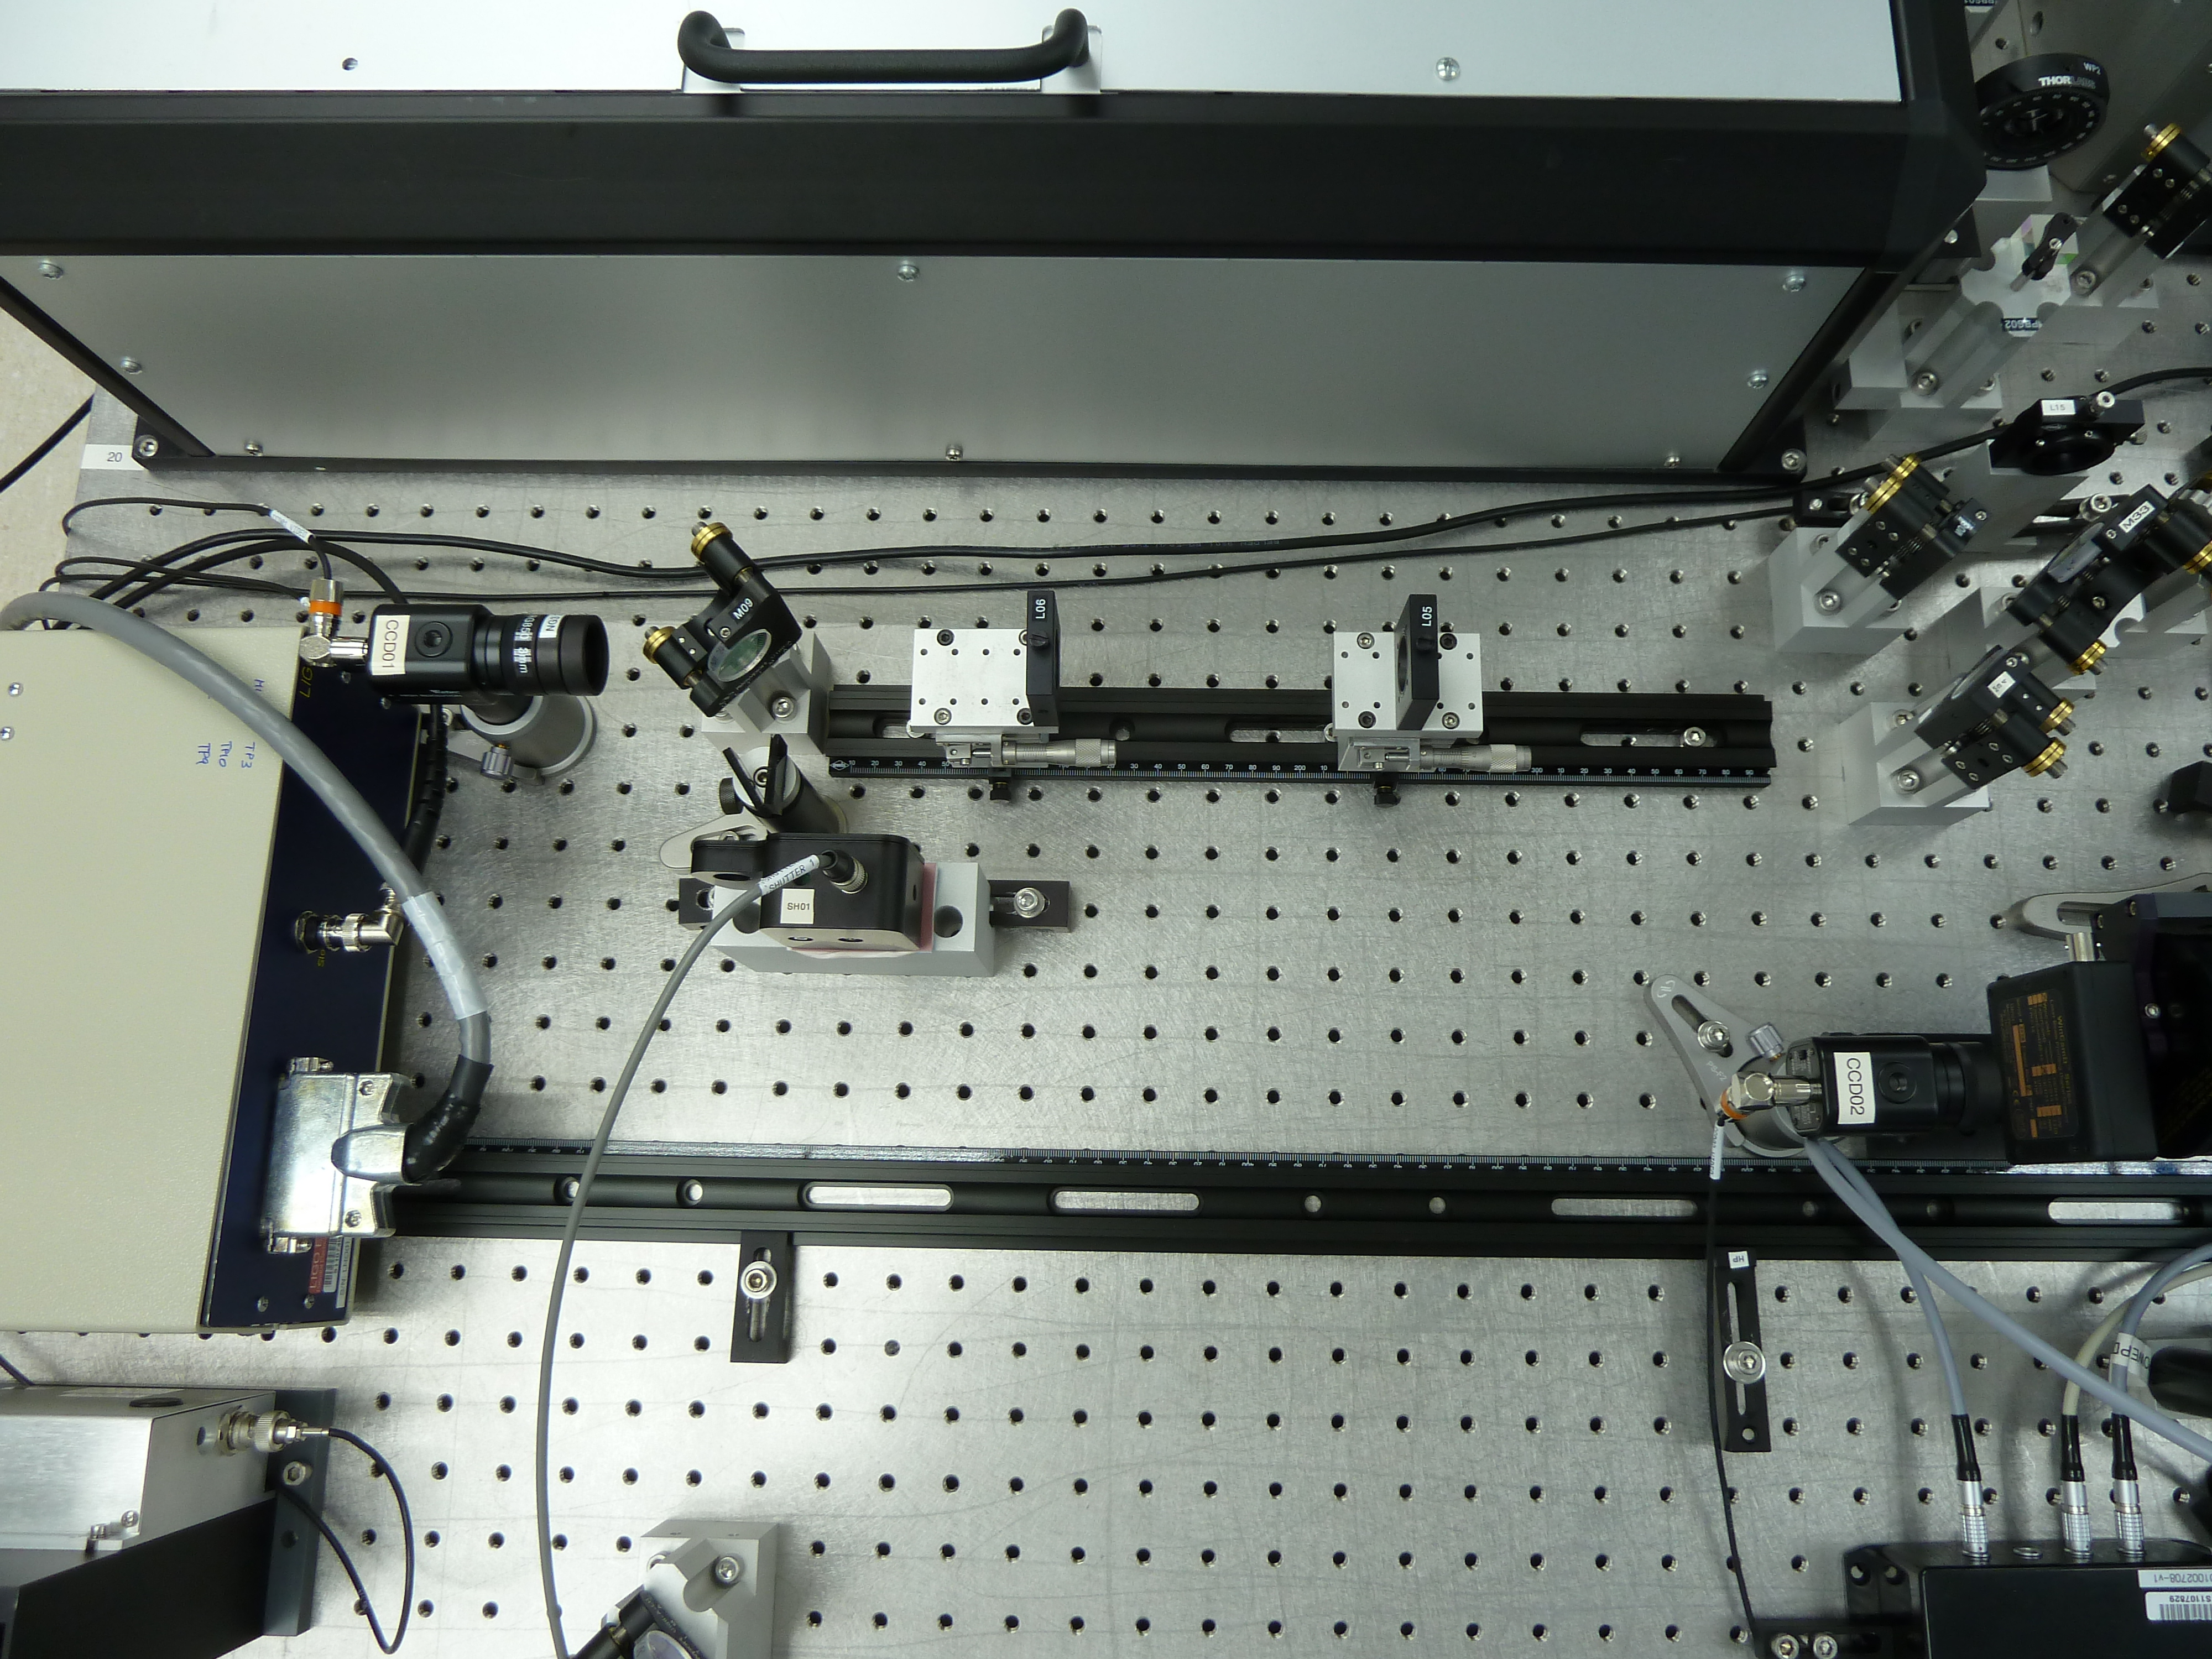
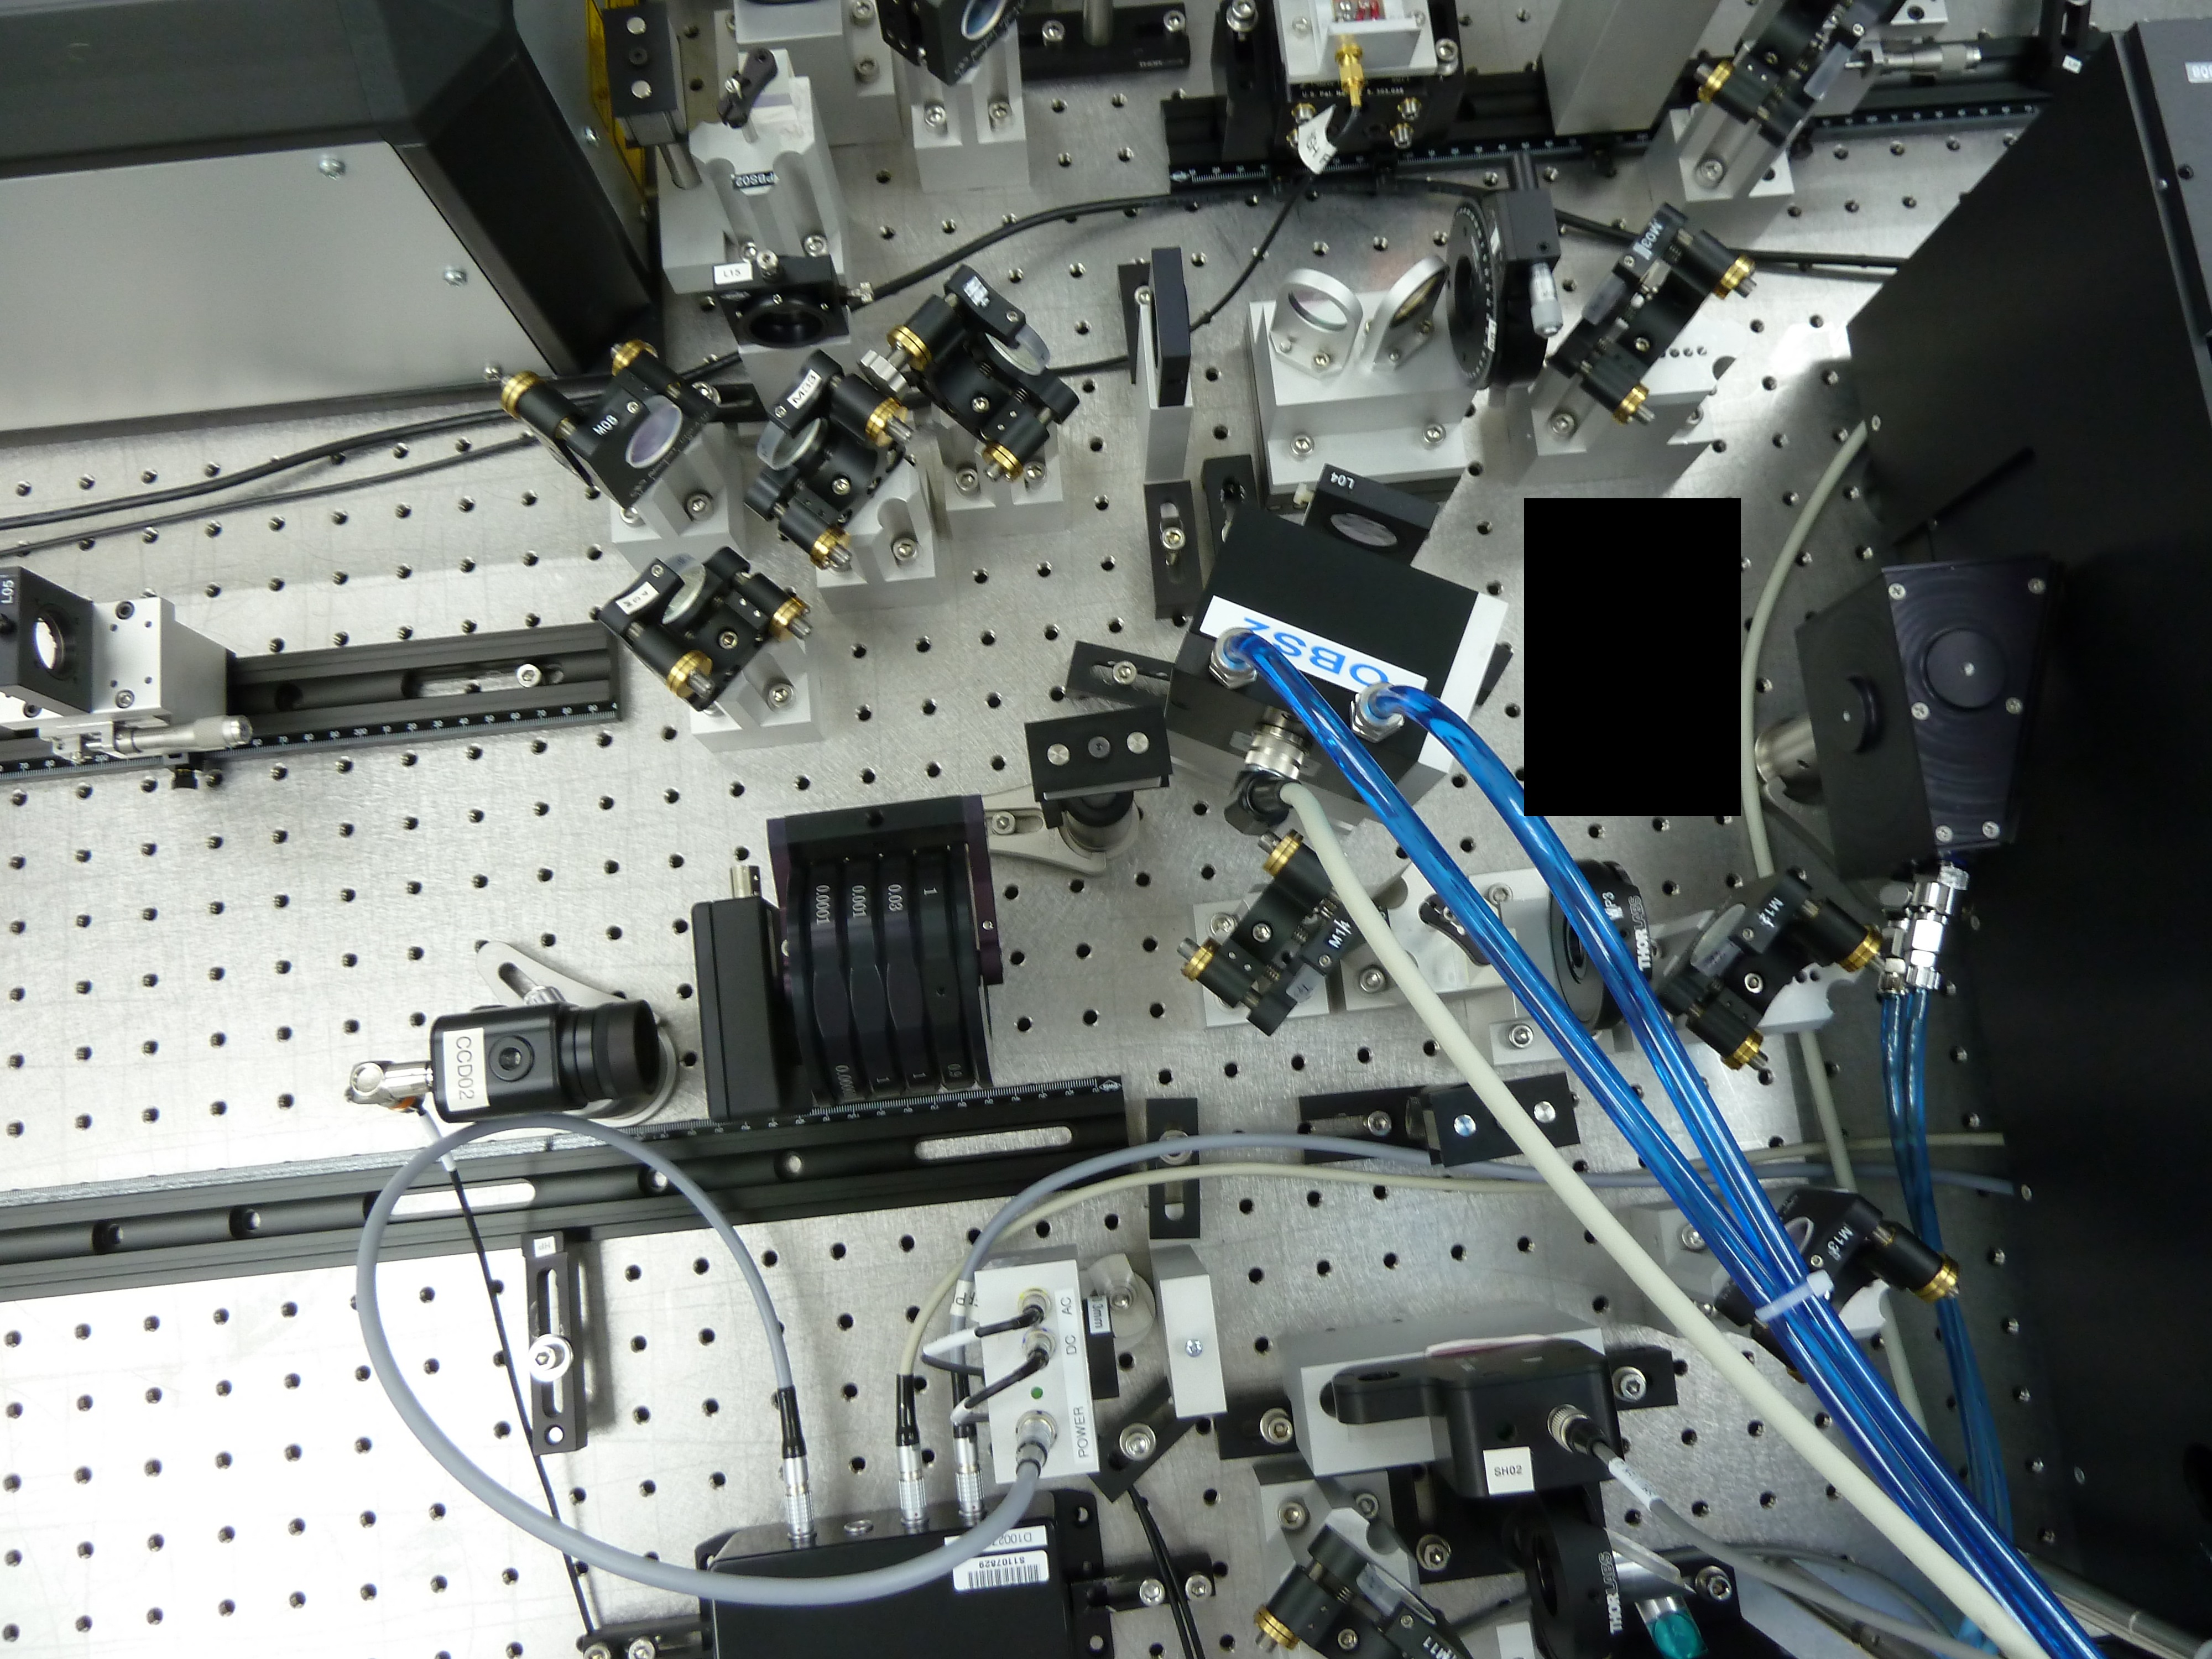
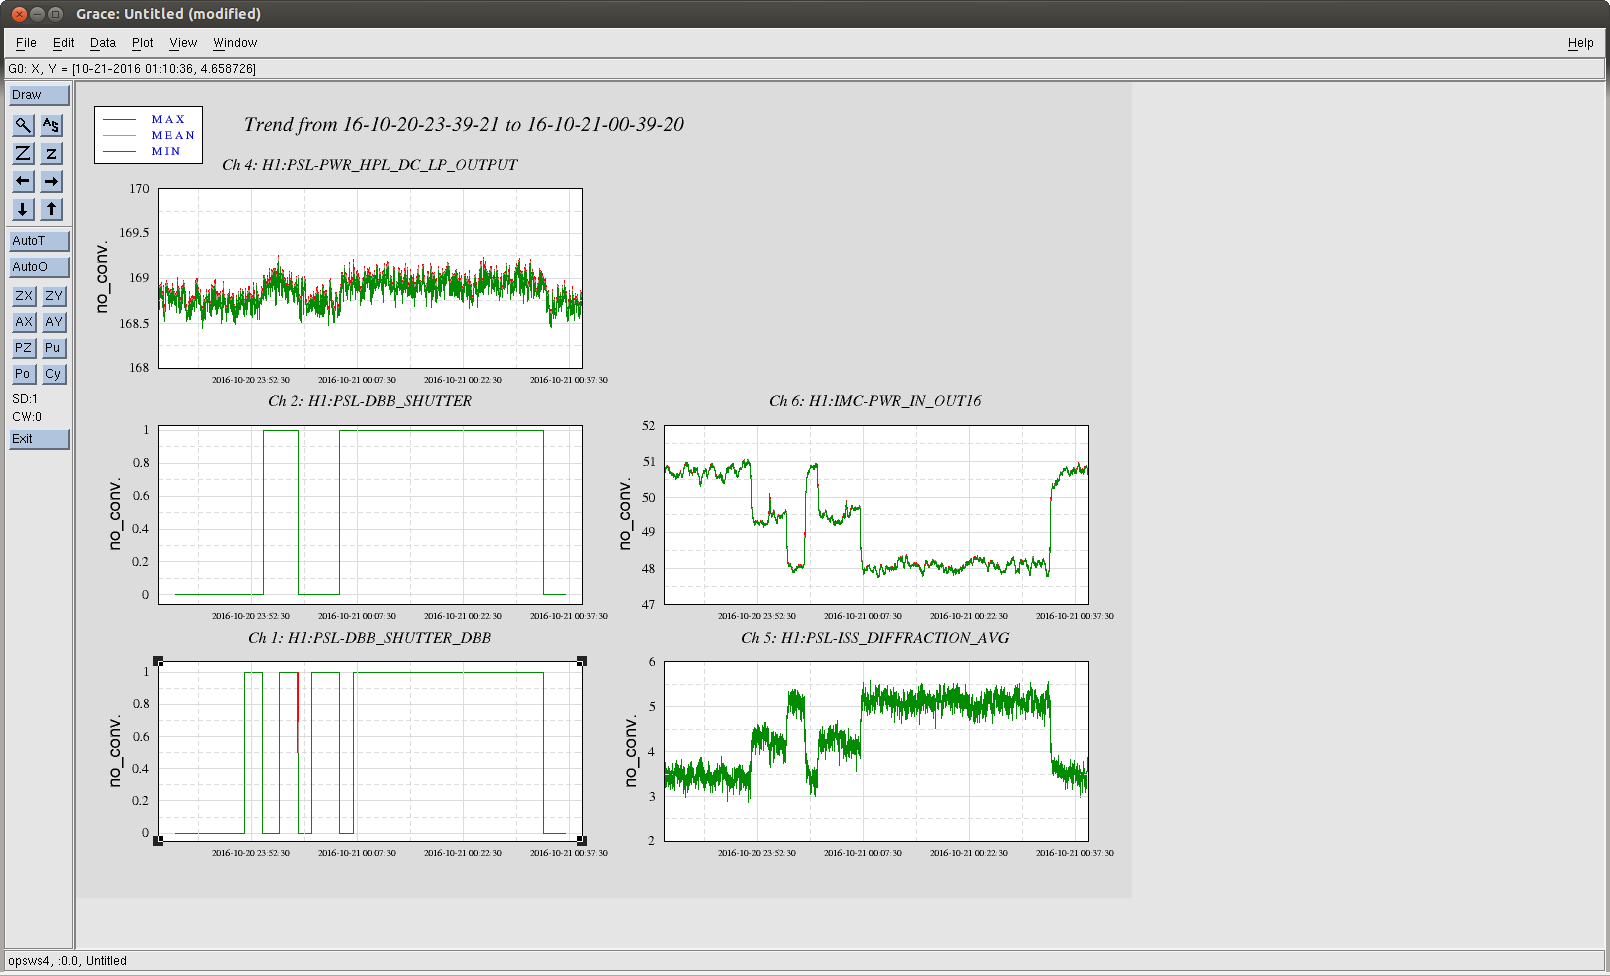
This afternoon Keita and I did another test of opening and closing DBB shutters, since Keita realized that there are multiple shutters that matter. The results are in the screen shot. We only see two shutters on the PSL layout, (SH01 in the 35 W path to the DBB and SH02 in the 200W path) and on the photos documenting the table, but there must be a third shutter, perhaps inside the DBB box. We did not test switching to the 35W beam because that caused a lockloss last night. Apparently the shutters used here are Thorlabs SH05, which has an aluminum blade according the the thorlabs website.
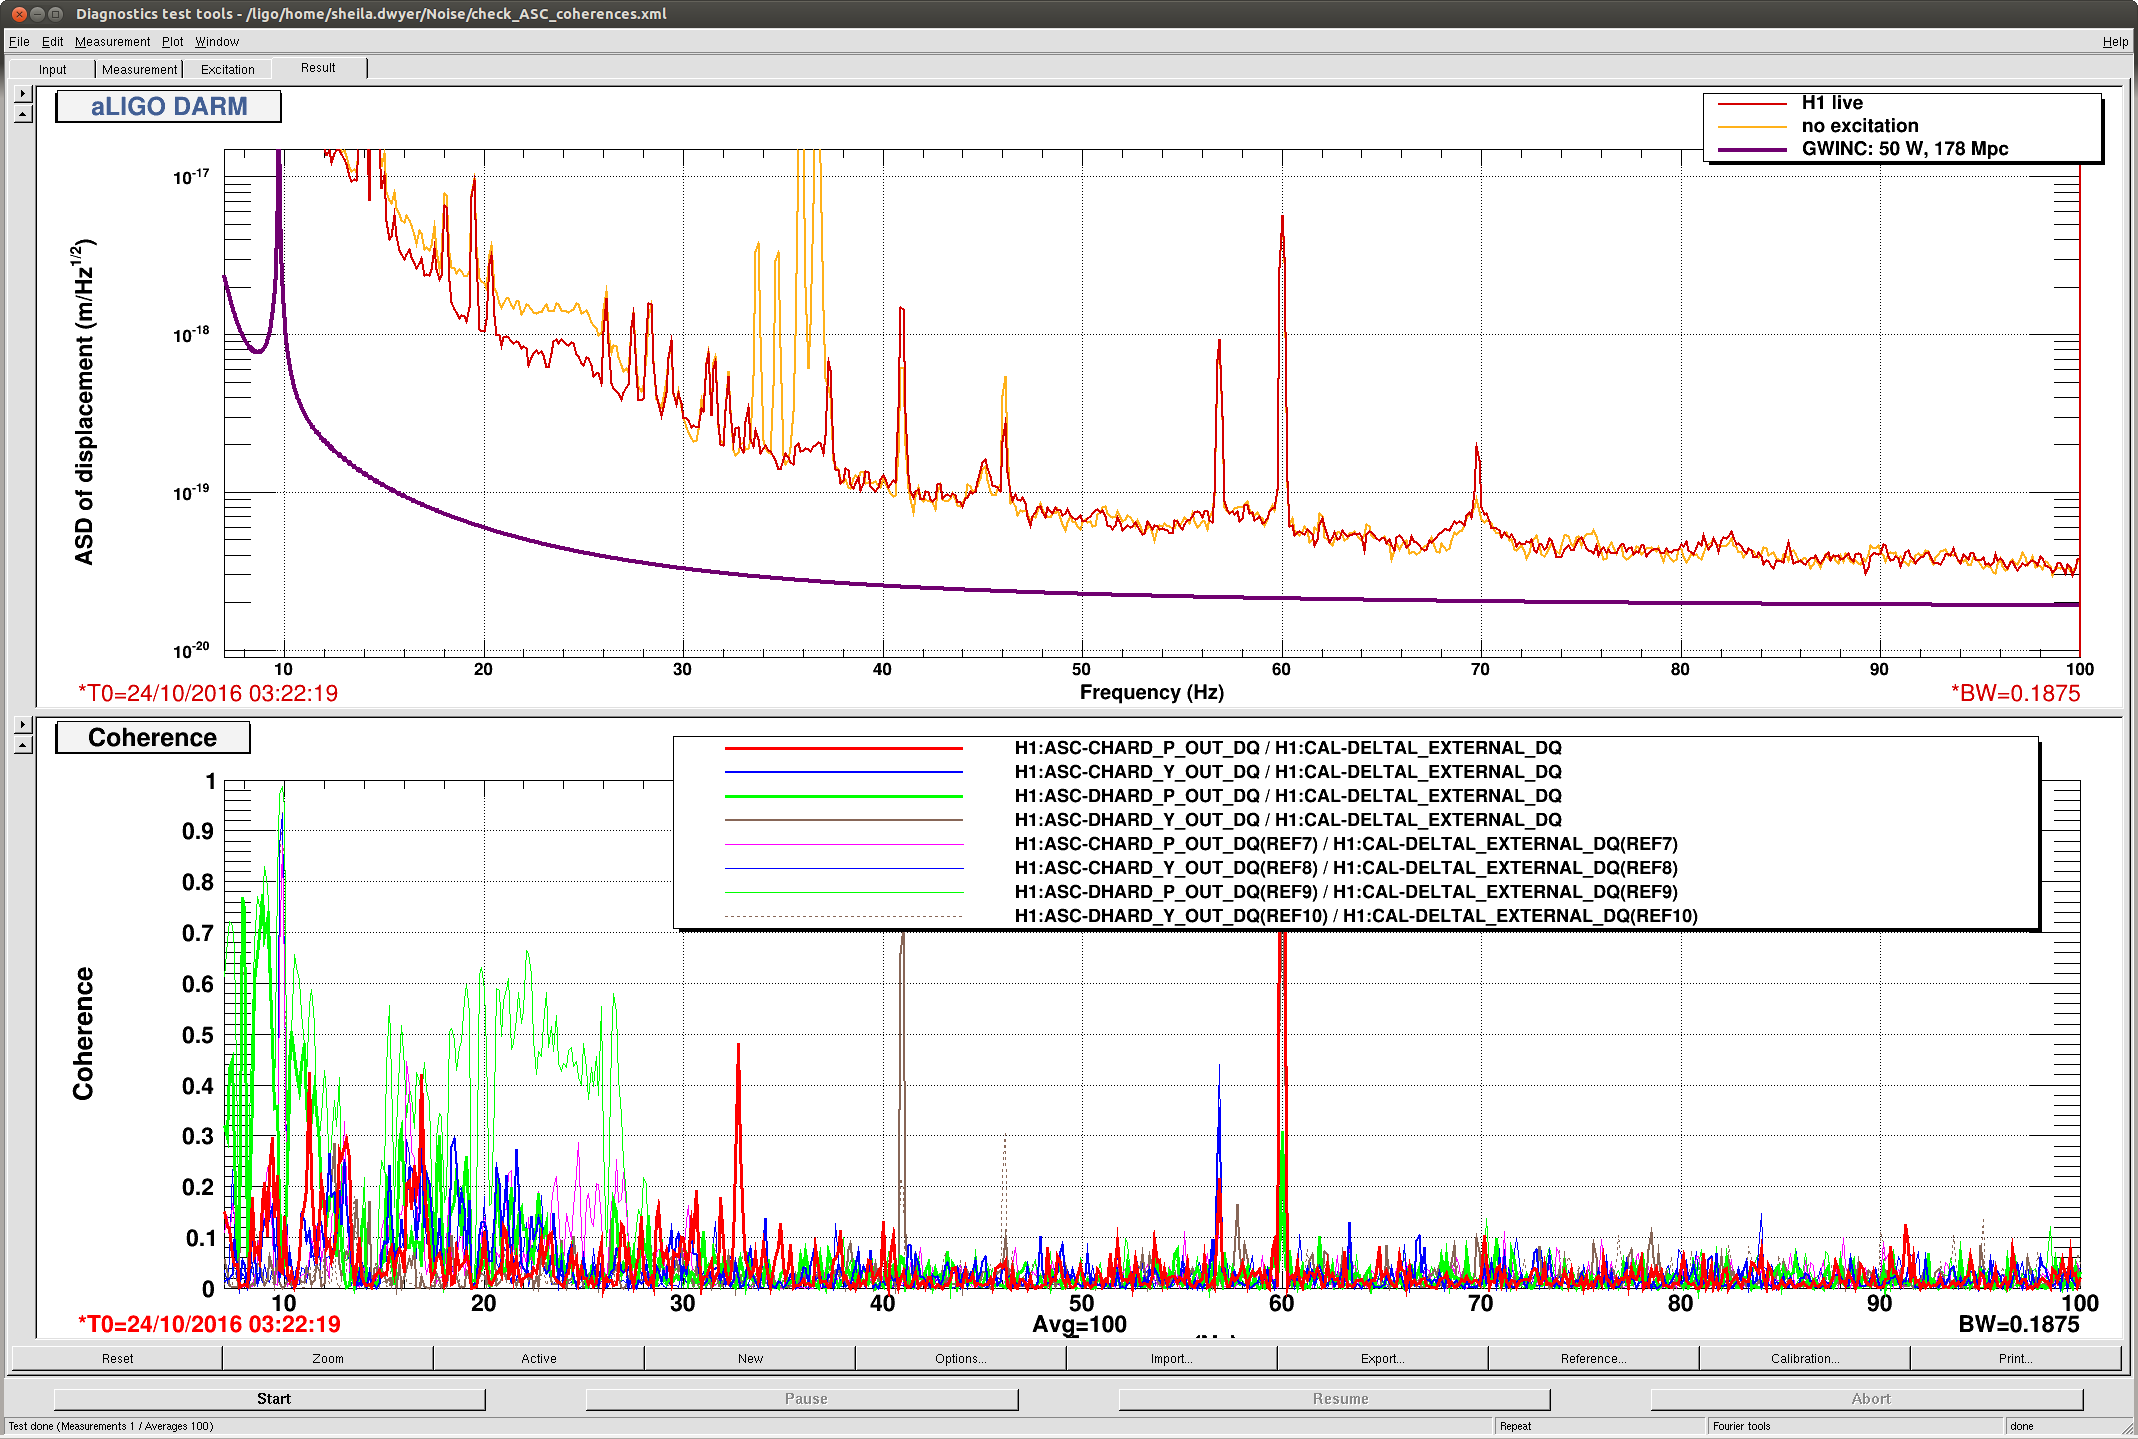
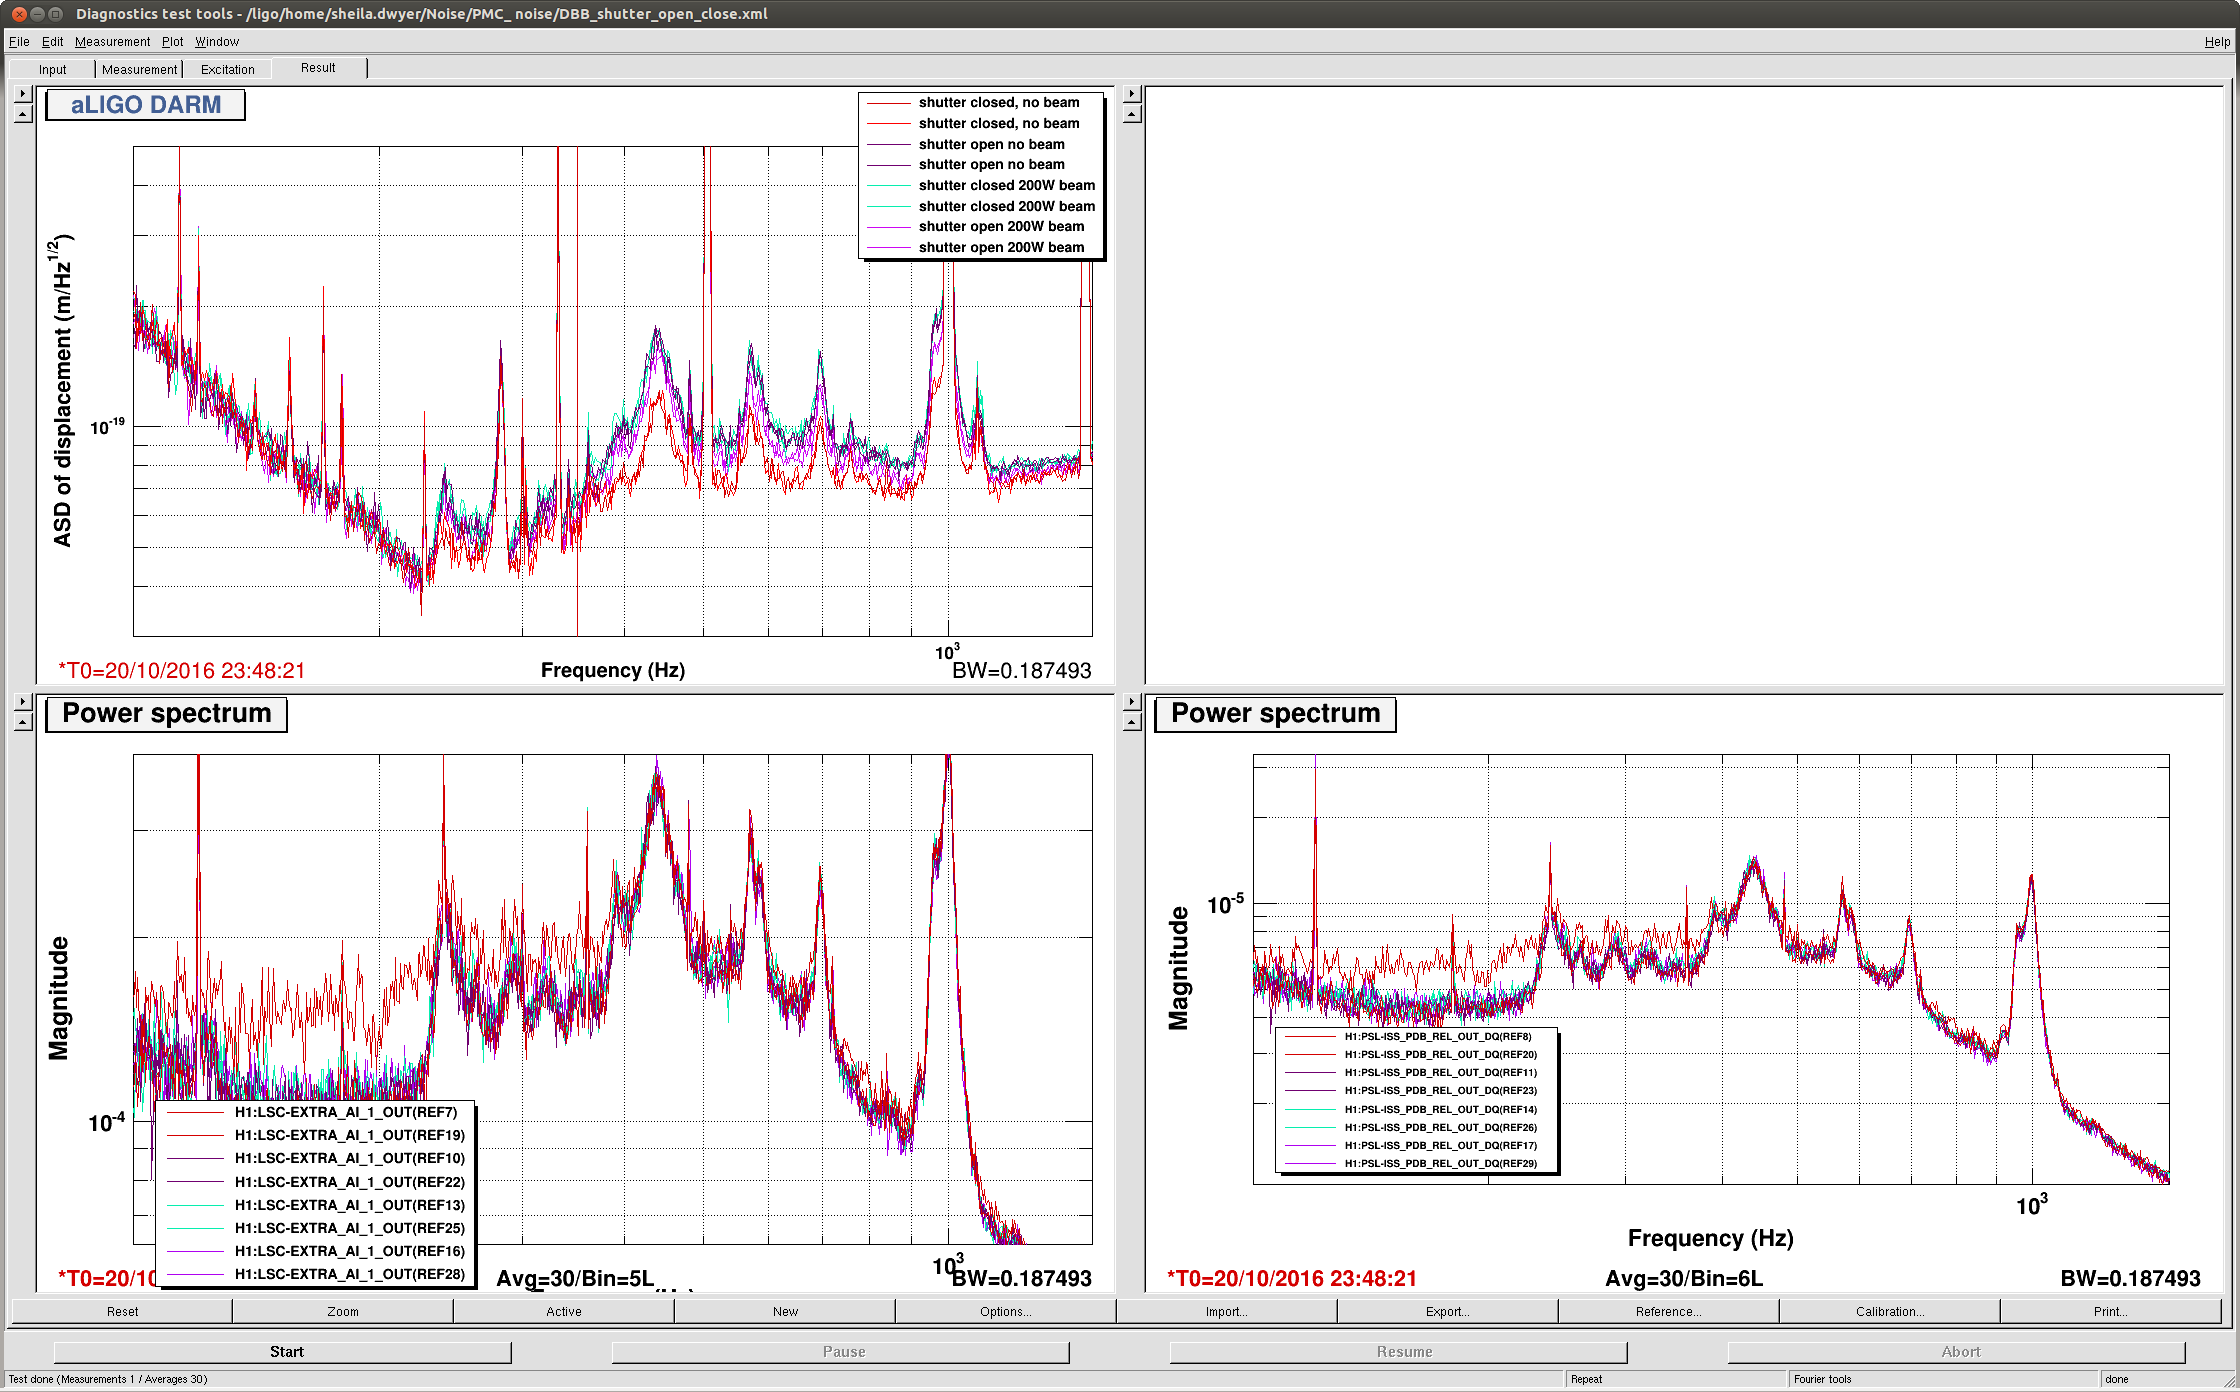
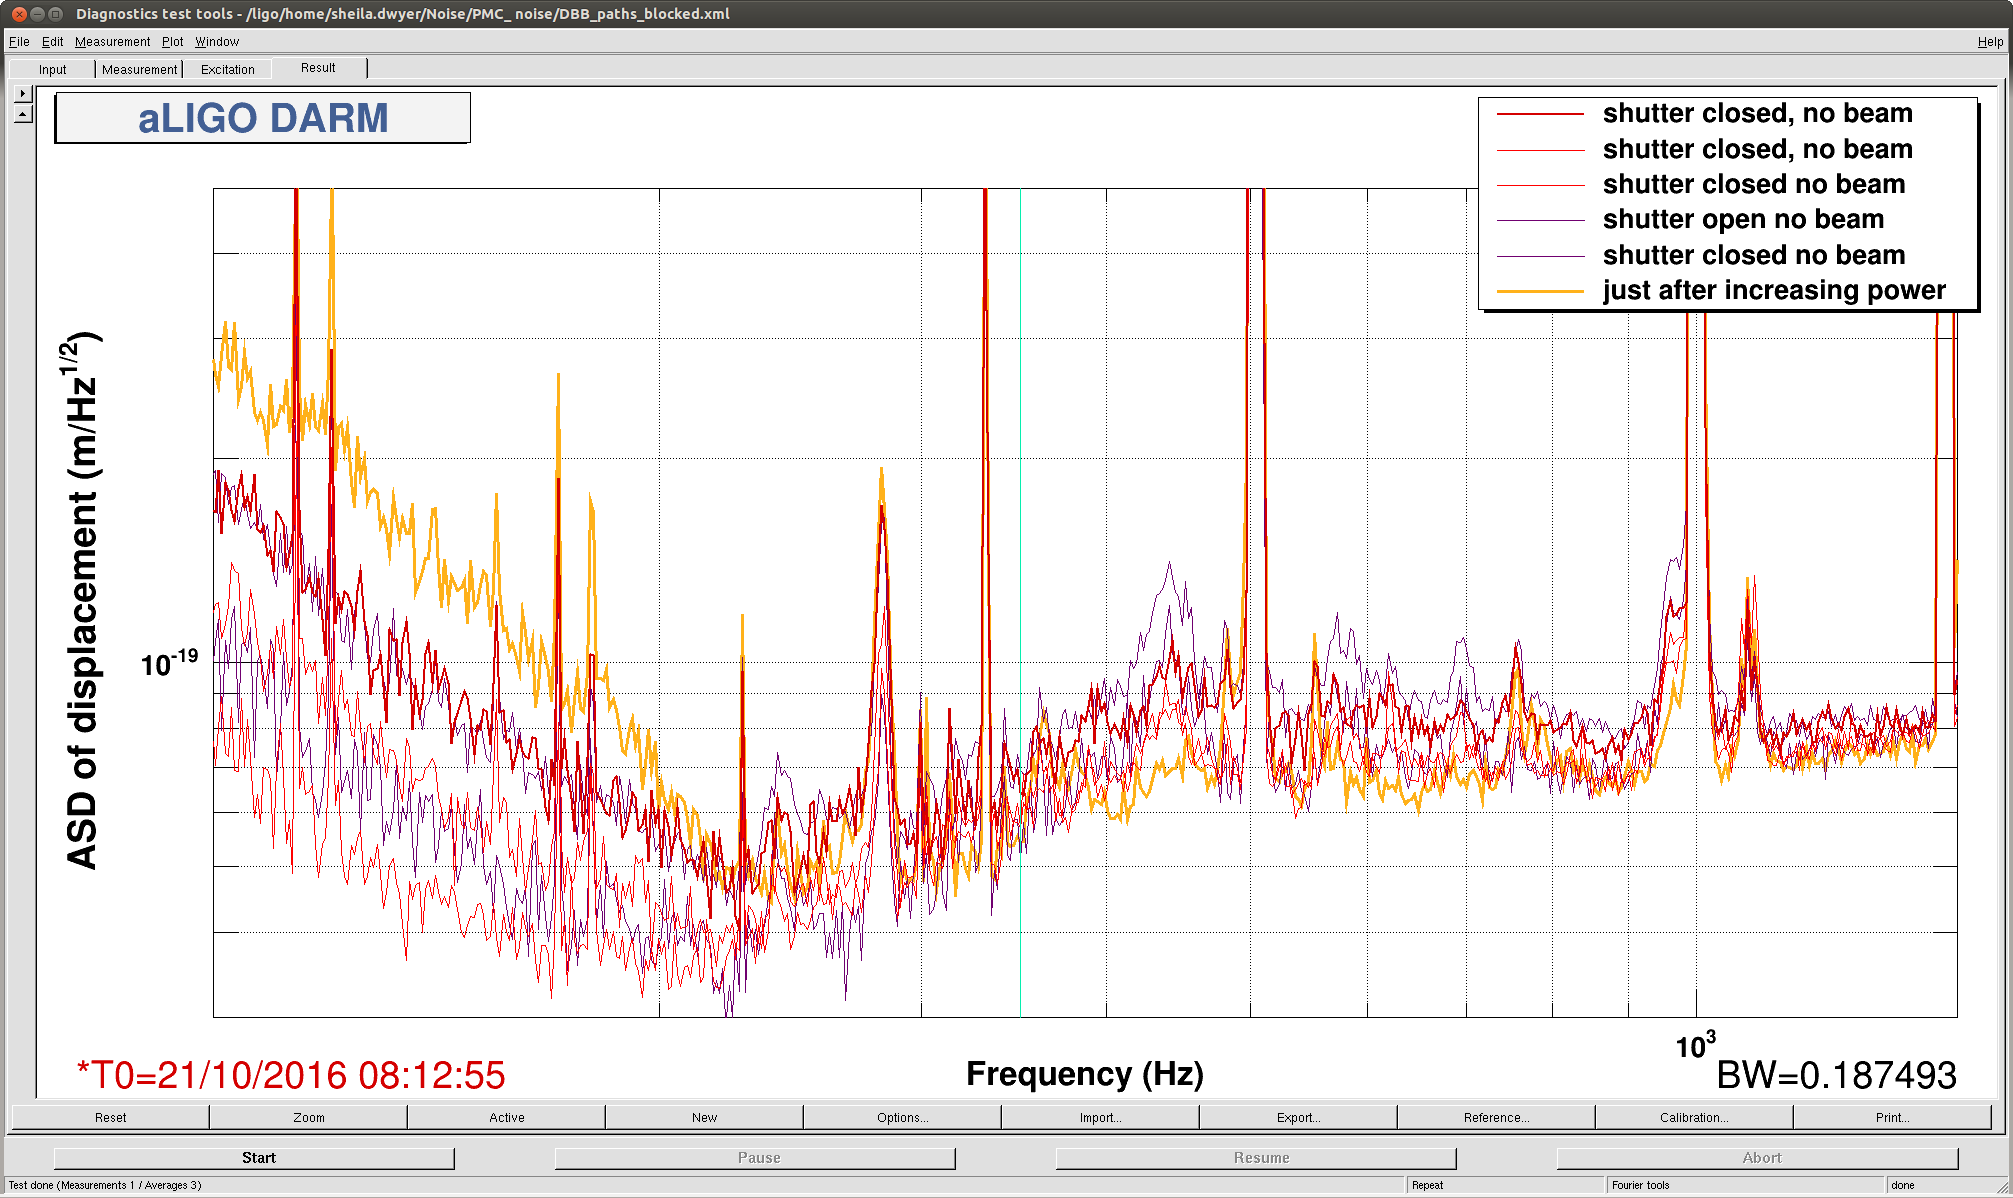
When changing between shutter states today we saw a broad band change in the DARM noise throughout our 200Hz-1kHz lump, (this is a little different from what we saw last night). However, we saw 3 different noise states in DARM depending on the shutter requests, shown in the attachment.
|
|
shutter open |
shutter closed |
|
no beam |
worst |
best |
|
200 W
|
intermediate |
worst |
We guess that the shutter which is controlled by the epics channel "PSL-DBB_SHUTTER_DBB" is inside the DBB box itself and not on the layout. It is hard to explain the table above. For example, if no beam is selected, and both beams are really blocked before they reach the DBB, why would closing the shutter inside the DBB matter?
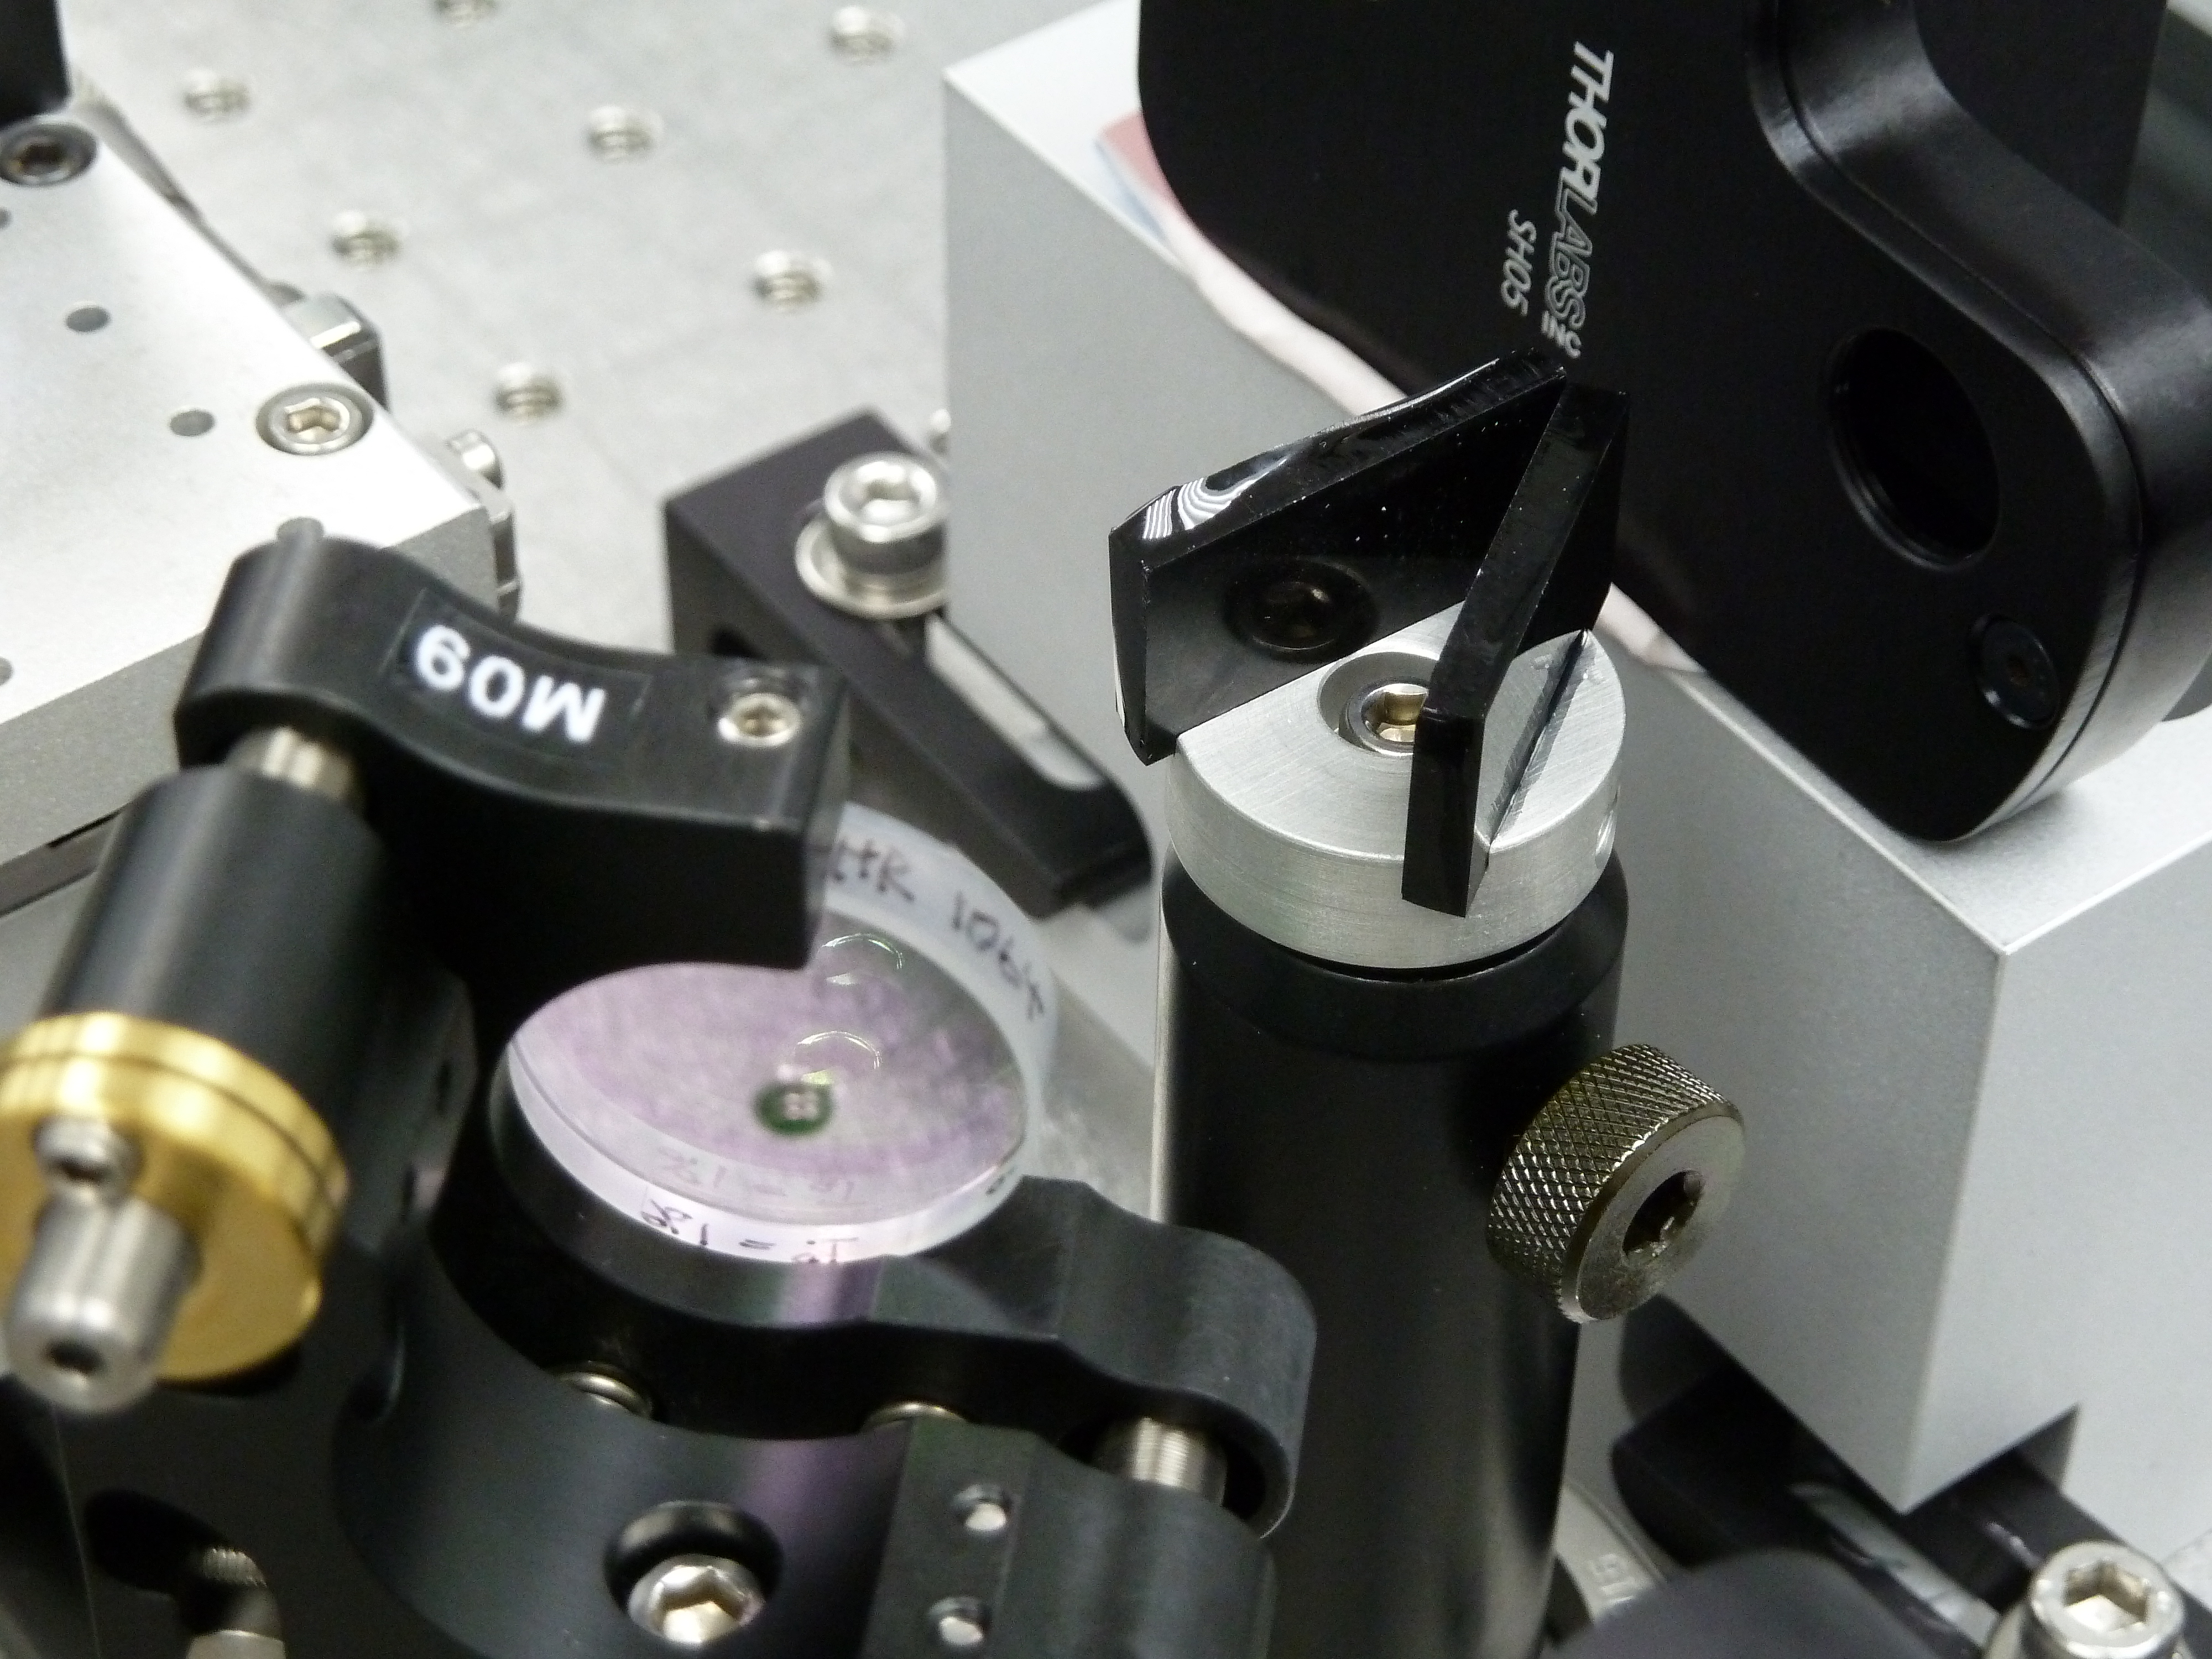
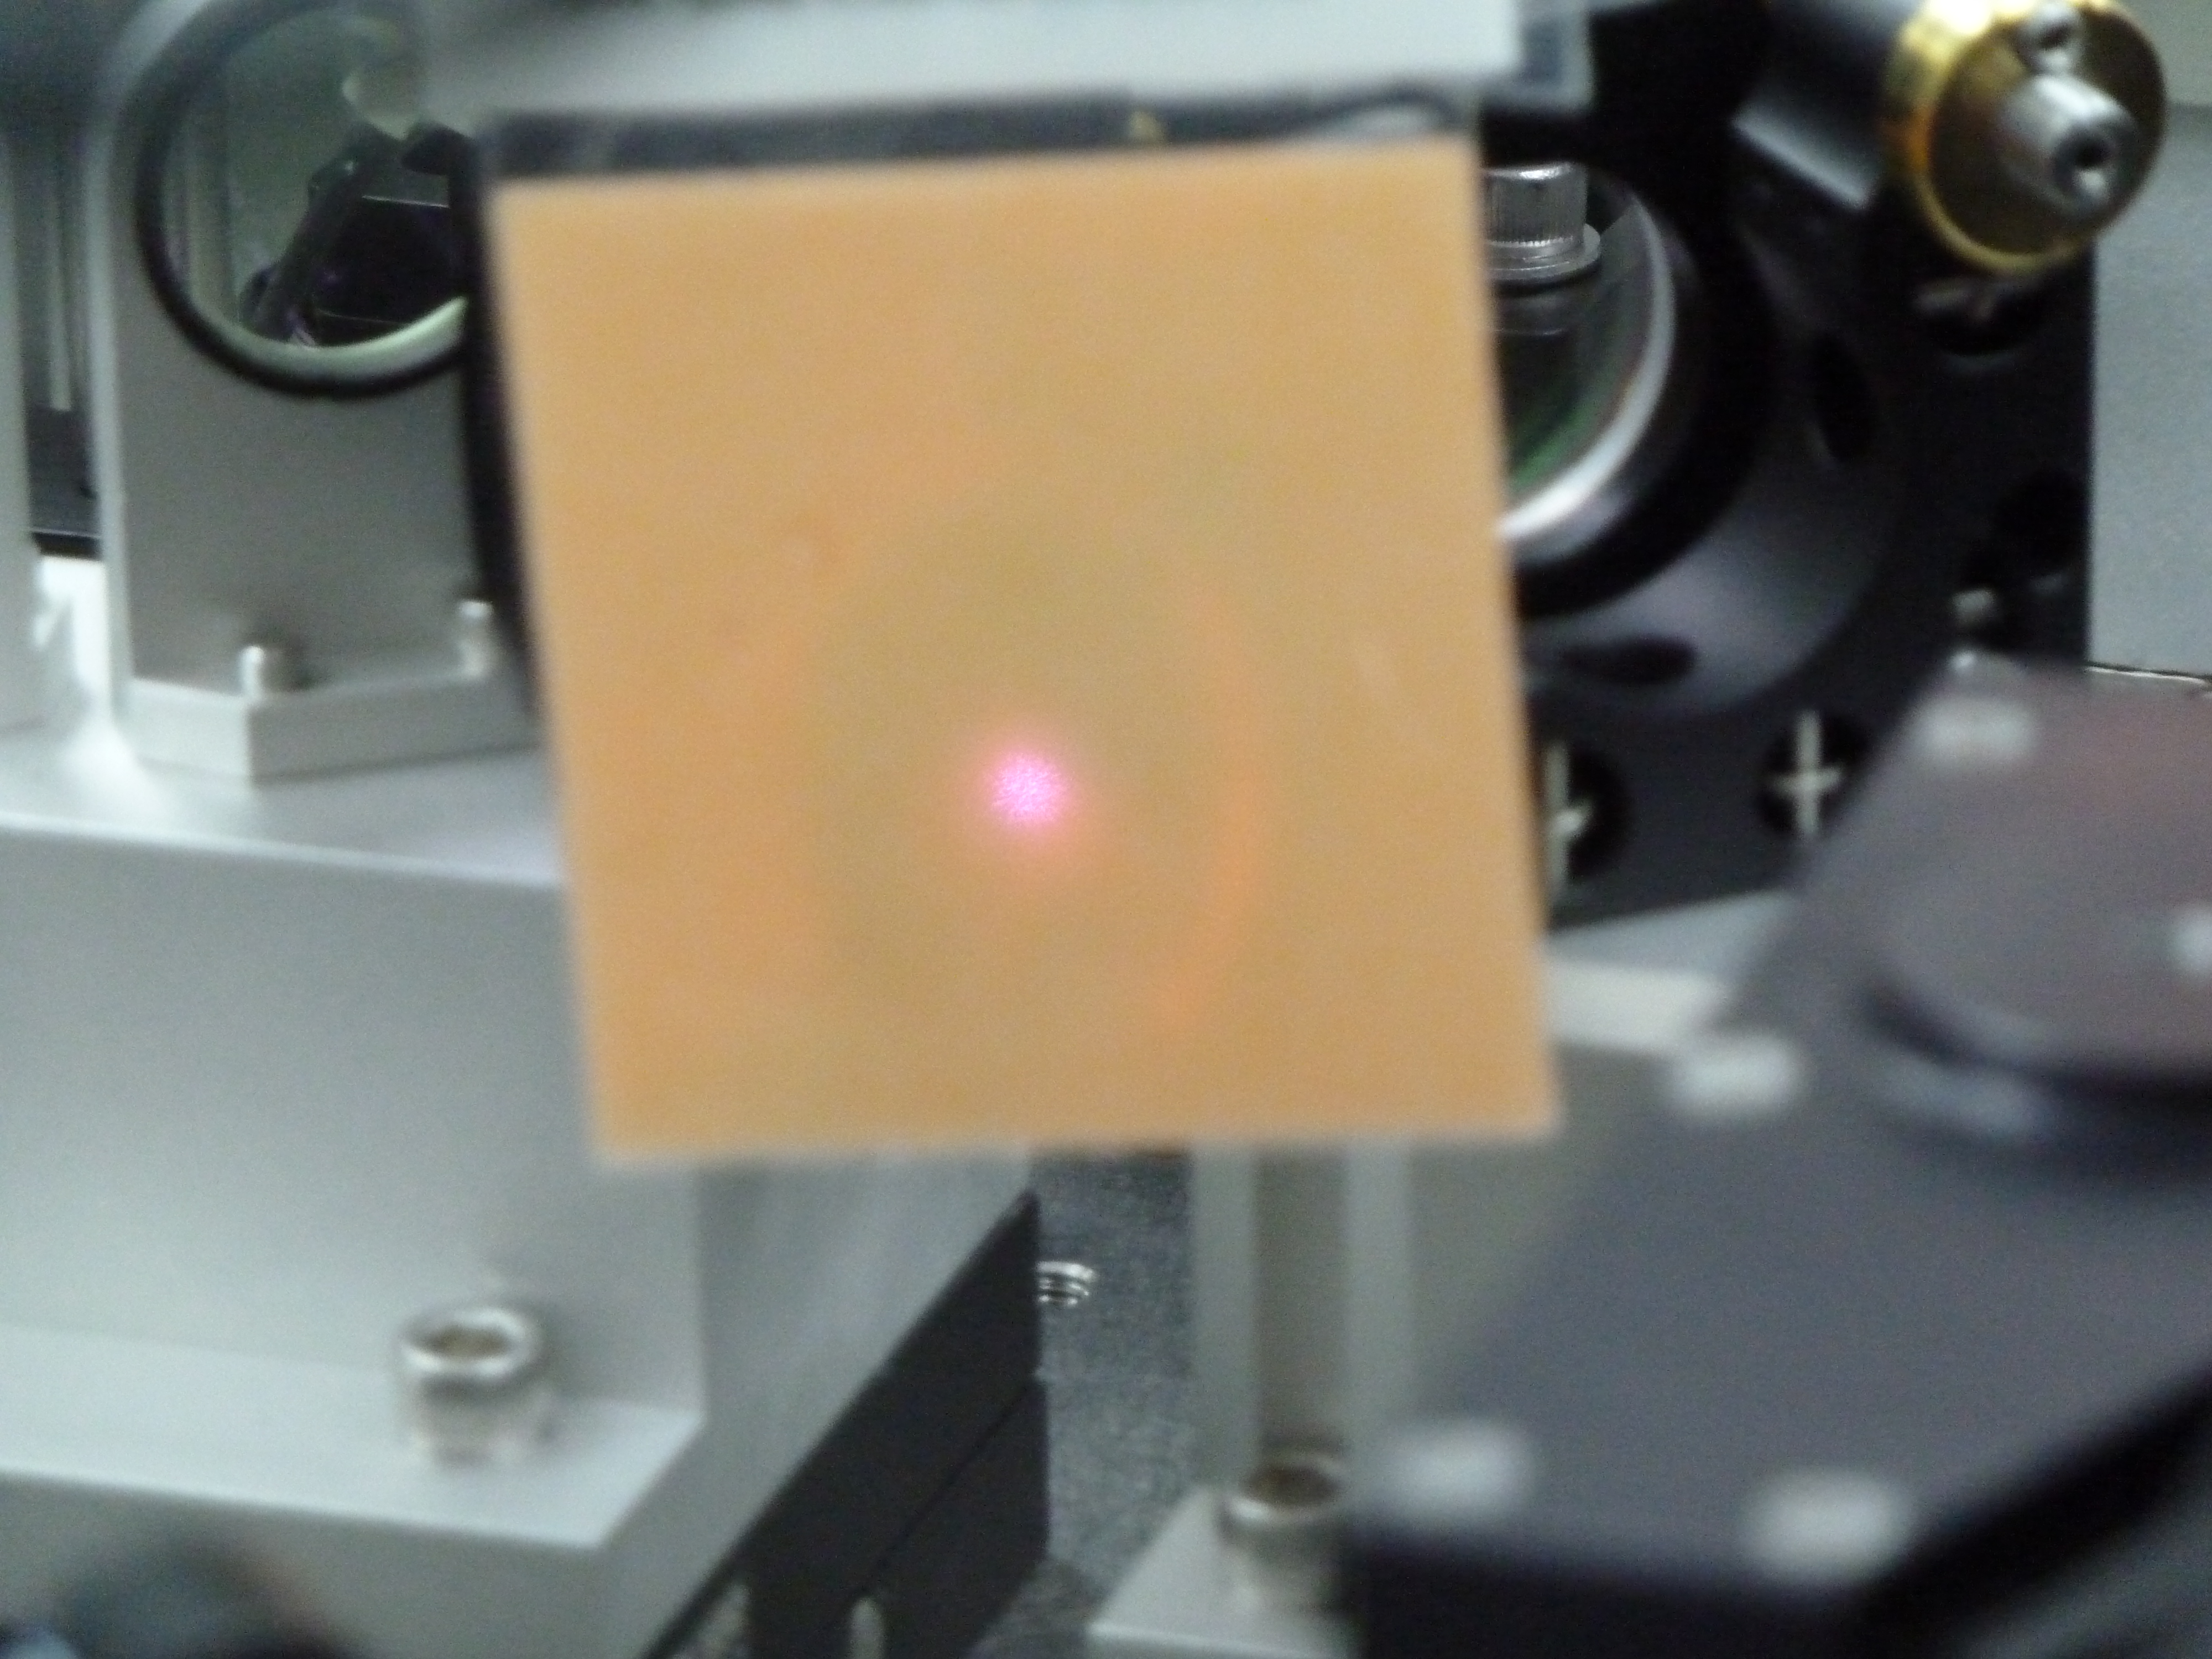
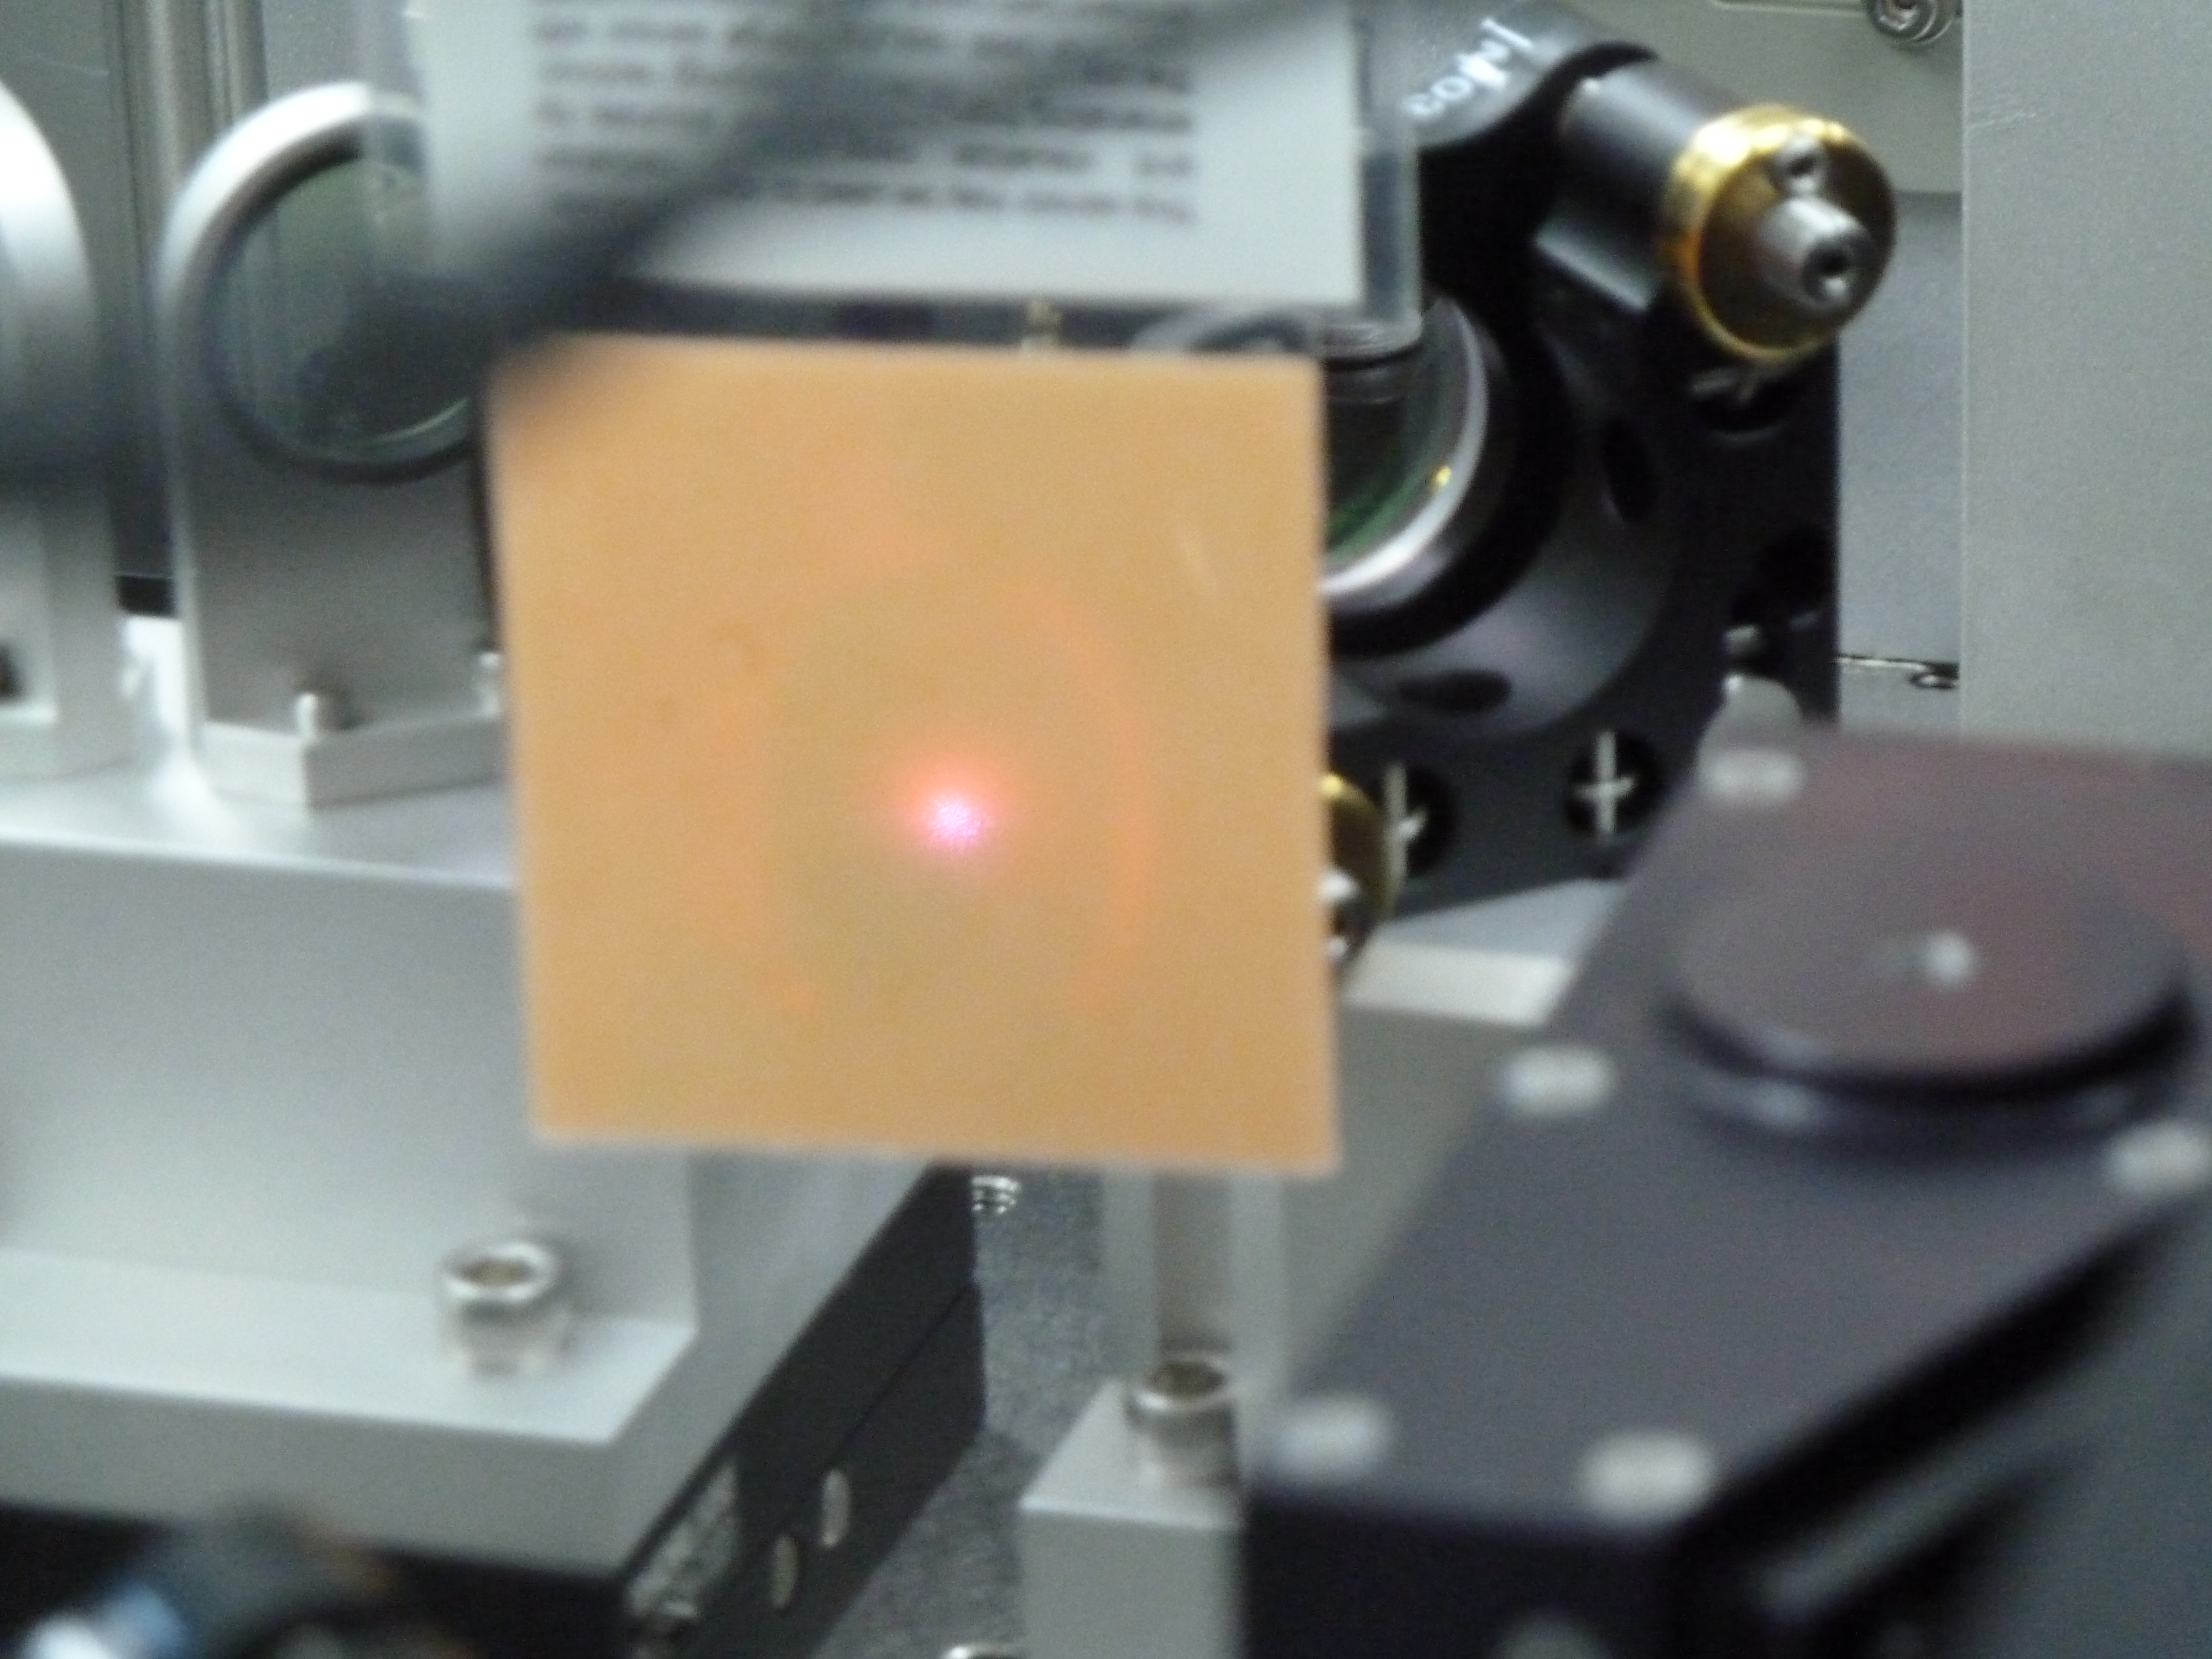
Kiwmau and I went inside the PSL, placed beam dumps in the paths to the DBB. We placed a "black hole" beam dump (no cone in the middle) in the HPO path (a 250 mW beam between M3 and M12 on the layout). Looking at that beam with an IR card, we could see a corona around it, pictures will be attached to this alog. This corona is scattered around, hitting the black baffle near the DBB apperature and other things. We also placed a black glass beam dump upstream of the front end laser beam path the the DBB, just before the shutter.
Update:
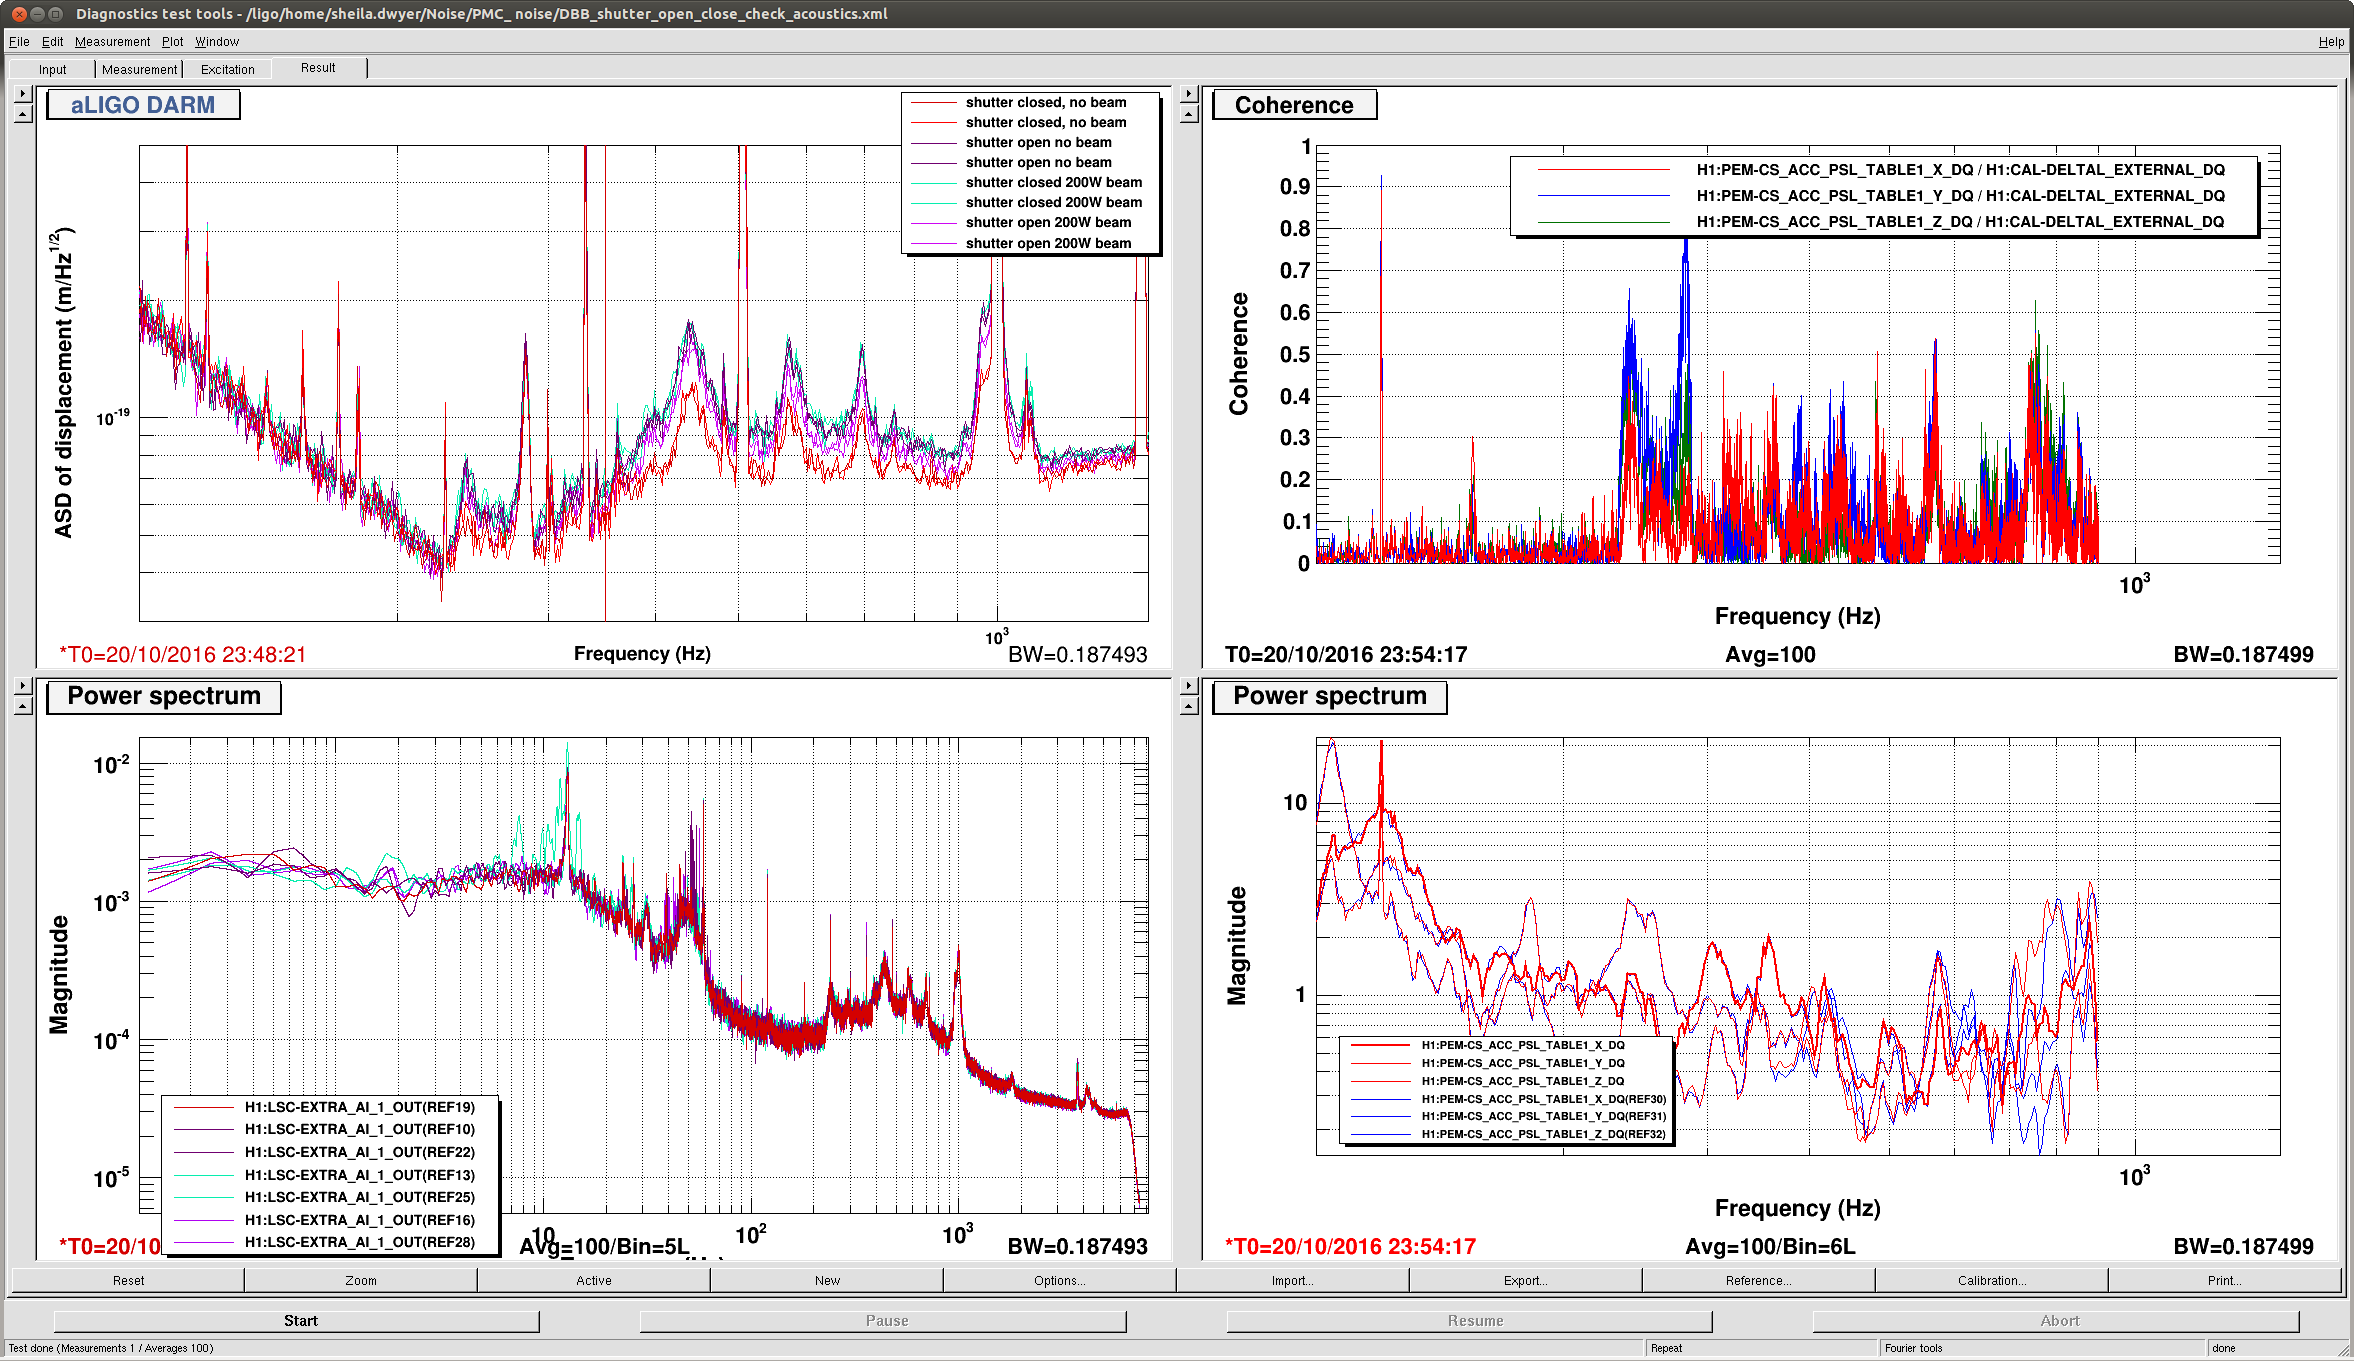
After waiting out the Japanese earthquake, we relocked. The lump was smaller in the first moments of the lock. After a few minutes the peaks reappeared, but the peaks still changed when we opened and closed the shutters, in a way that is repeatable although the plot is confusing since the overall level of noise was changing probably with the thermal state. (each time we opened the shutter, things got worse than they had been).
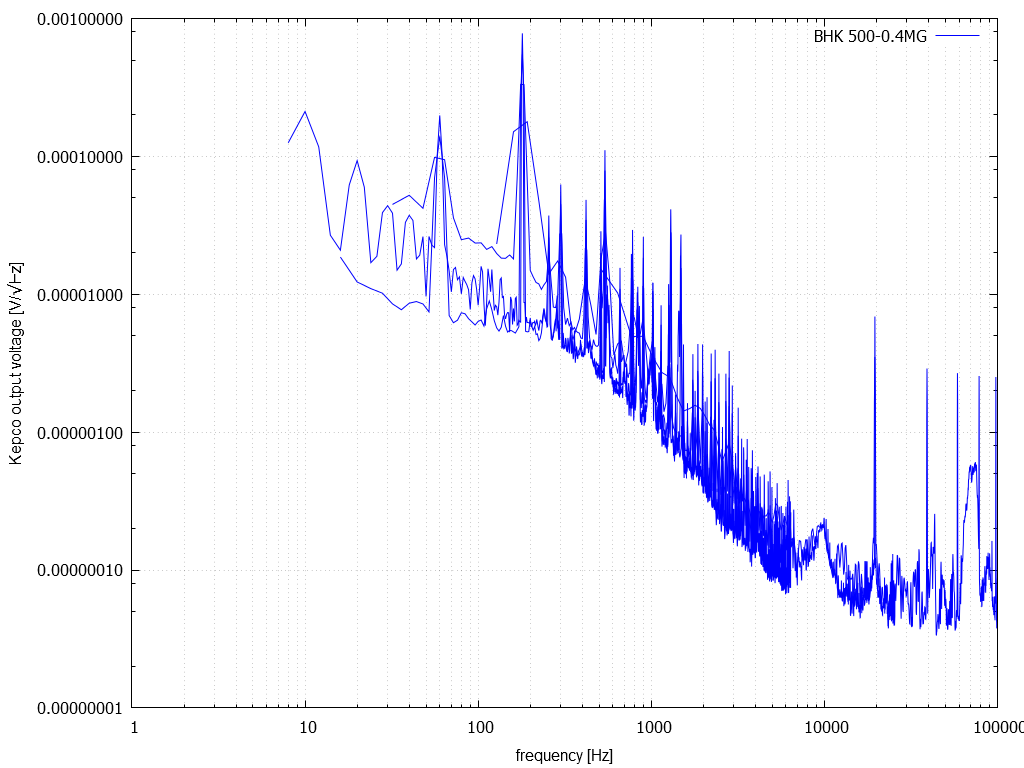
We do not understand how changing the shutter state impacts the DARM noise, although we think we have ruled out scattered light. Kiwamu thought that perhaps the change in the noise could be due to the change in the diffracted power when we move the shutter (see Keita's alog 30679). We tried a test of changing the diffracted power, which unlocked the IFO. It could also be through the same electrical coupling that means the diffracted power changes when we open the shutter.
