[Stefan, Jenne]
We looked at the cross-power spectrum at 10W and at 50W, to see if we would be able to see the smooth "lump" at several hundred Hz if we do as PeterK suggests and lock with 10W, no HPO on Monday.
Our conclusion is that at least at the beginning of a 10W lock, the answer is no lump. While the shot noise makes it difficult to see whether the lump is there or not, by taking a long cross power spectrum (DCPD_A vs. DCPD_B) we can dig down much deeper.
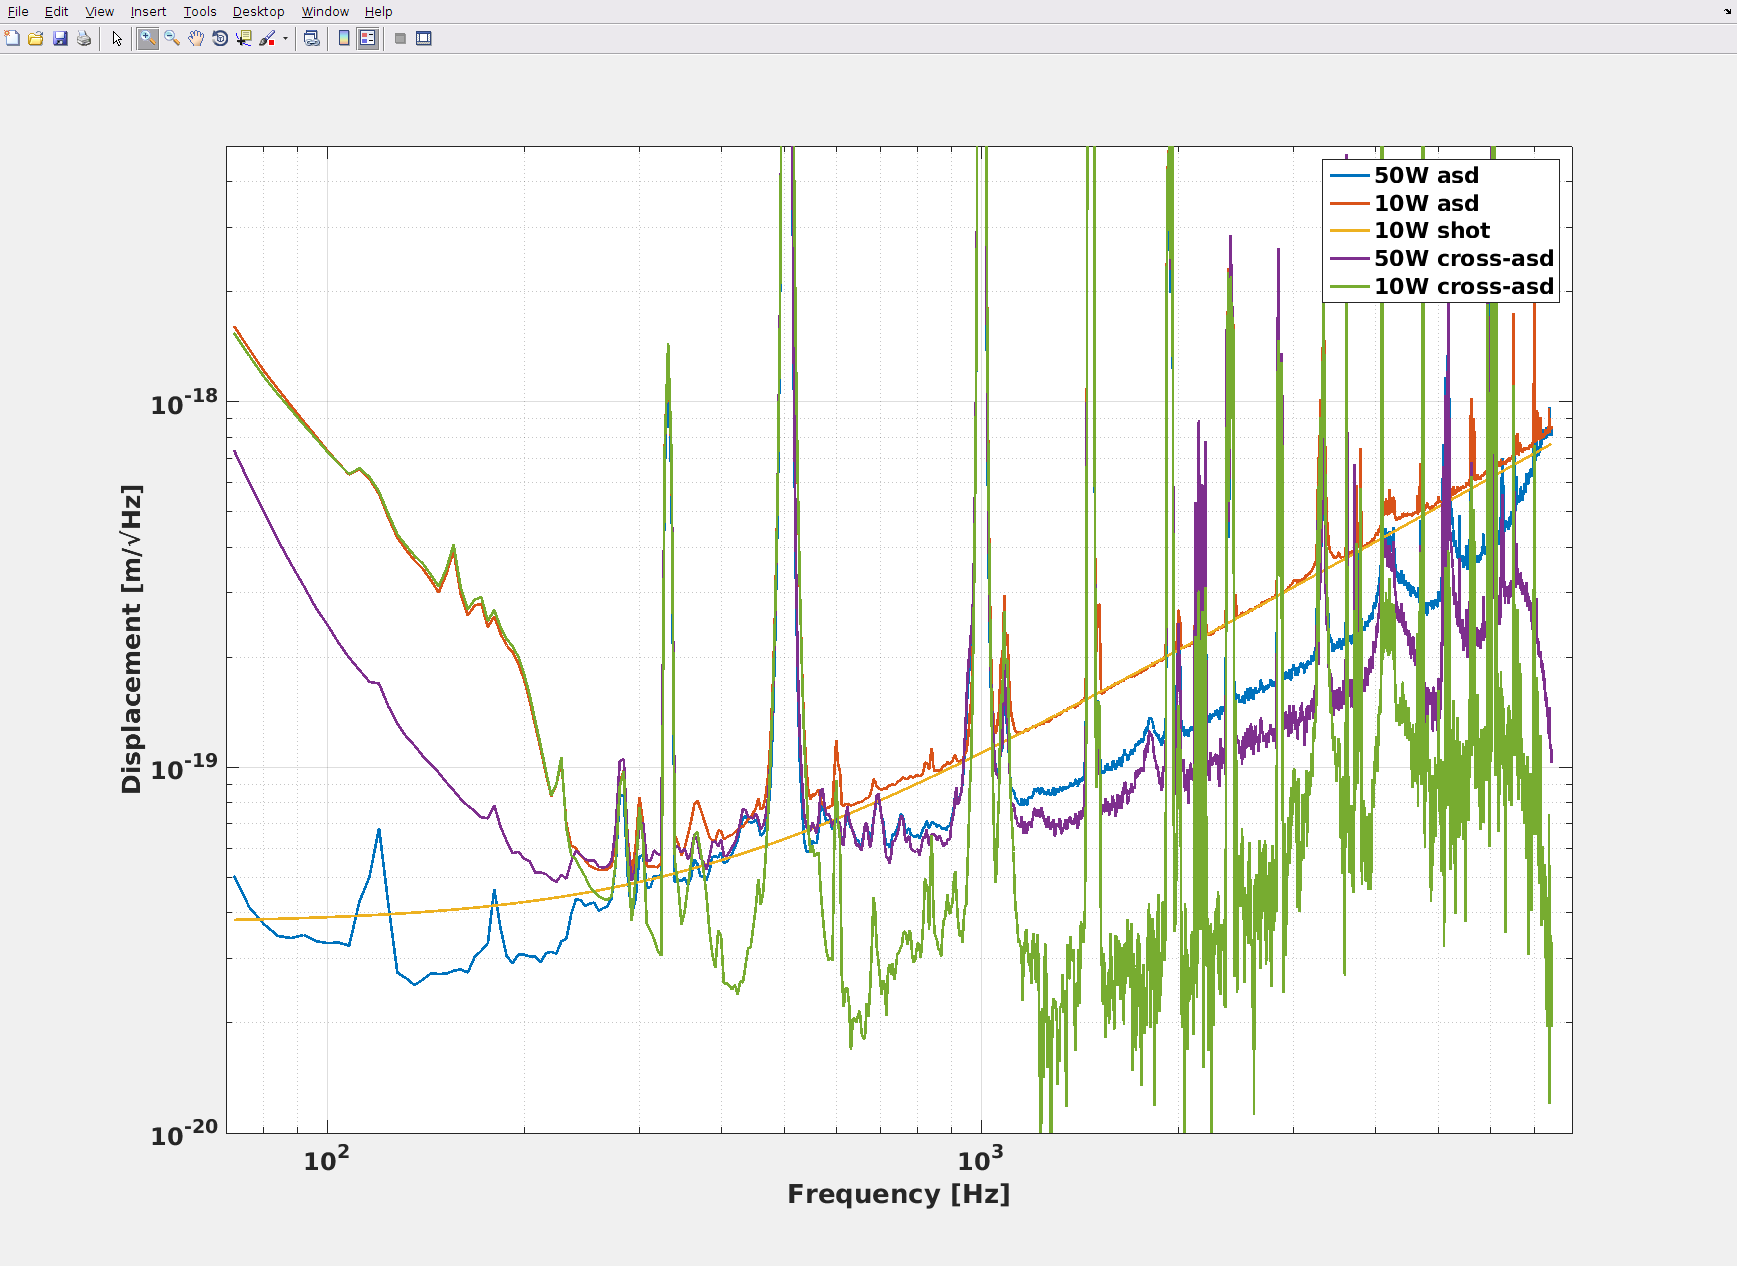
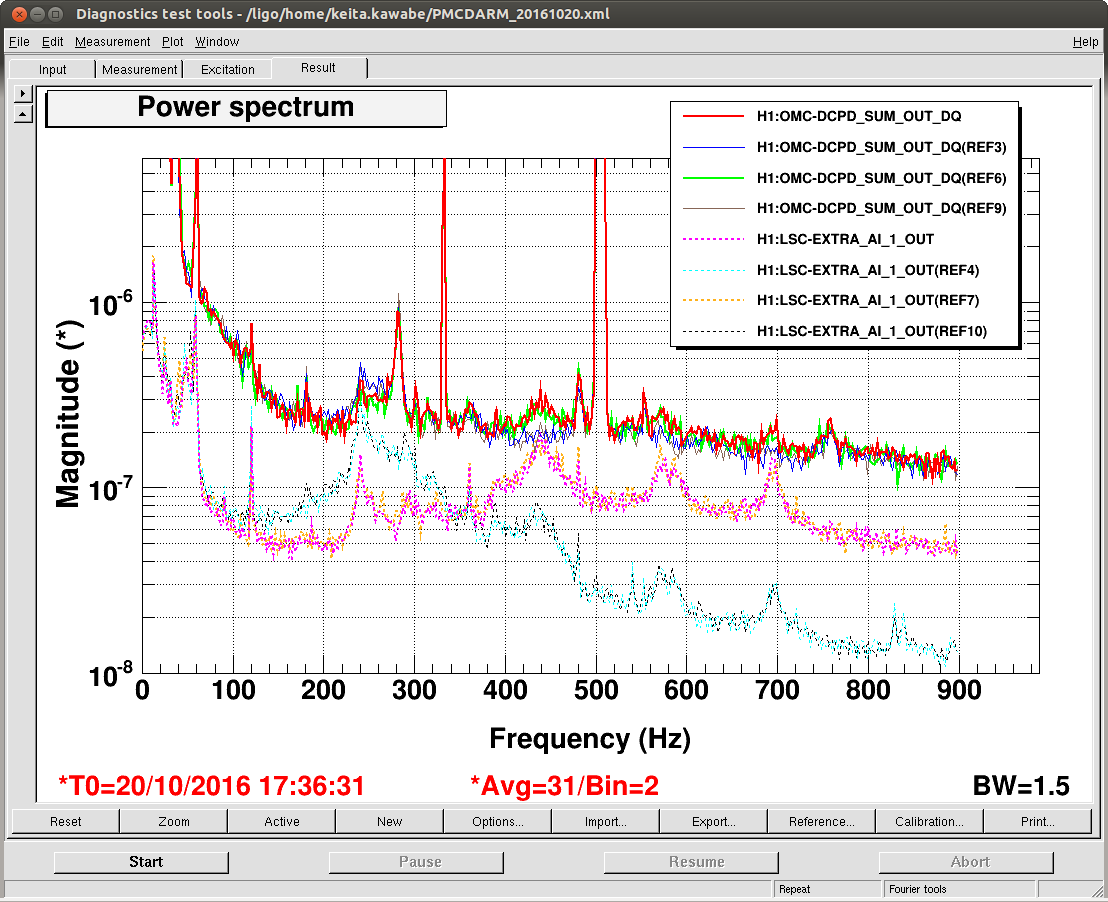
In the attached screenshot, we show the 50W and 10W calibrated DARM spectra (labeled "asd"), the shot noise level assuming the spectrum is shot noise limited at 1340Hz ("shot") and the cross-power-spectra calibrated to amplitude units ("cross-asd"). Note that the 10W shot noise almost limits our ability to see the lump, but the cross-asd tells us that the lump isn't there. The 10W spectra are taken with 15,000 averages, while the 50W spectra is only 1,500 averages. 10W data is from 20:56:00utc today, while the 50W is from our best time last night around 06:44:00utc.
We'll look more at the data later, but we are currently back at 10W, and at the beginning it looked like the lump was there (spectra and quick cross-power-spectra), but 10 min later it is starting to go away. This is definitely something thermal-related, and not relating to the different amount of polarization we let through the rotation stage + PBS.
