I tuned the Xarm TCS, eventually down to 0W. Recall that the Yarm TCS is already at 0W at high PSL power.
This consistently made my frequency coupling and jitter coupling lines better. My intensity coupling line went through a bit of a minimum, but didn't come up very far from that.
We started the next lock with 0W TCS, and it still seems good. When the SRM is optimally aligned to minimize POP90, the peaks around a few hundred Hz are a little smaller. But, if the SRM moves even a bit, they come back to their usual height. On the one hand, this is good, since it means the peaks are better when the sideband buildups are better (previously it has seemed like the peaks are better when the SRC is slightly misaligned). On the other hand, it's not good that it's so sensitive to the SRM being perfect. We definitely need to close some kind of loop around the SRM, even if it's just the dither loop.
I'm obviously at the limit of how low I can go with the Xarm TCS, but it will be good to try increasing the Yarm CO2 a bit, to see if that also helps. I know it's a pain, but we may also want to think about increasing the ITMX ring heater even more, so that we have more room to move with the CO2.
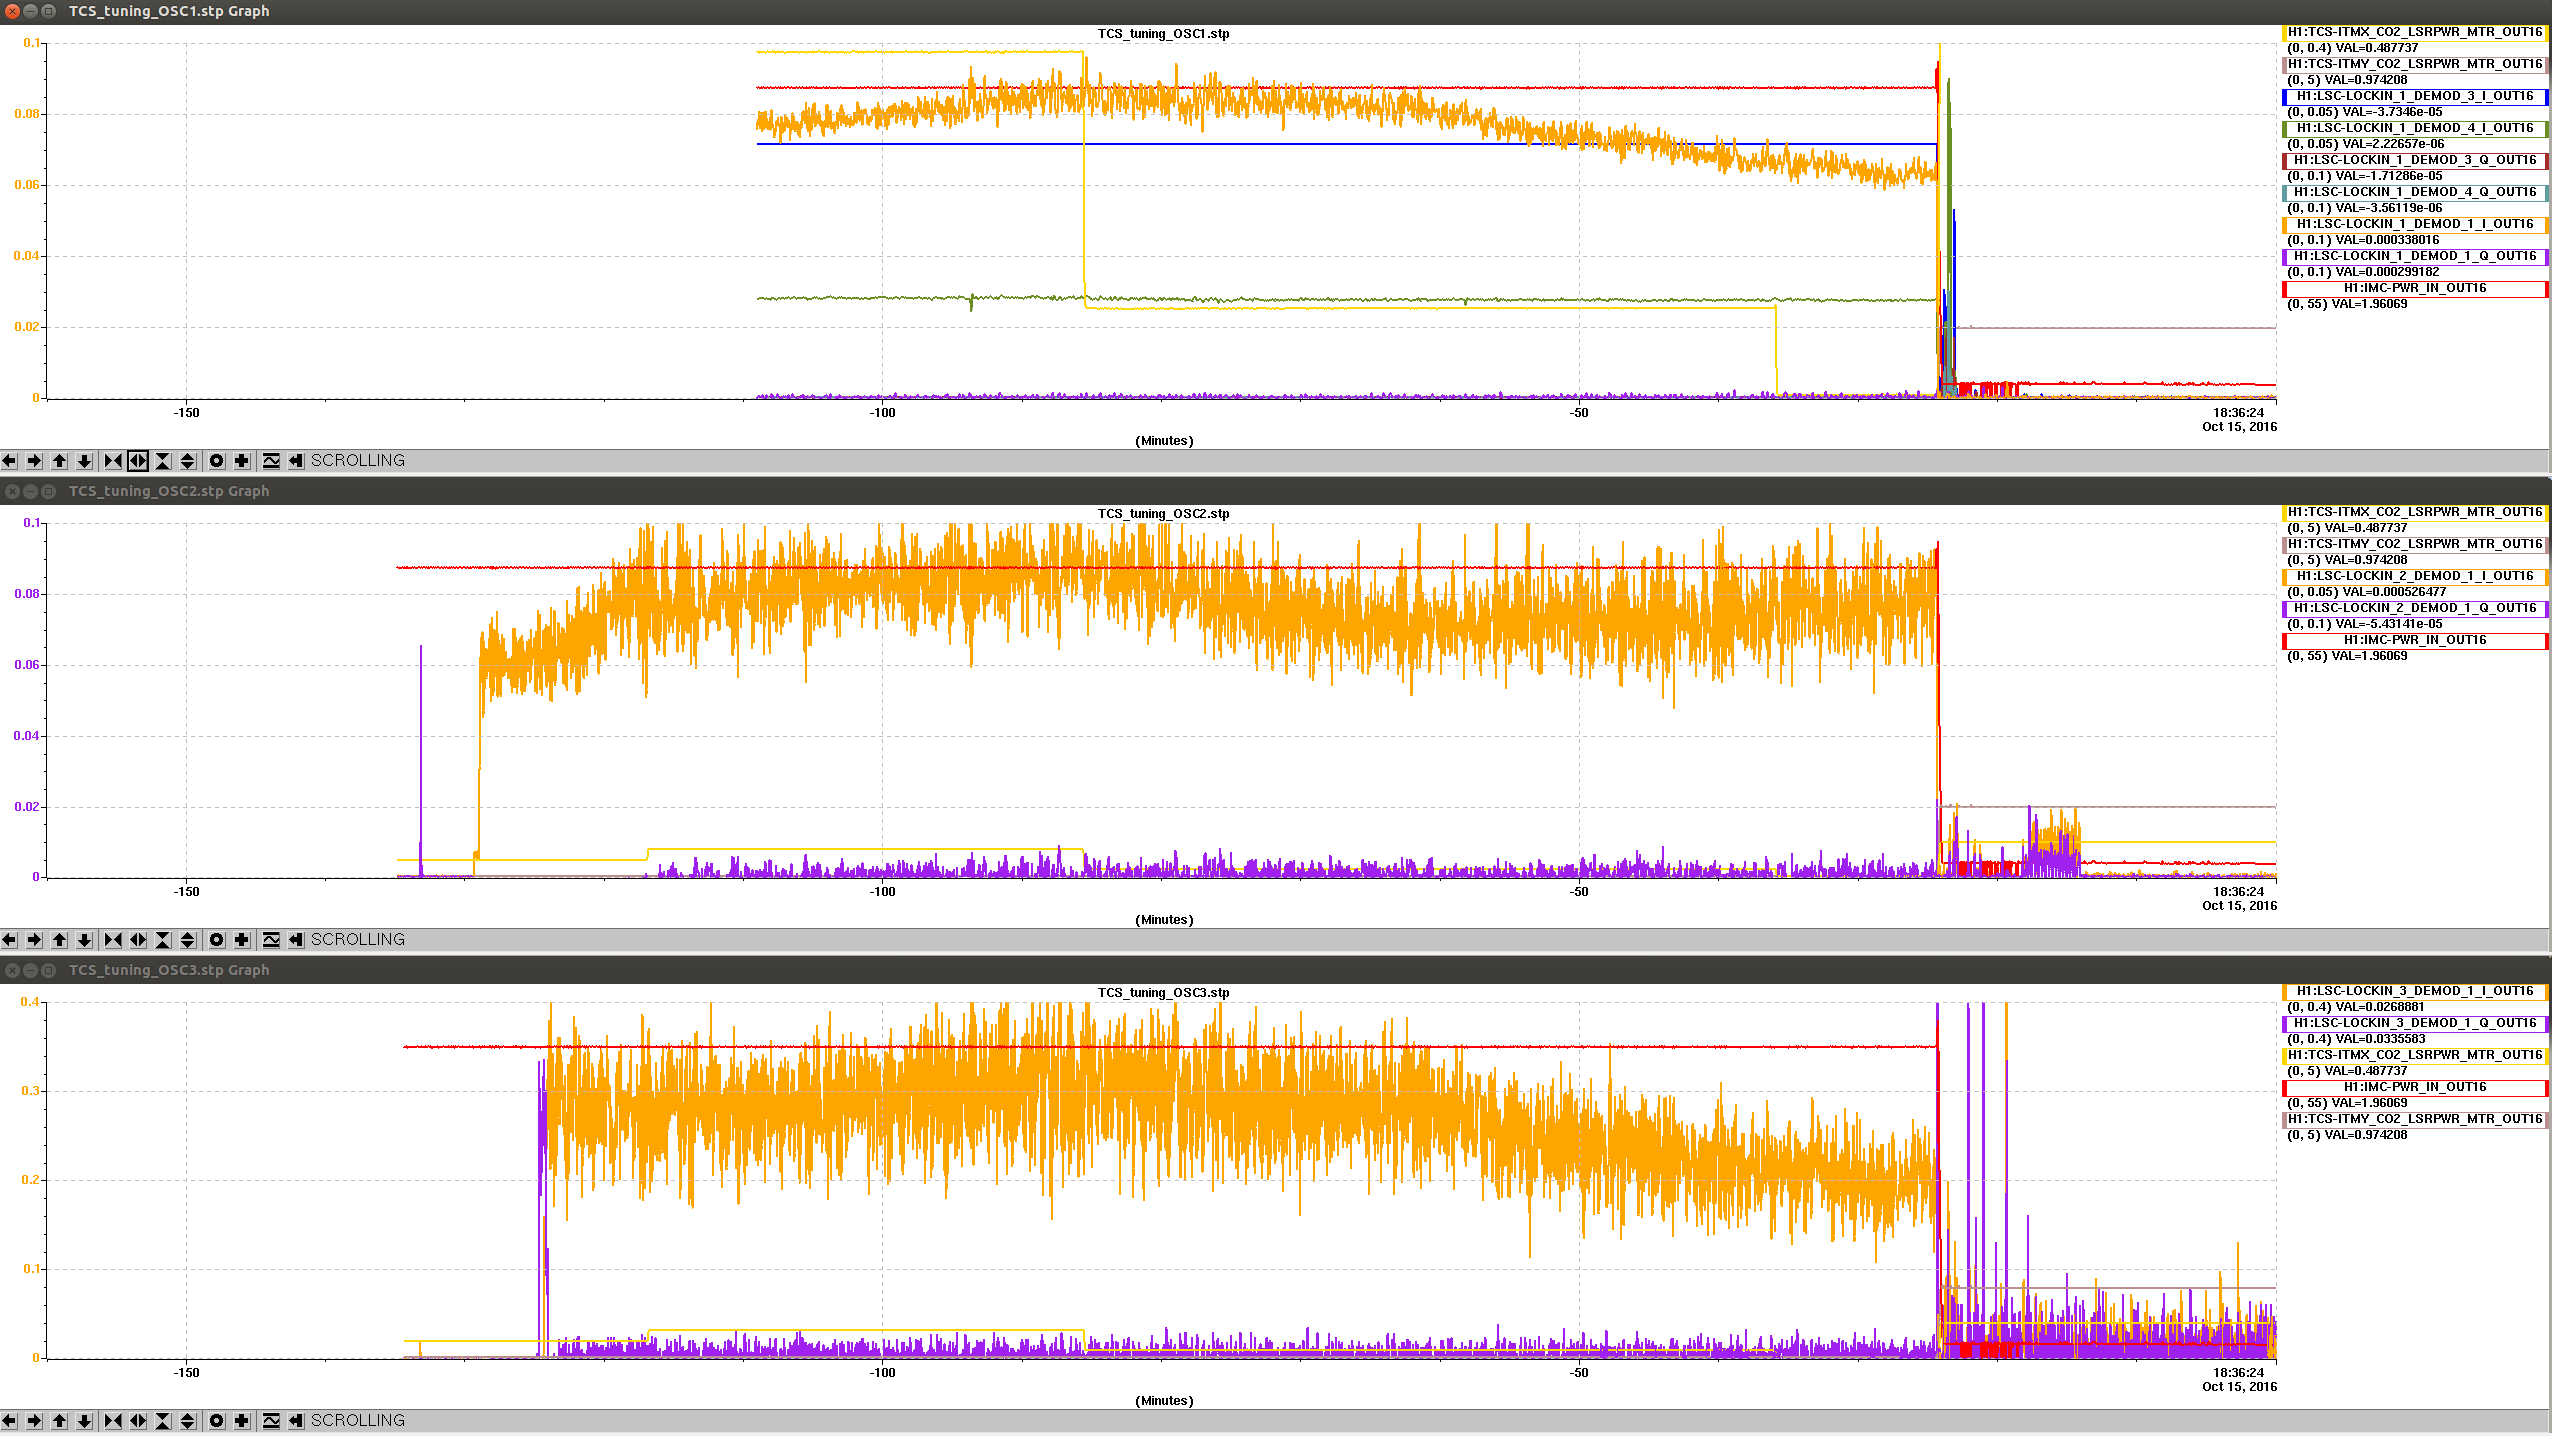
In the attached plot, you can see my demodulated DARM signals (orange-ish yellow is demodulated DCPDs in all rows). Top row is the frequency line at 900 Hz, middle row is intensity line at 860 Hz and bottom row is pitch jitter line in the PZT on the PSL table at 820 Hz. Bright yellow in all rows is the ITMX CO2 power. You can see that things got a bit worse when I increased it from 0.24W nominal to 0.40W around -120 minutes, then better when I went to 0.1W around -80 min. Things continued to improve, although not much, when I went to 0W around -30 min. It's not clear why we lost this lock. For the intensity line in the middle row, you can see that it went through a minimum around about -65 minutes. Unfortunately I didn't have the demod-phase-zeroing servo on with enough gain for this loop until about -130 minutes, so we can't compare directly to the coupling that we had during nominal operation of 0.24W, but it doesn't get as bad as it was with 0.40W.
