edmond.merilh@LIGO.ORG - posted 10:44, Wednesday 17 August 2016 - last comment - 13:26, Wednesday 17 August 2016(29152)
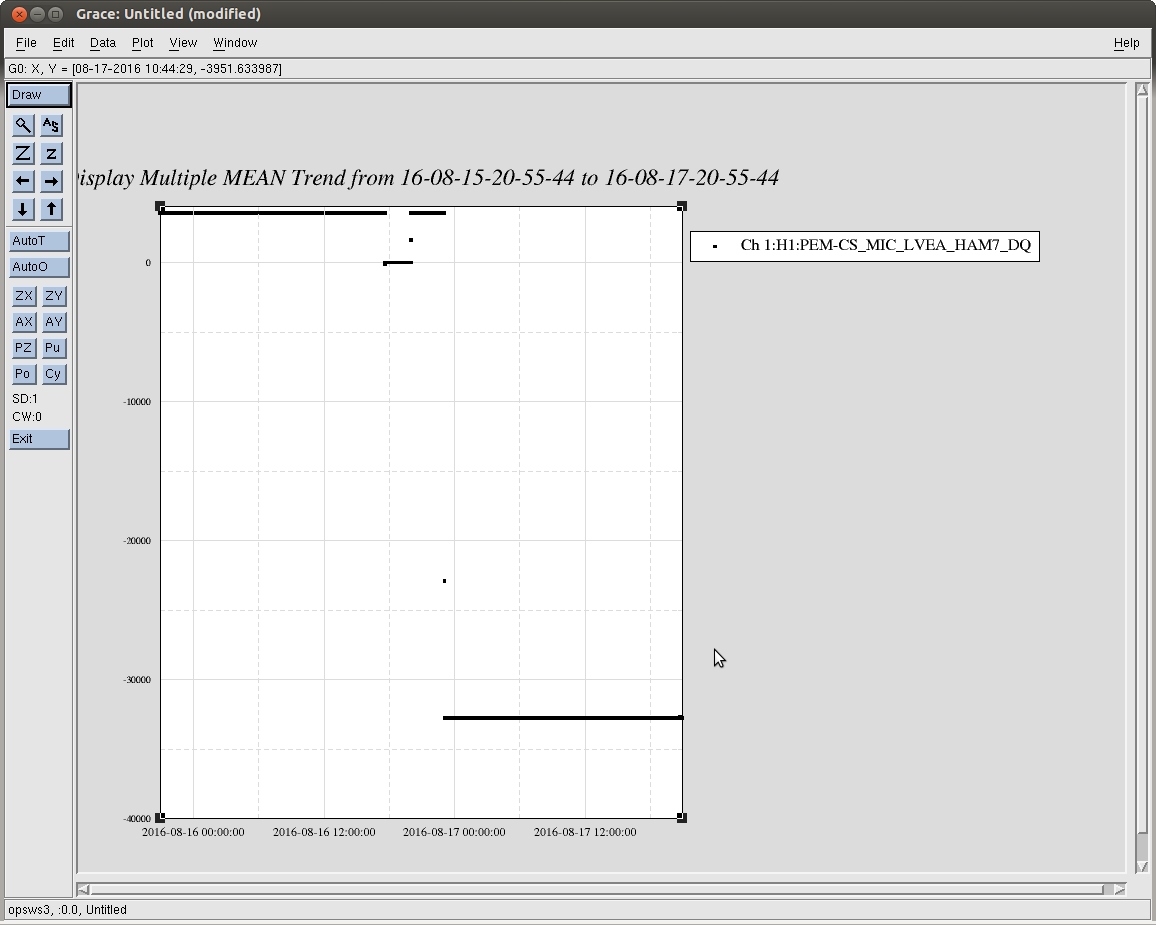
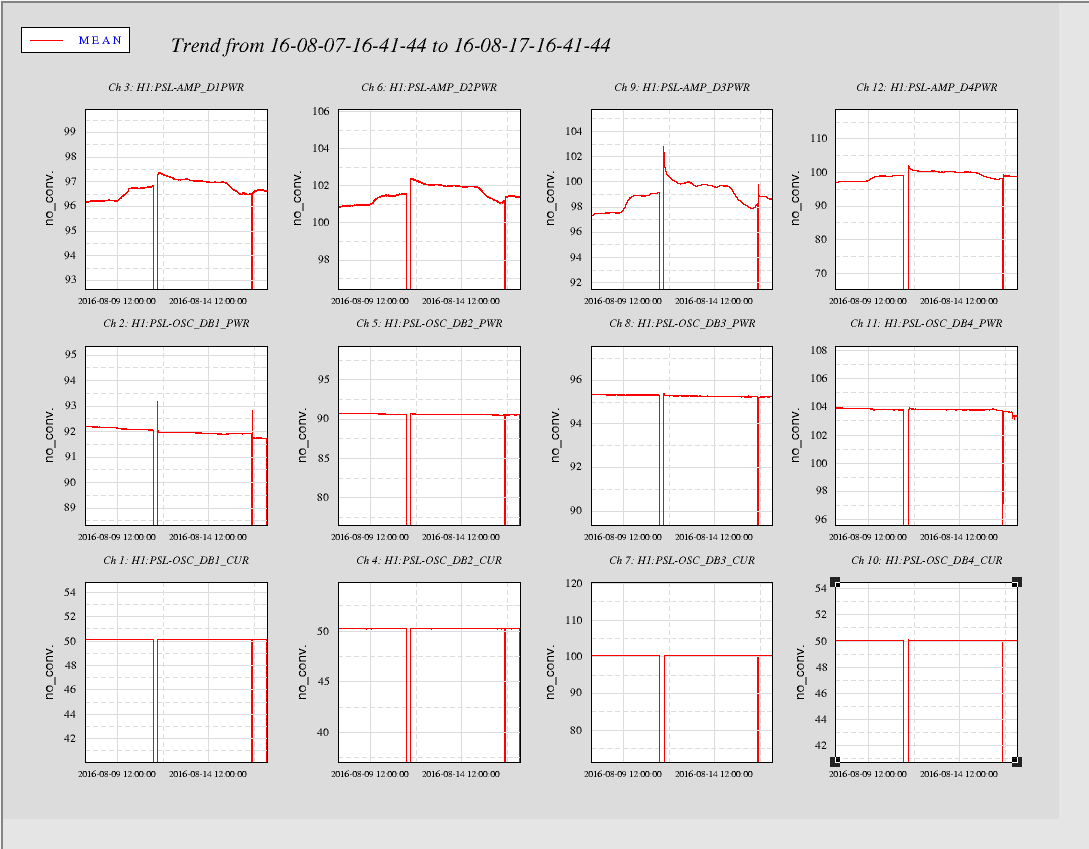
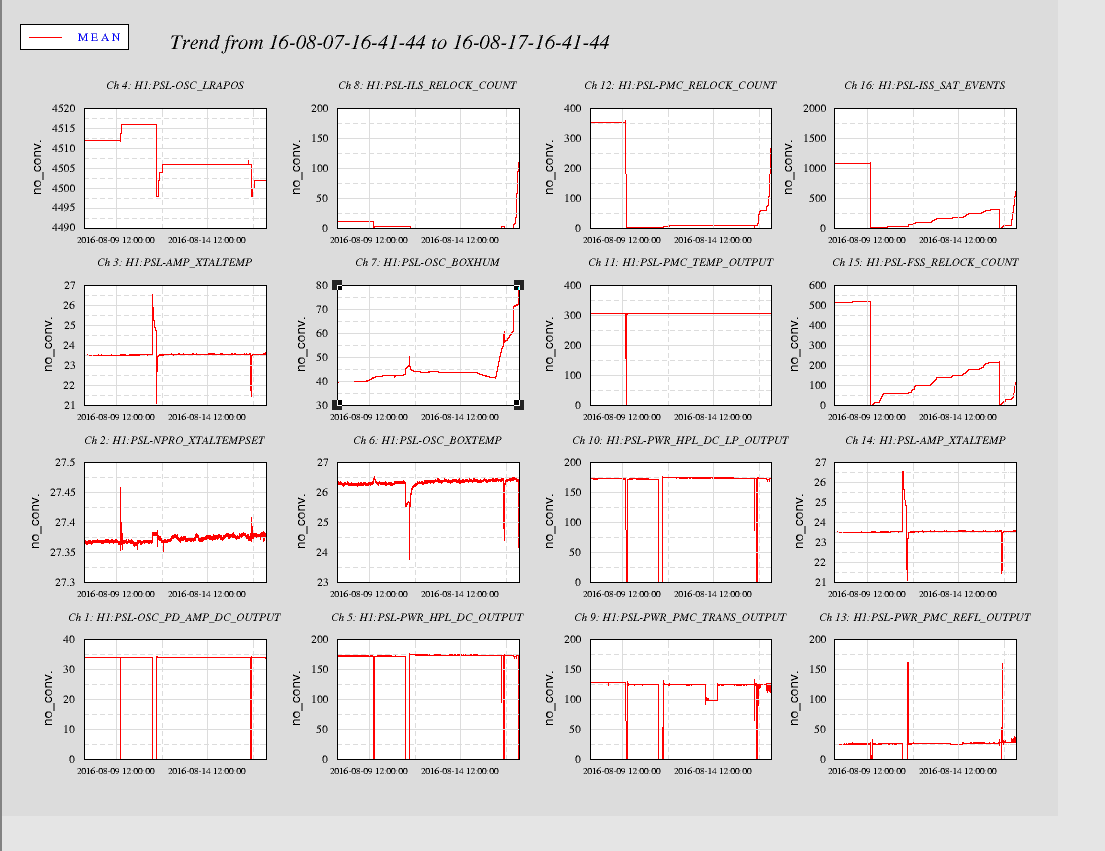
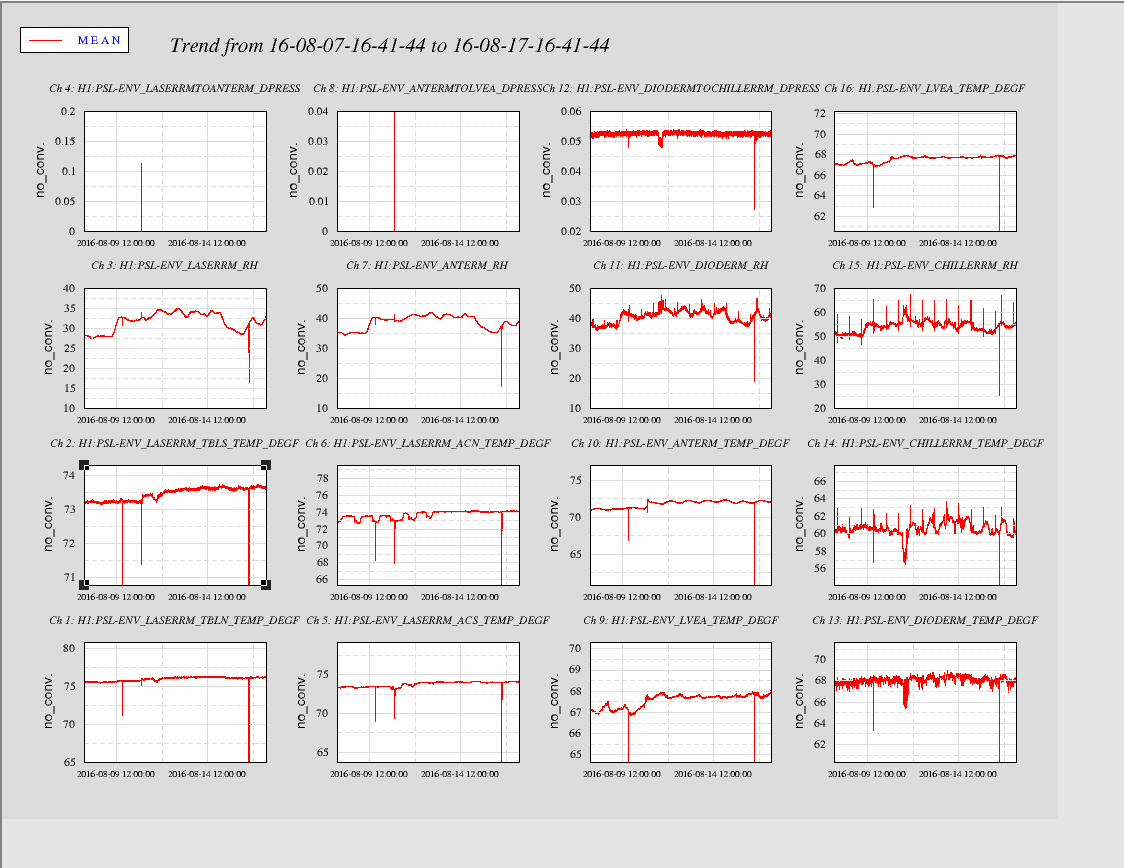
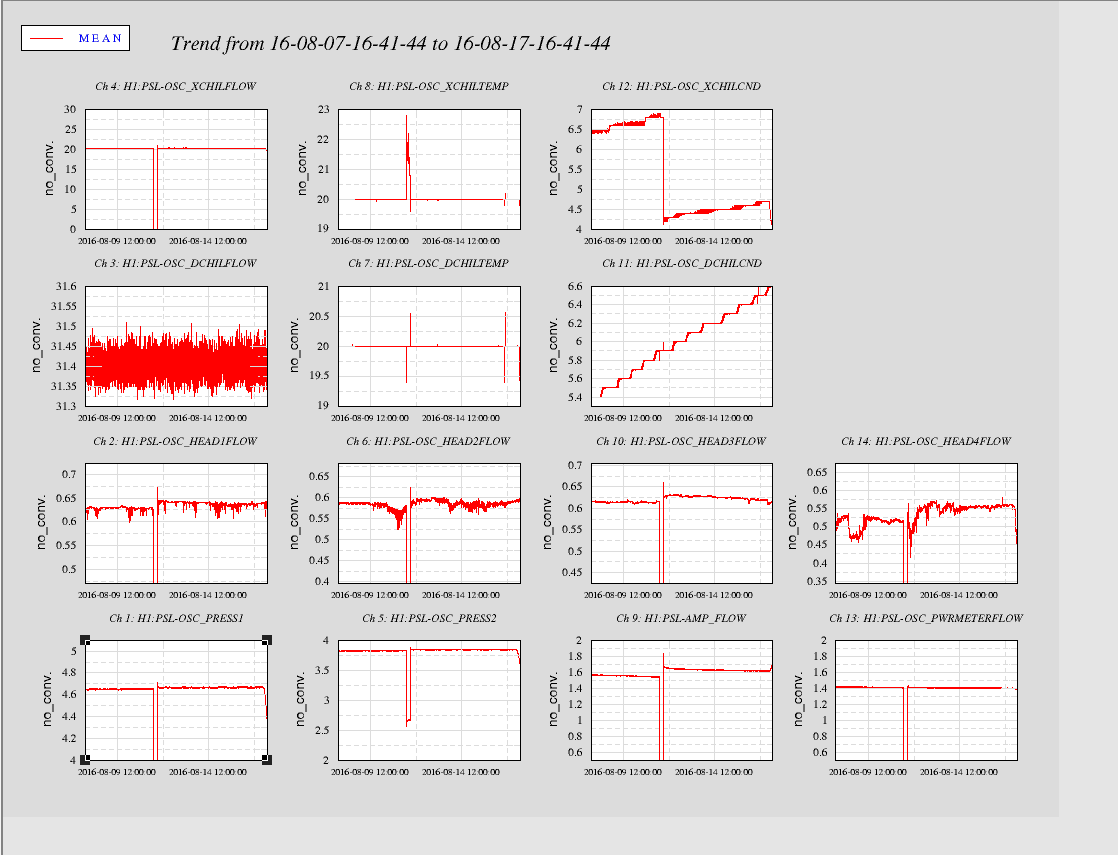
PSL Weekly 10 Day Trends
Peter, Ed
Investigation currently underway regarding potential water leak in HPO.
Images attached to this report
Comments related to this report
Water Leak CONFIRMED For H1 PSL!
Peter & Ed are addressing it in the H1 PSL Room. Vern notified.
Peter said we will be down rest of today and possibly tomorrow. When TCSy work is complete, we could transition to LASER SAFE....but that will have to be after the active TCSy work.
This is FAMIS task #6109
FRS has been filed for the water leak: FRS#6063