[Betsy, Corey, TJ, Koji]
- Now the OMC cavity is flashing!
- The OM1~3 and OMC suspensions have been debiased, and the OSEMs were tweaked to have the flags at the center of them.
- The optical paths such as the OMC incident path, OM1 transmission path, OMC refl path ahve been aligned.
We still need to align the WFS and OMCT paths and confirm viewport paths if the beams are hitting the viewport.
- Currently the OMC PZT HV is ON.
=== Details ===
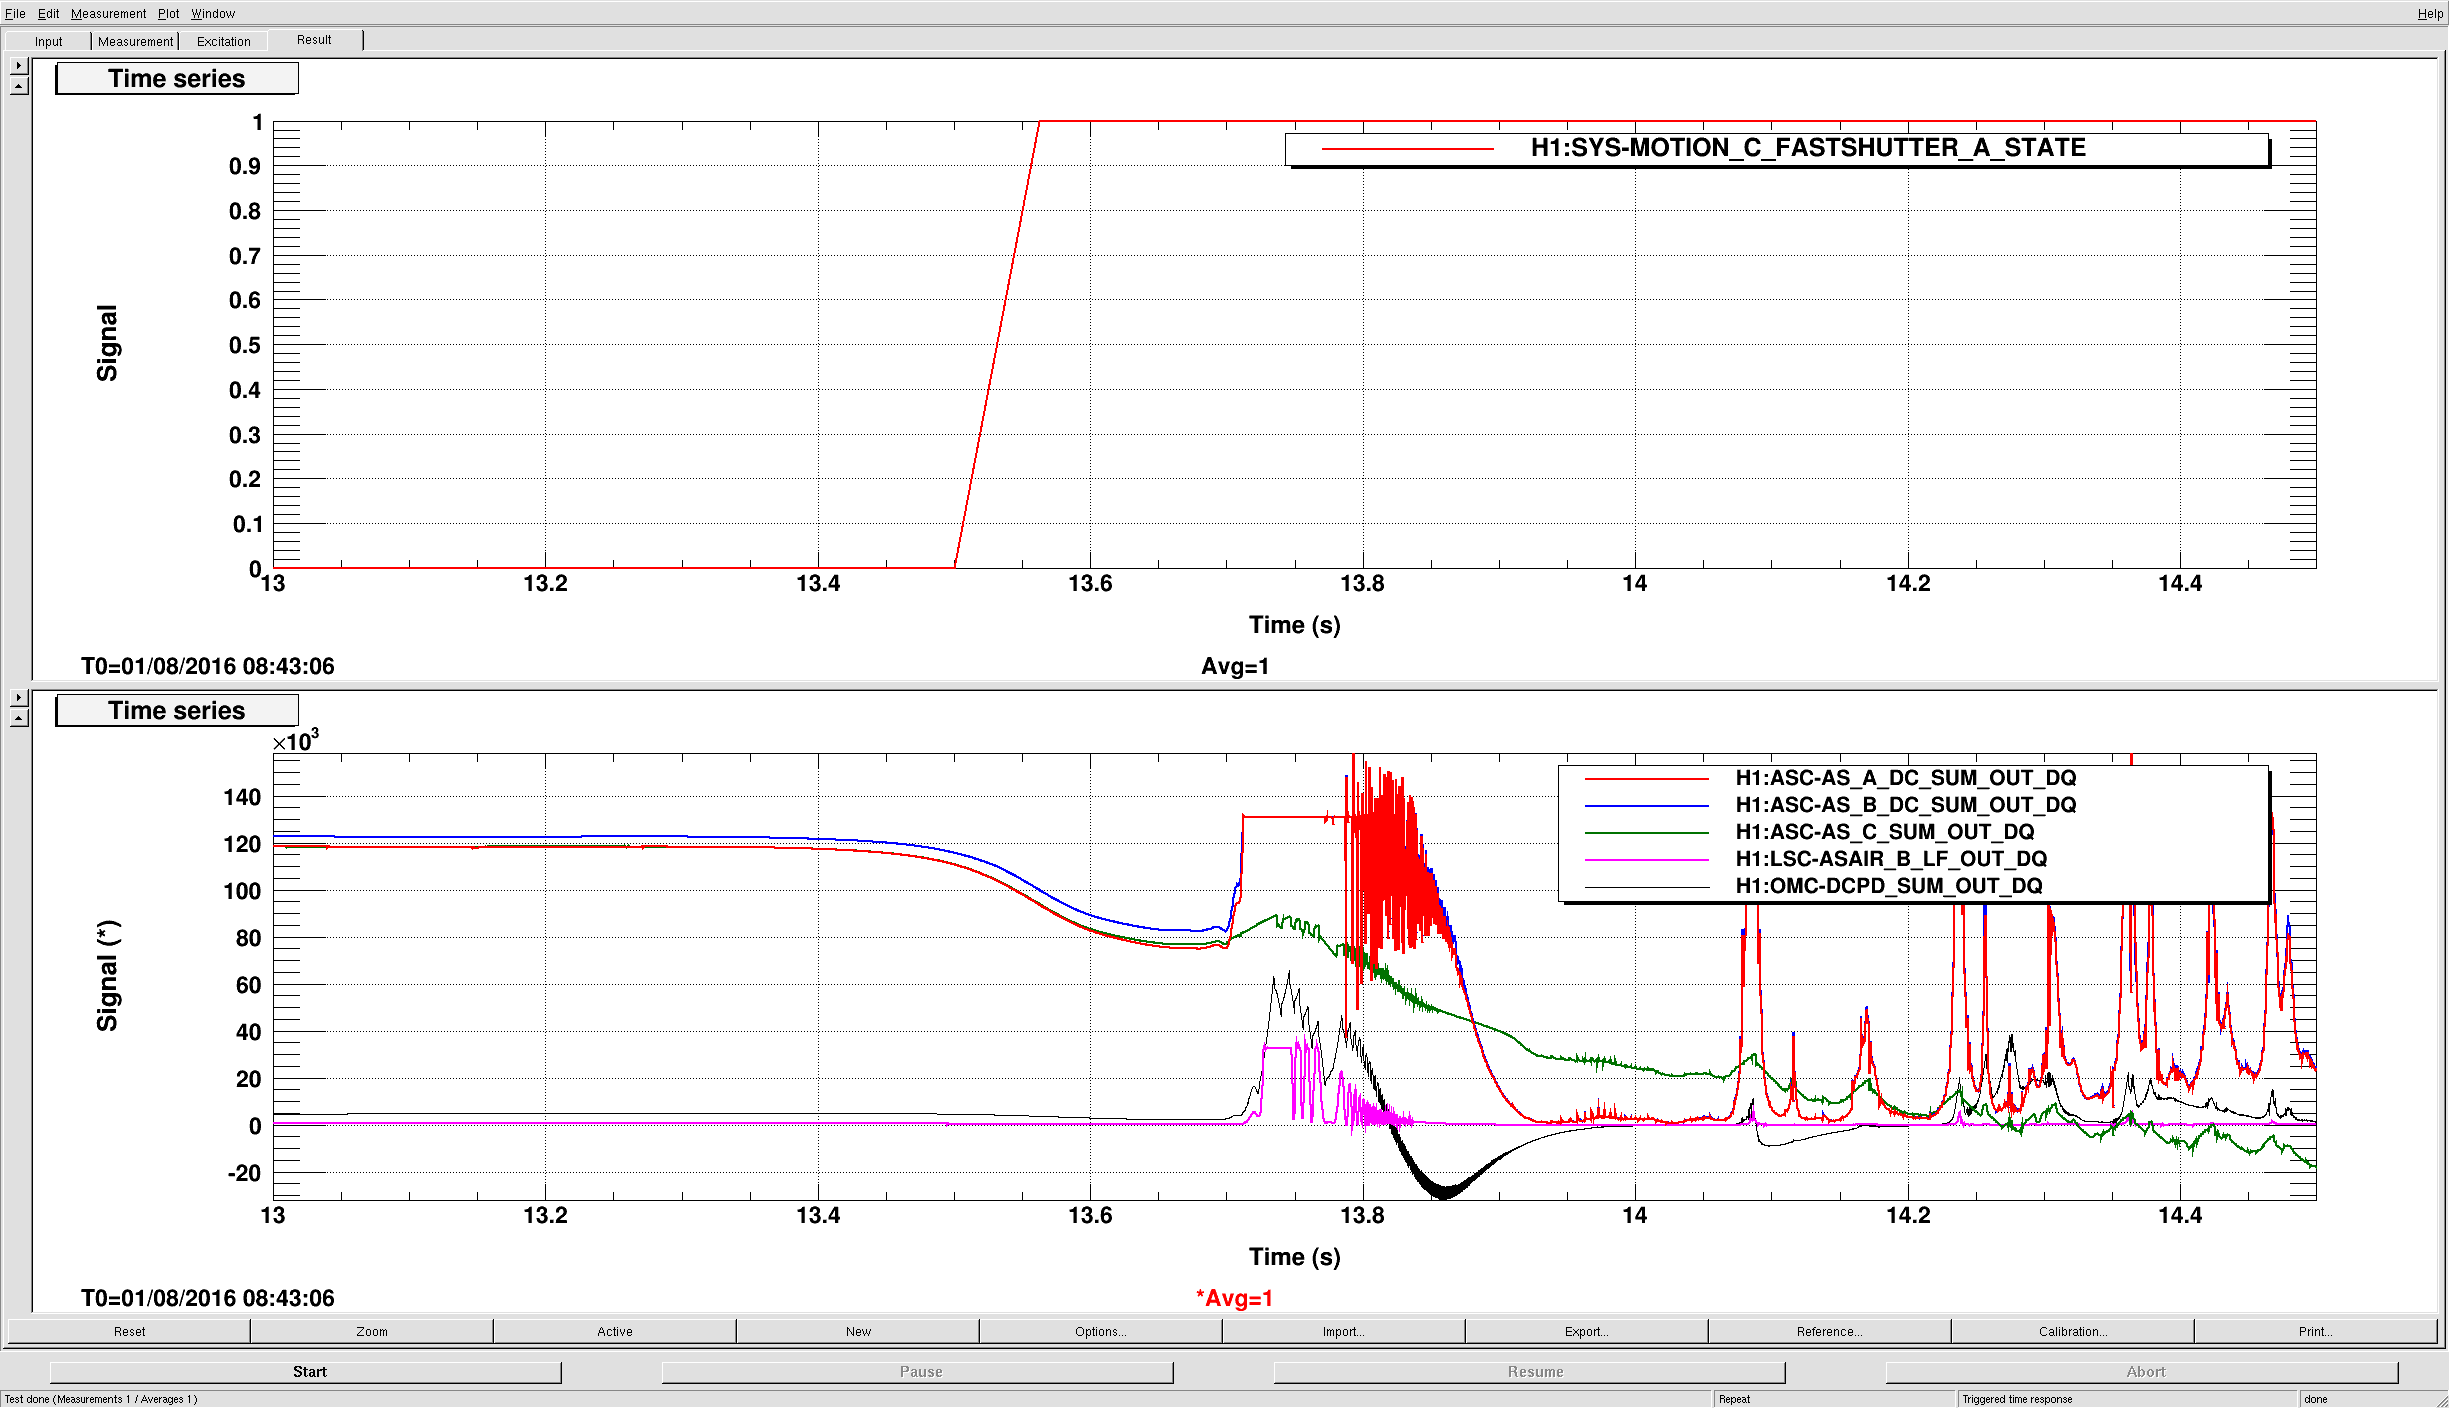
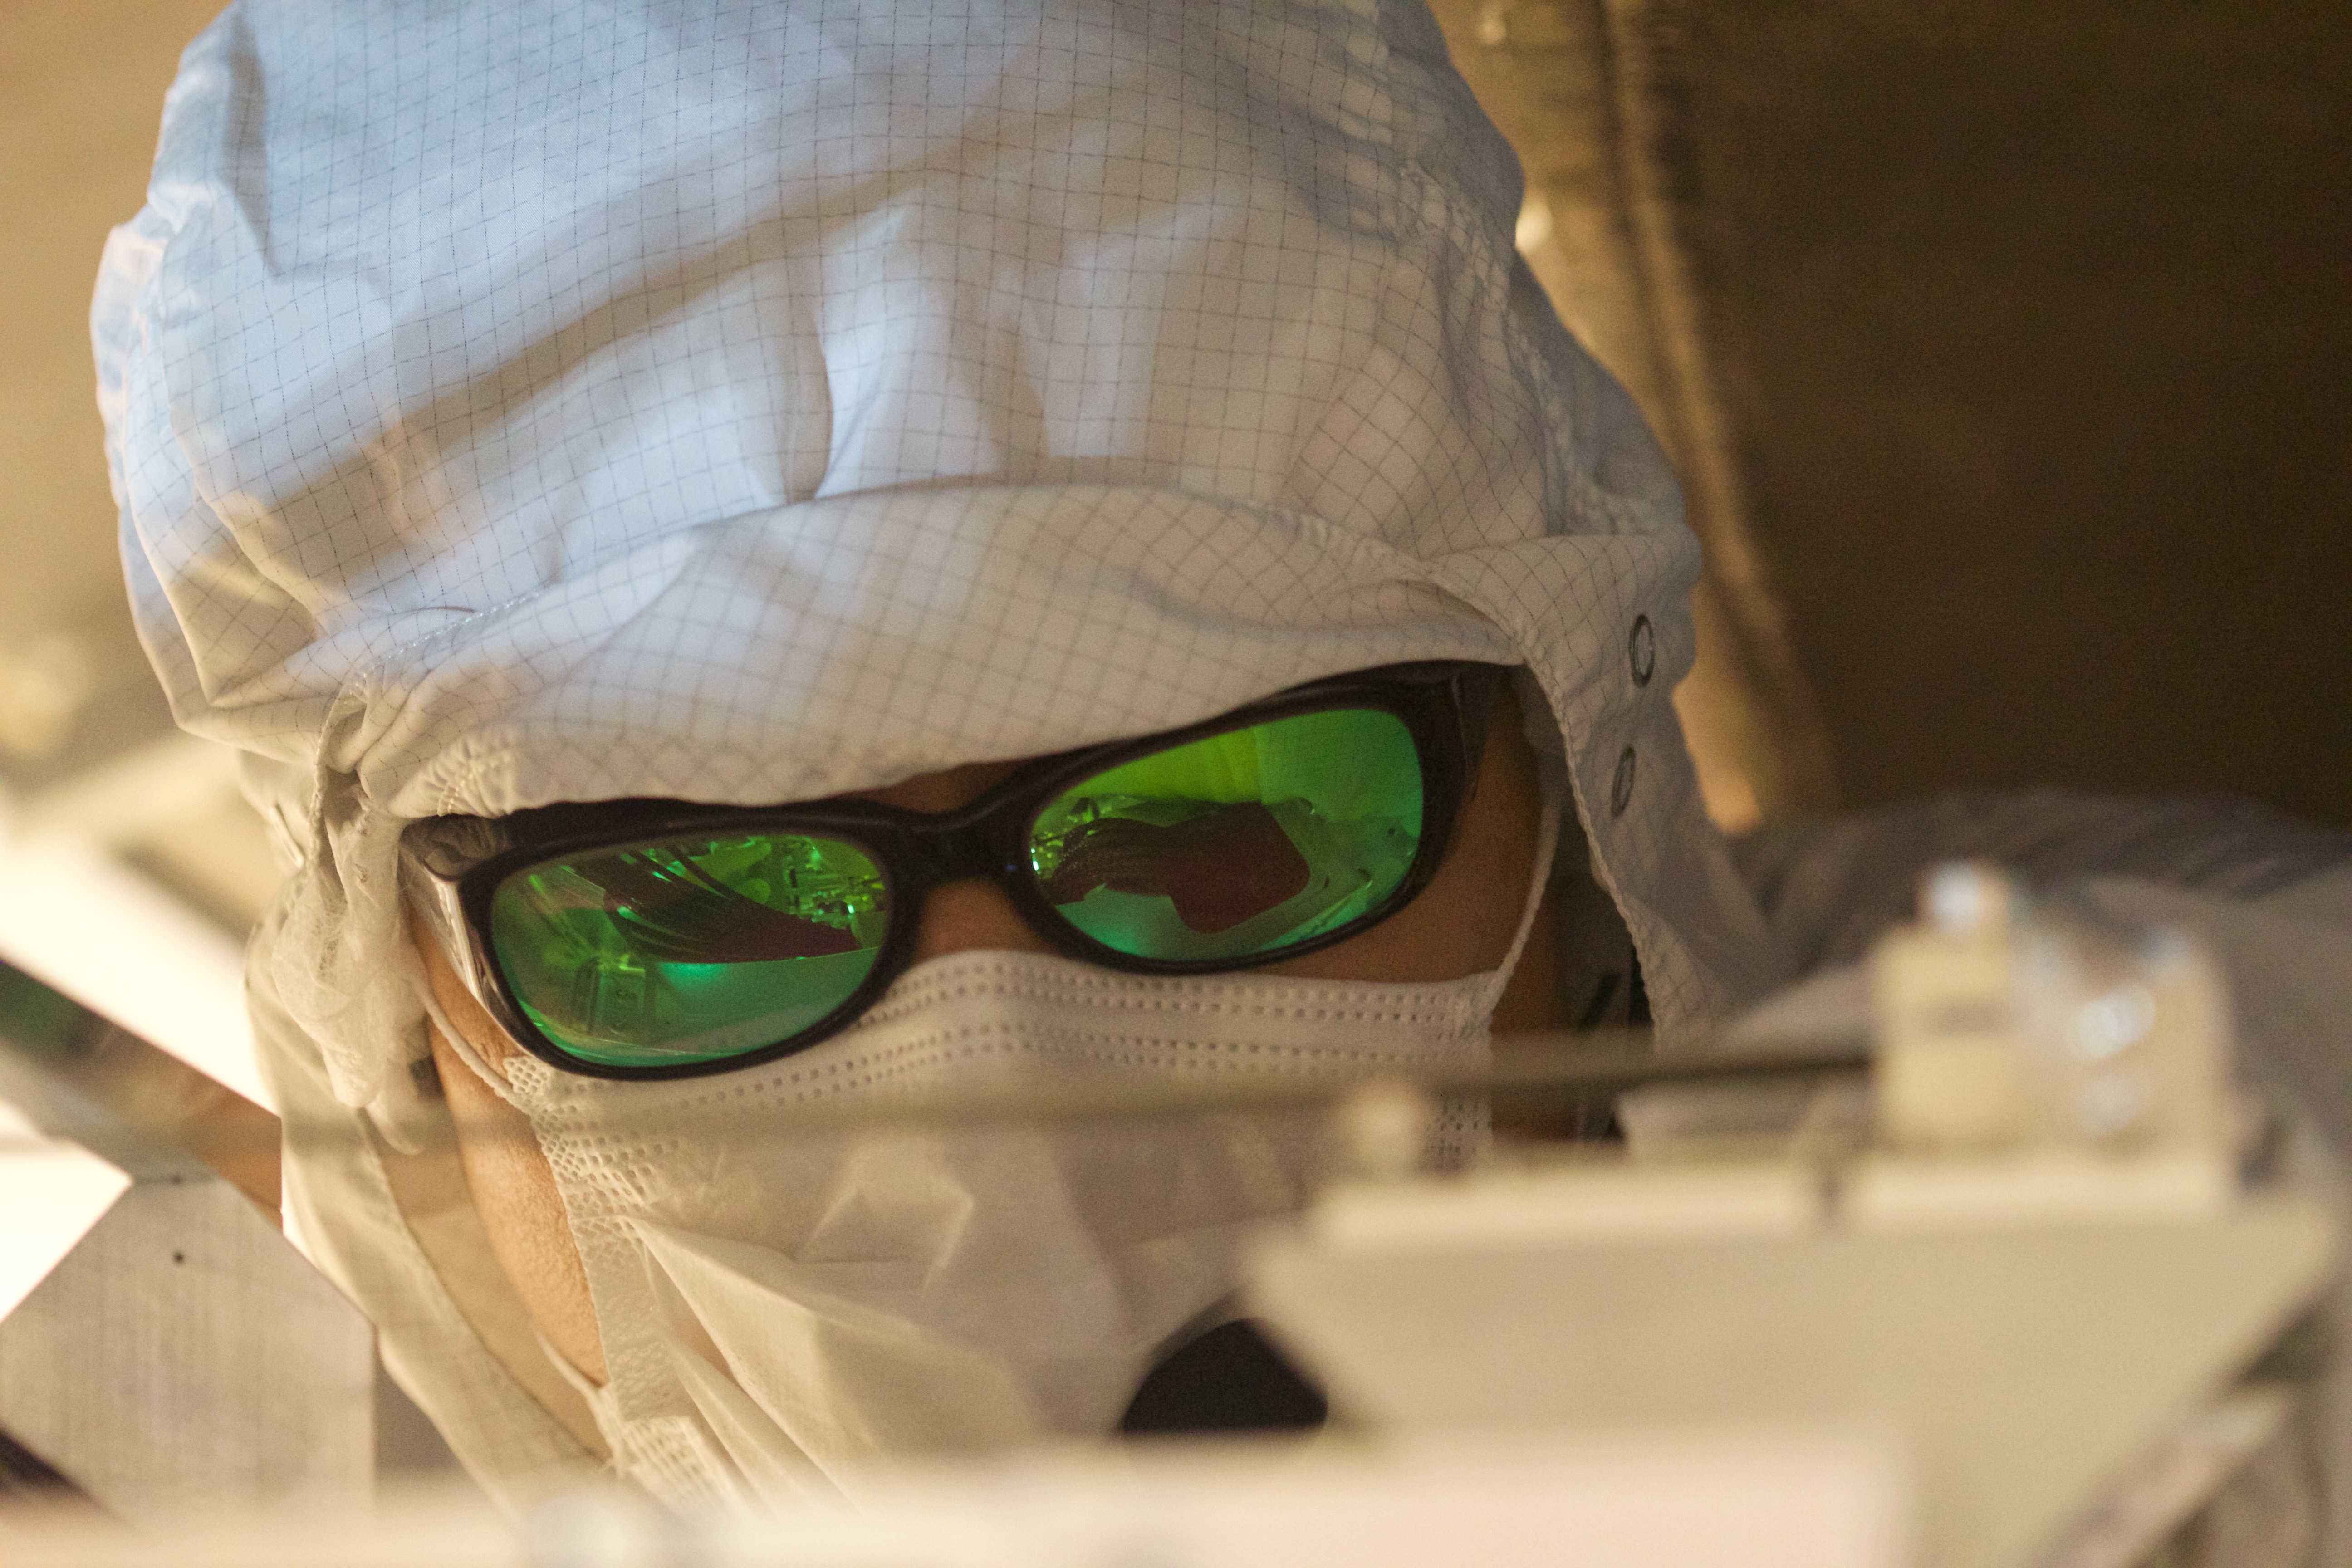
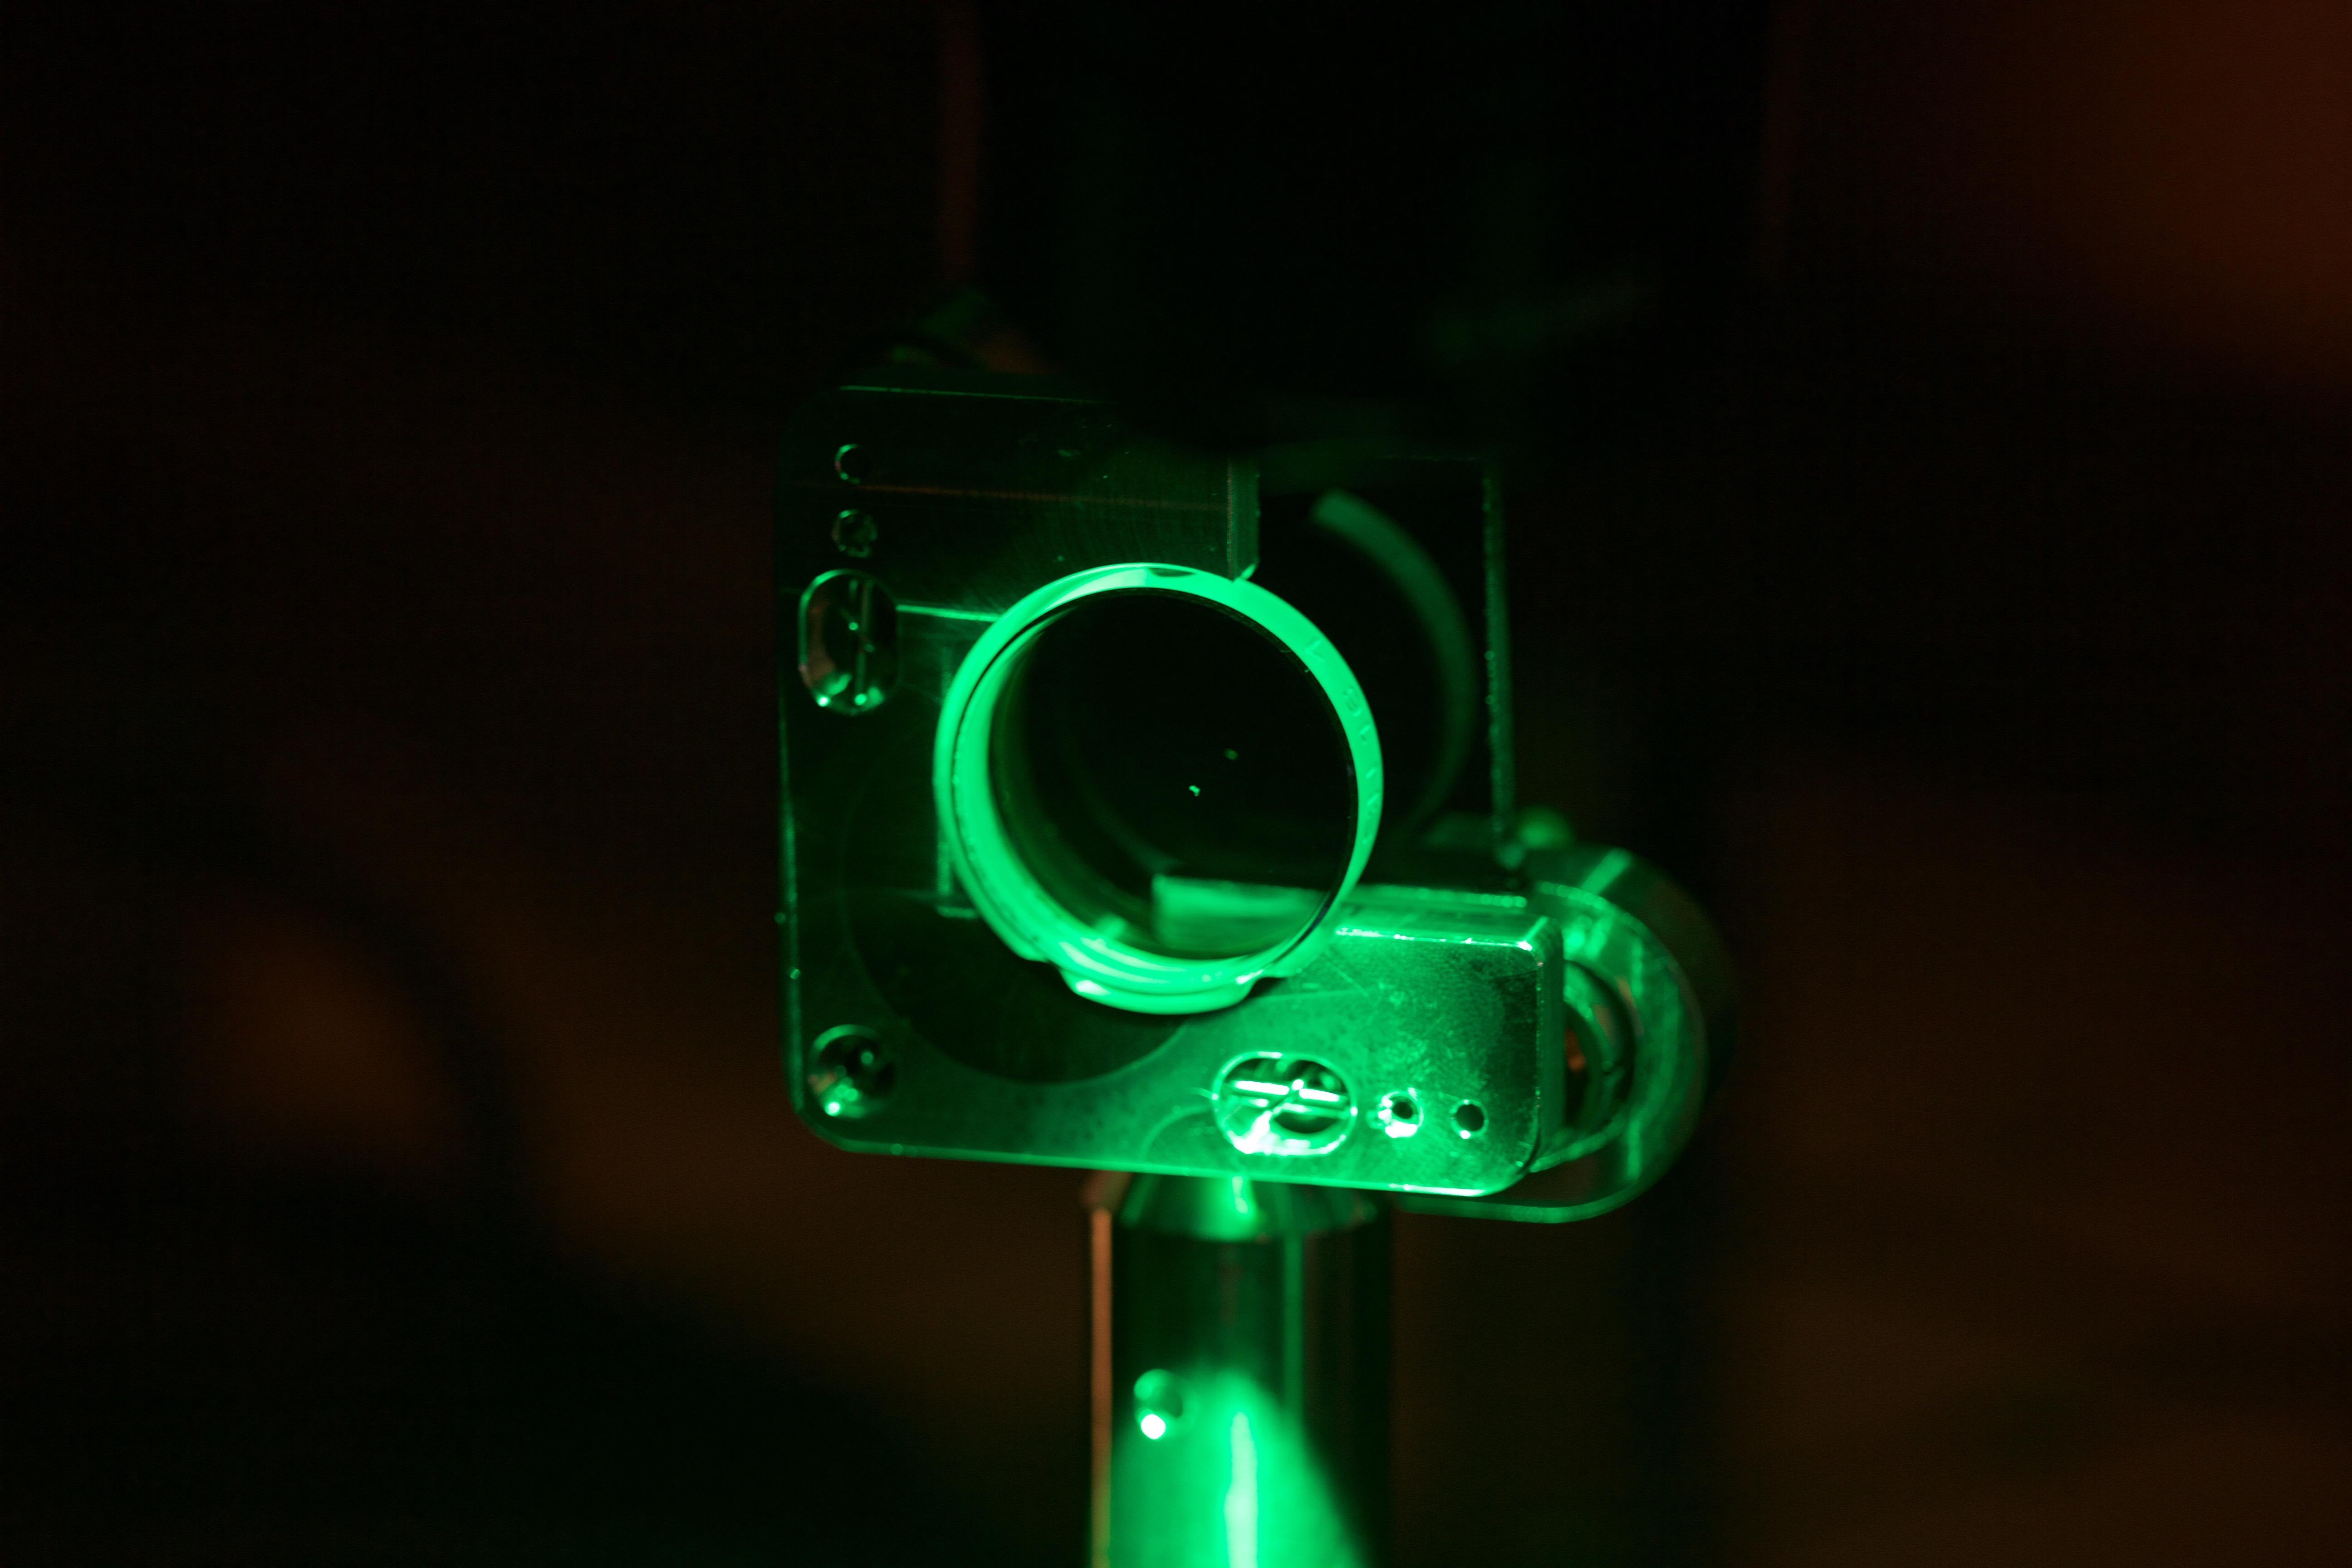
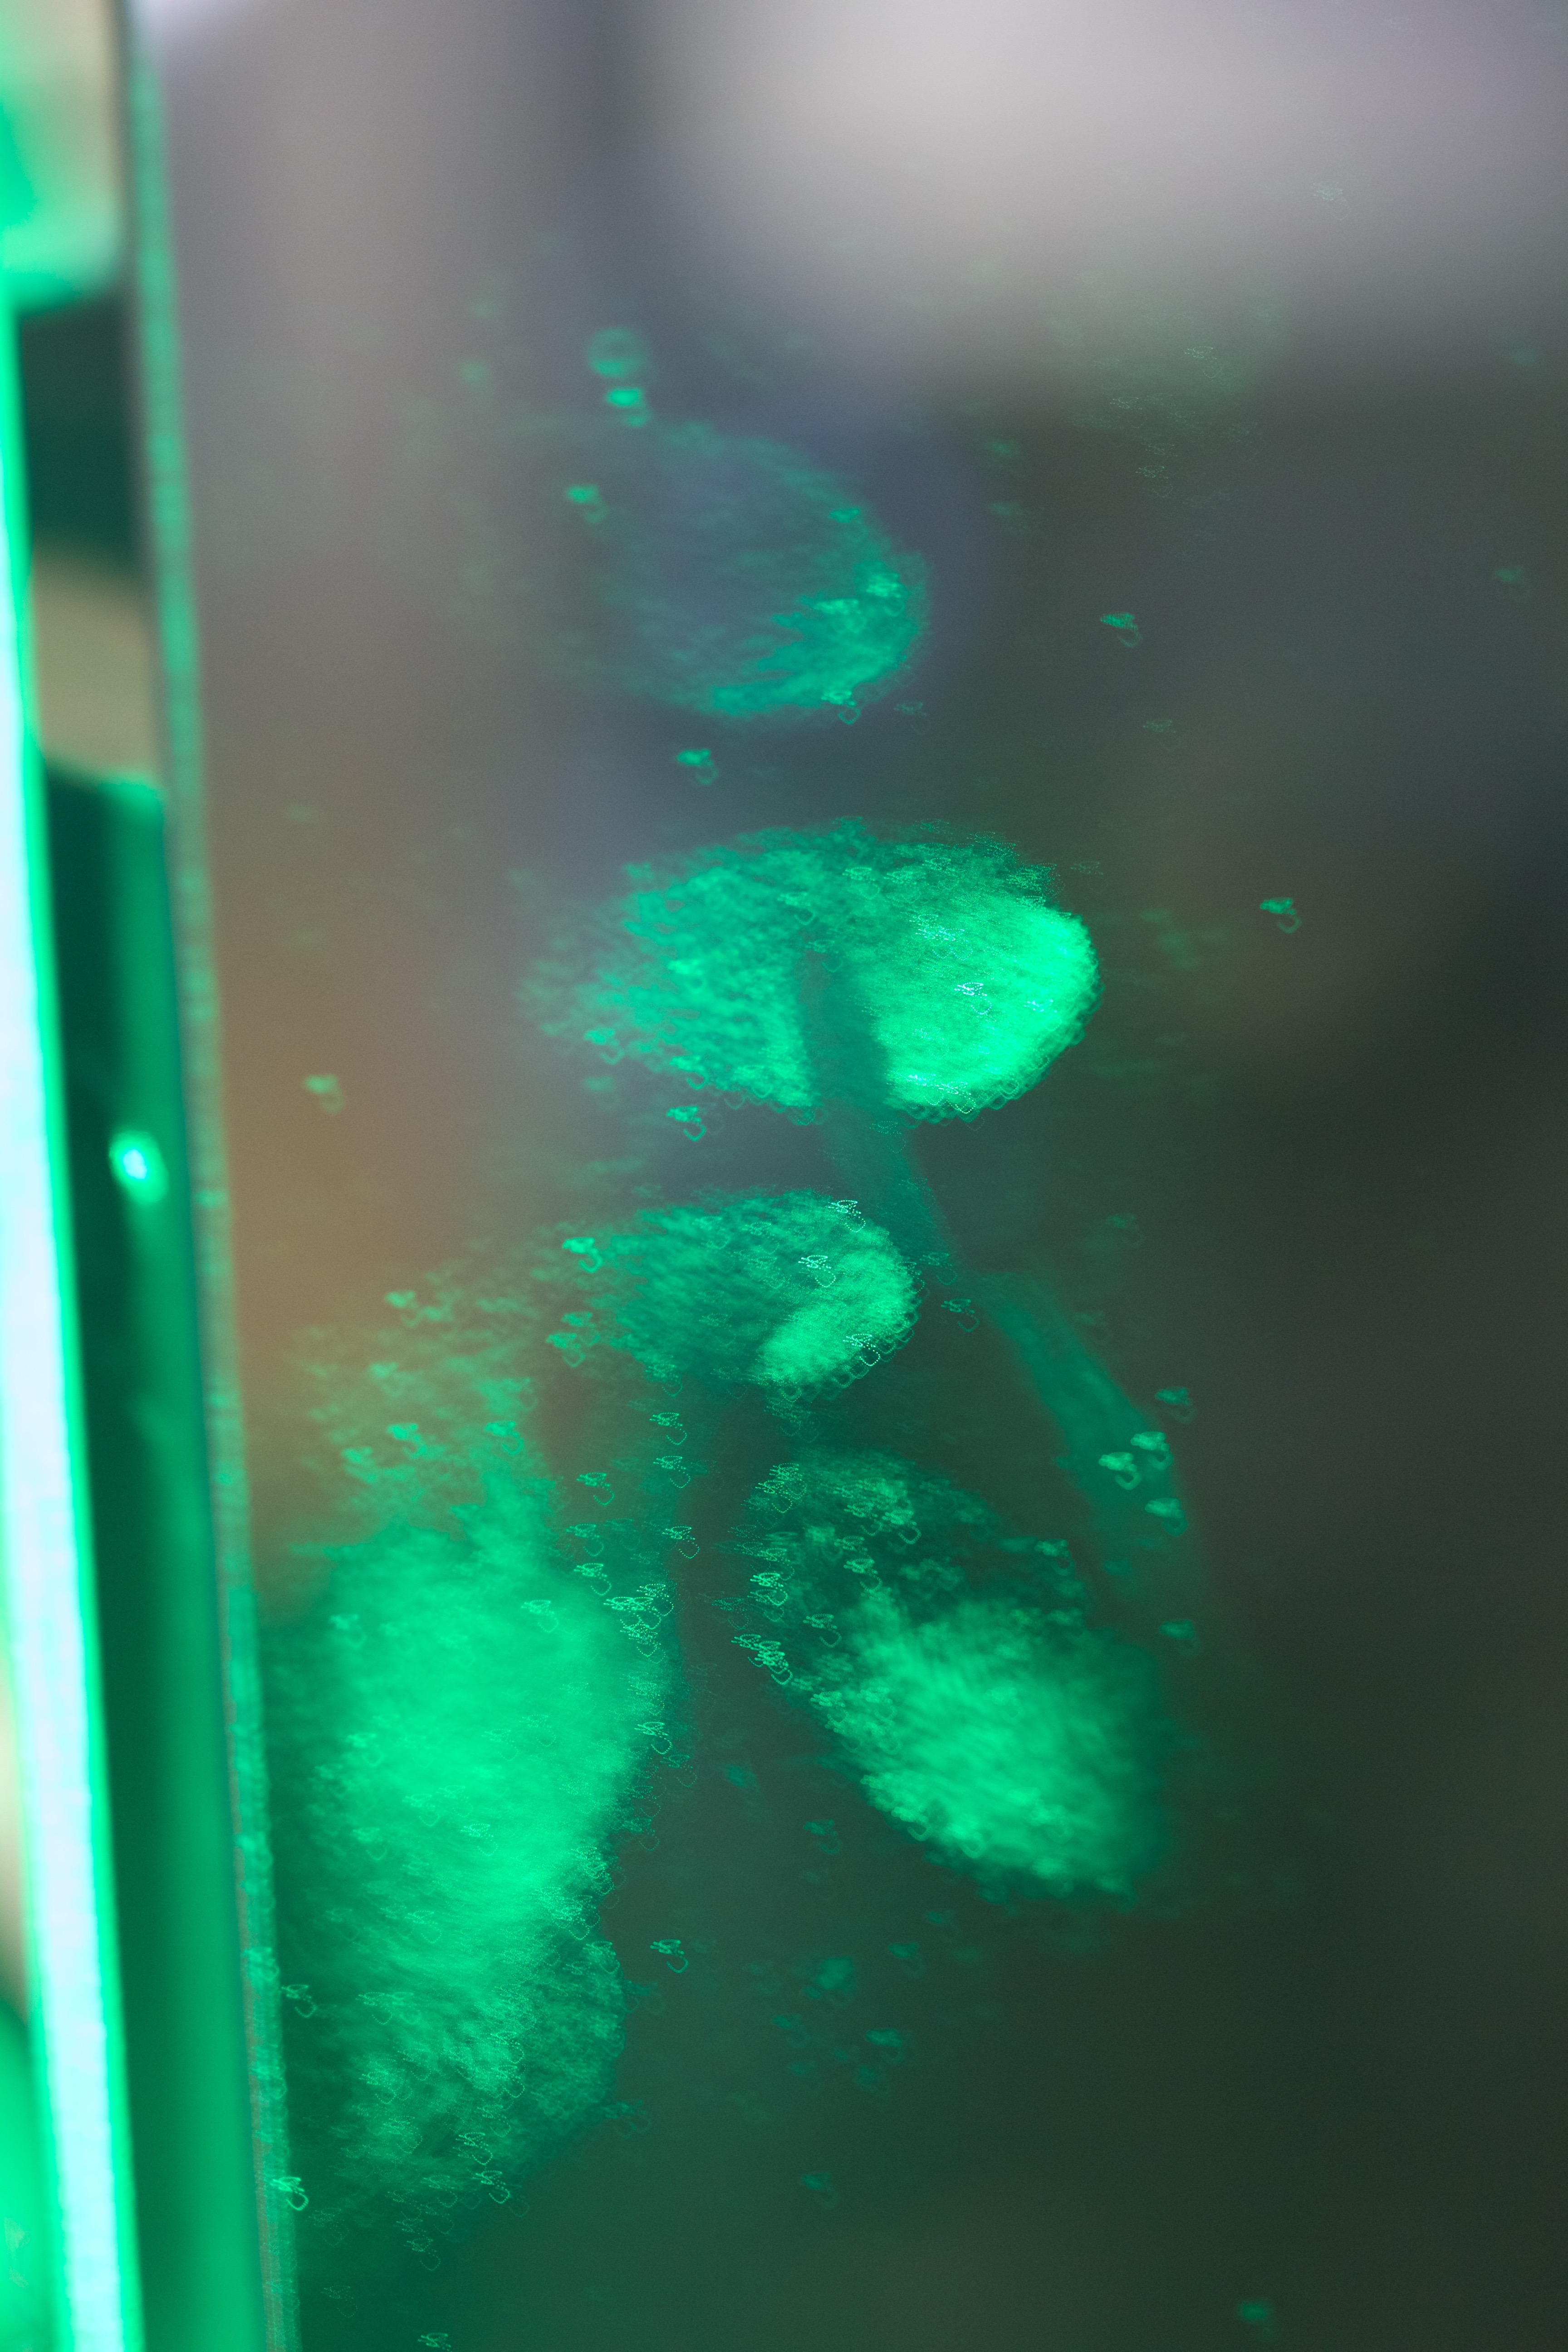
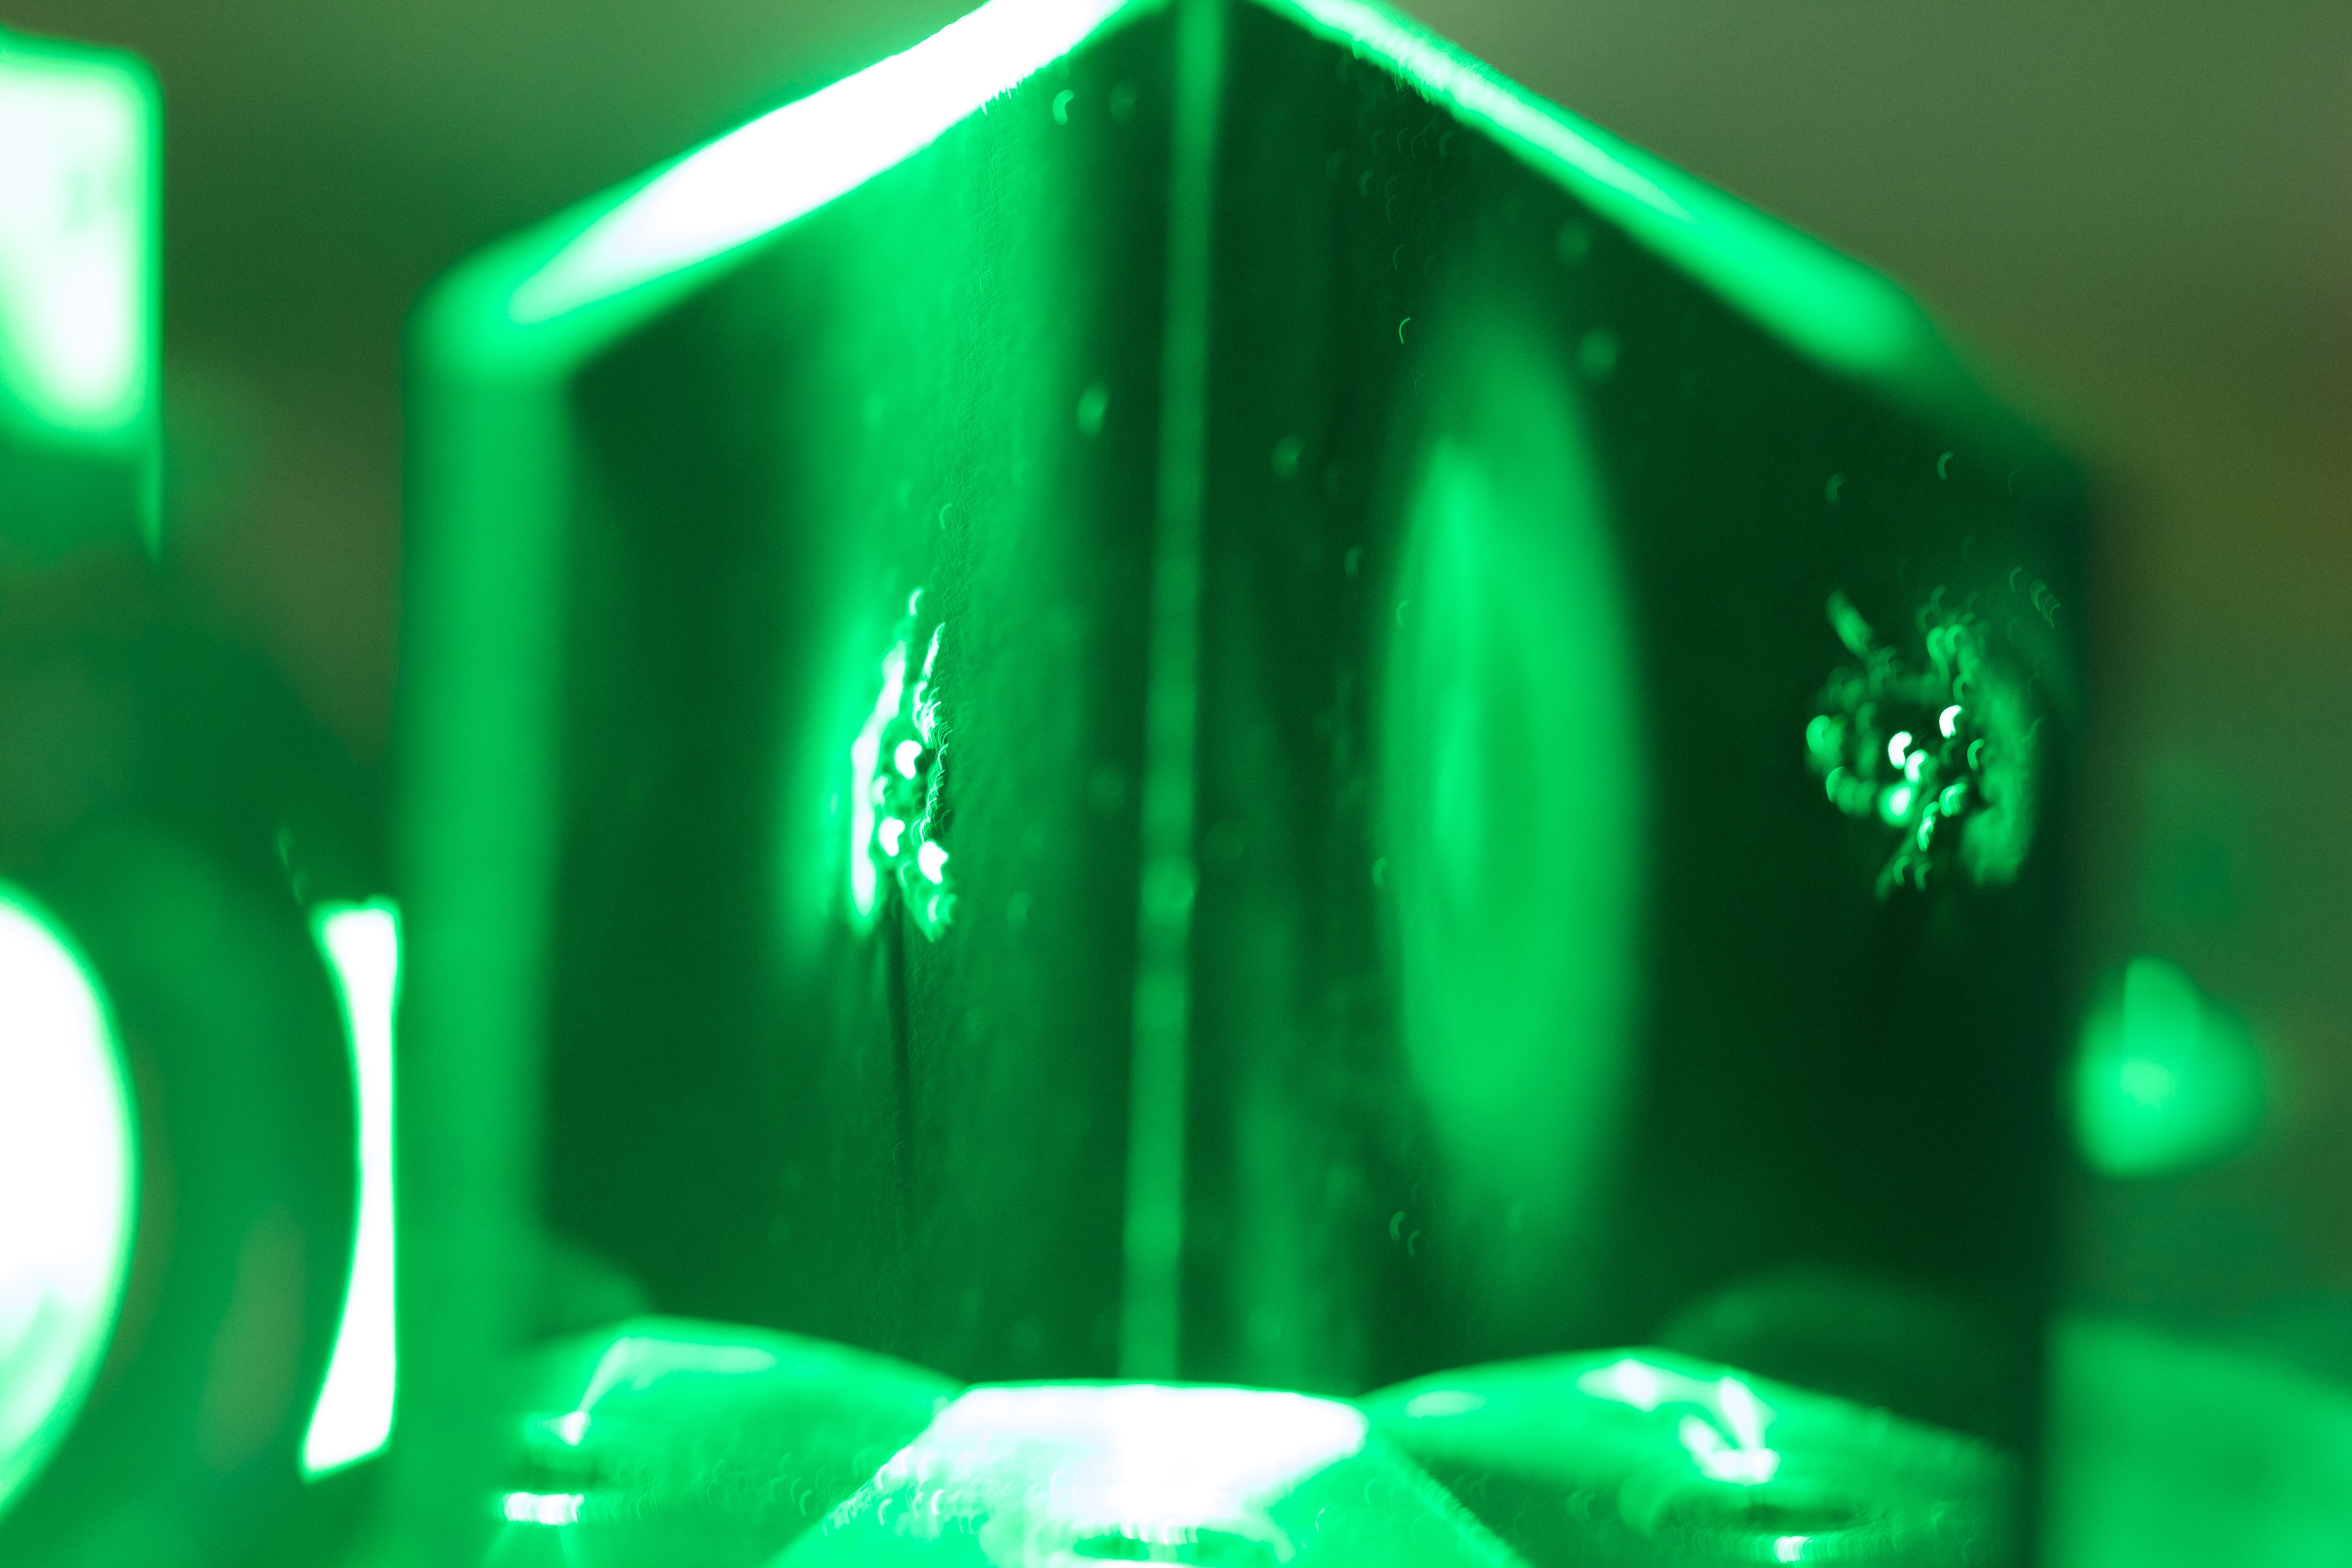
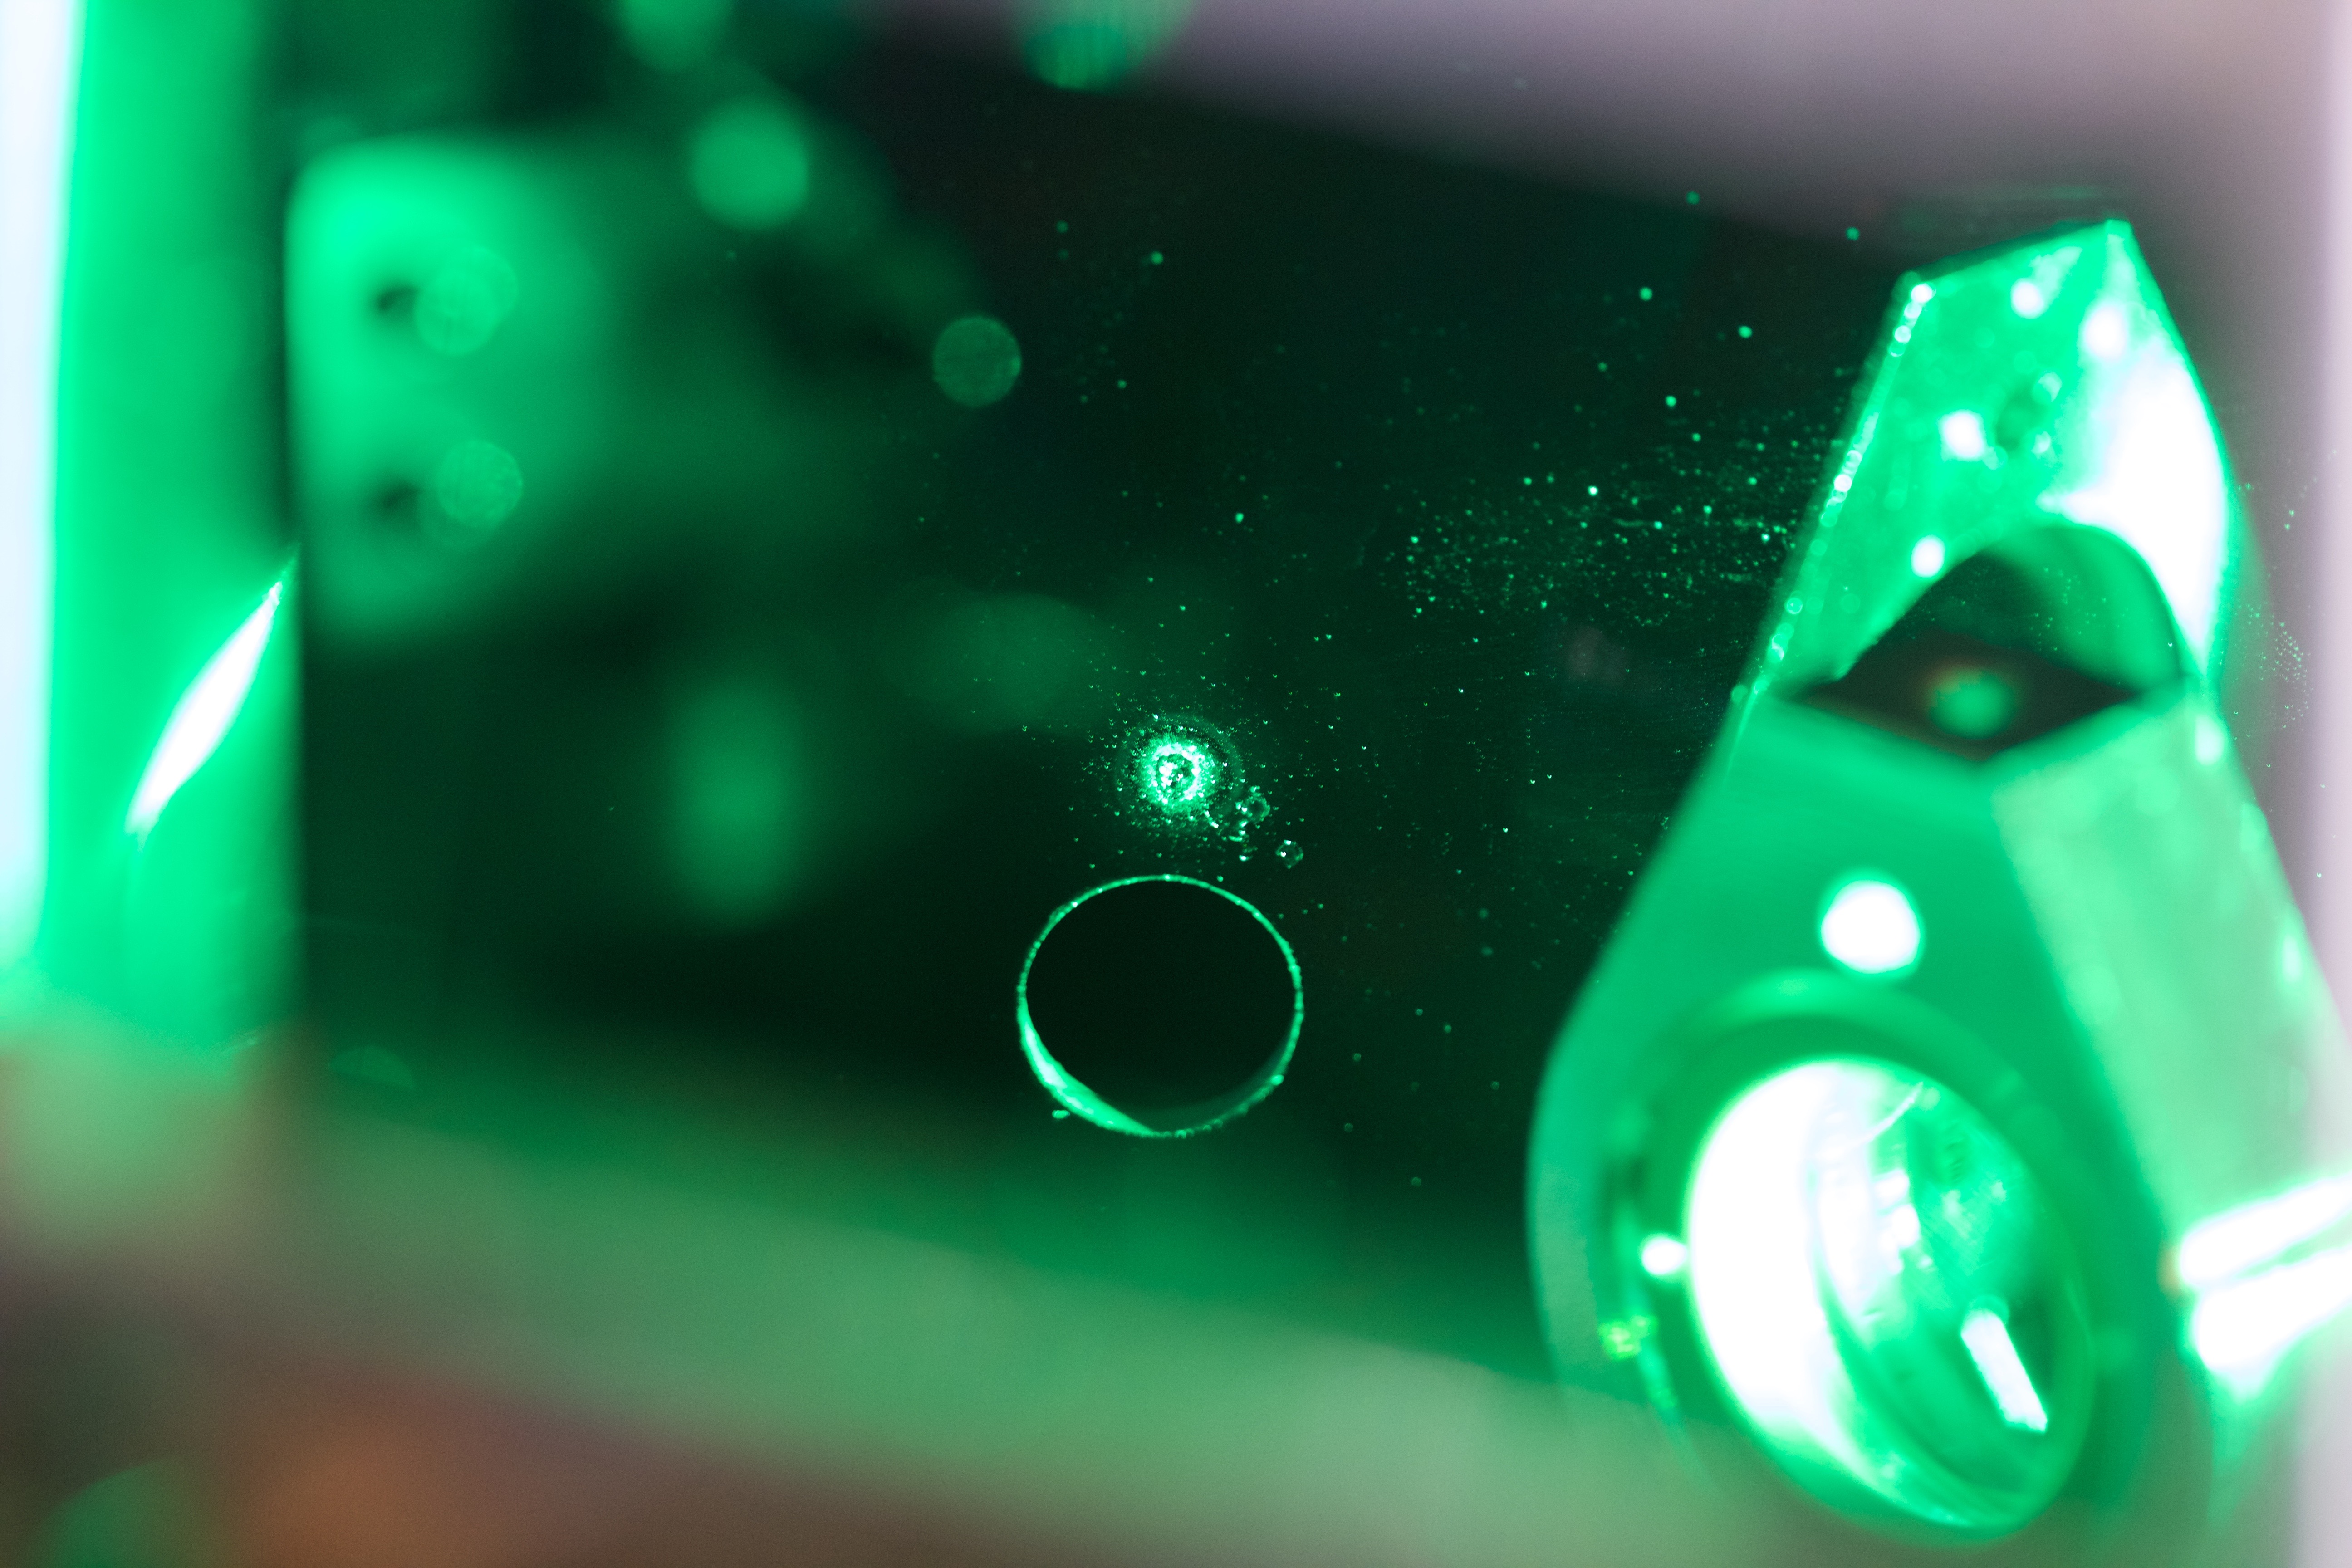
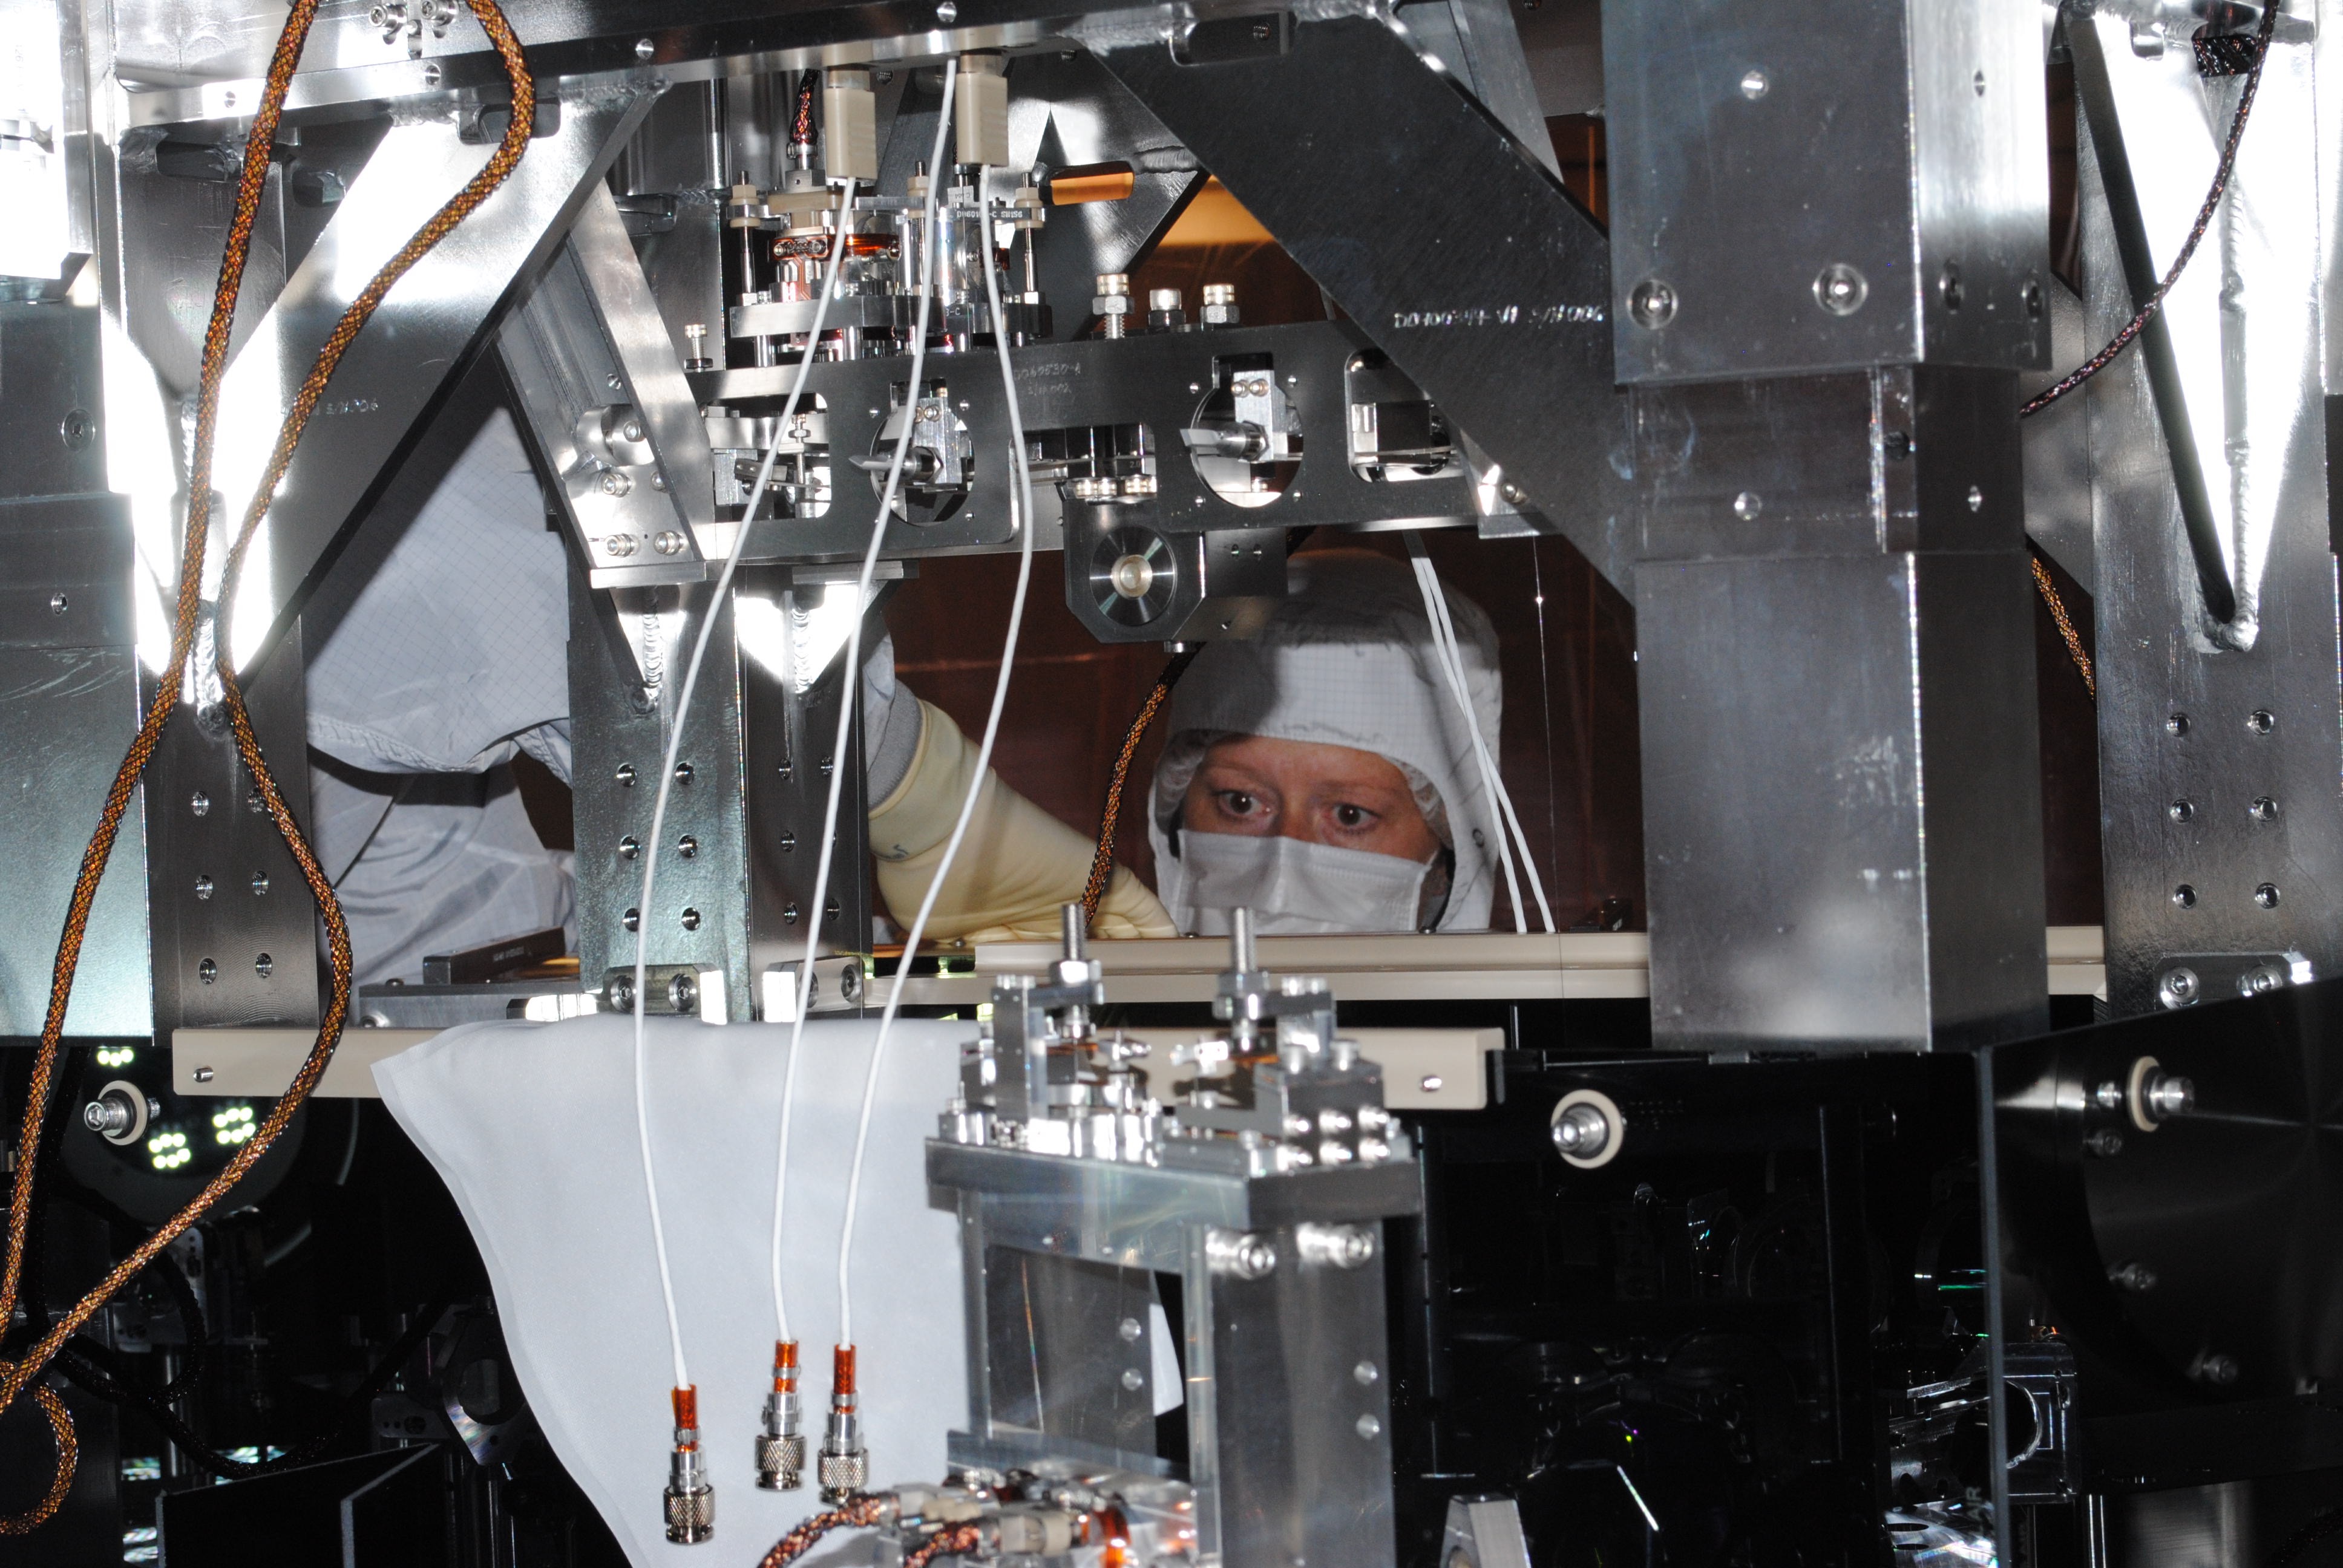
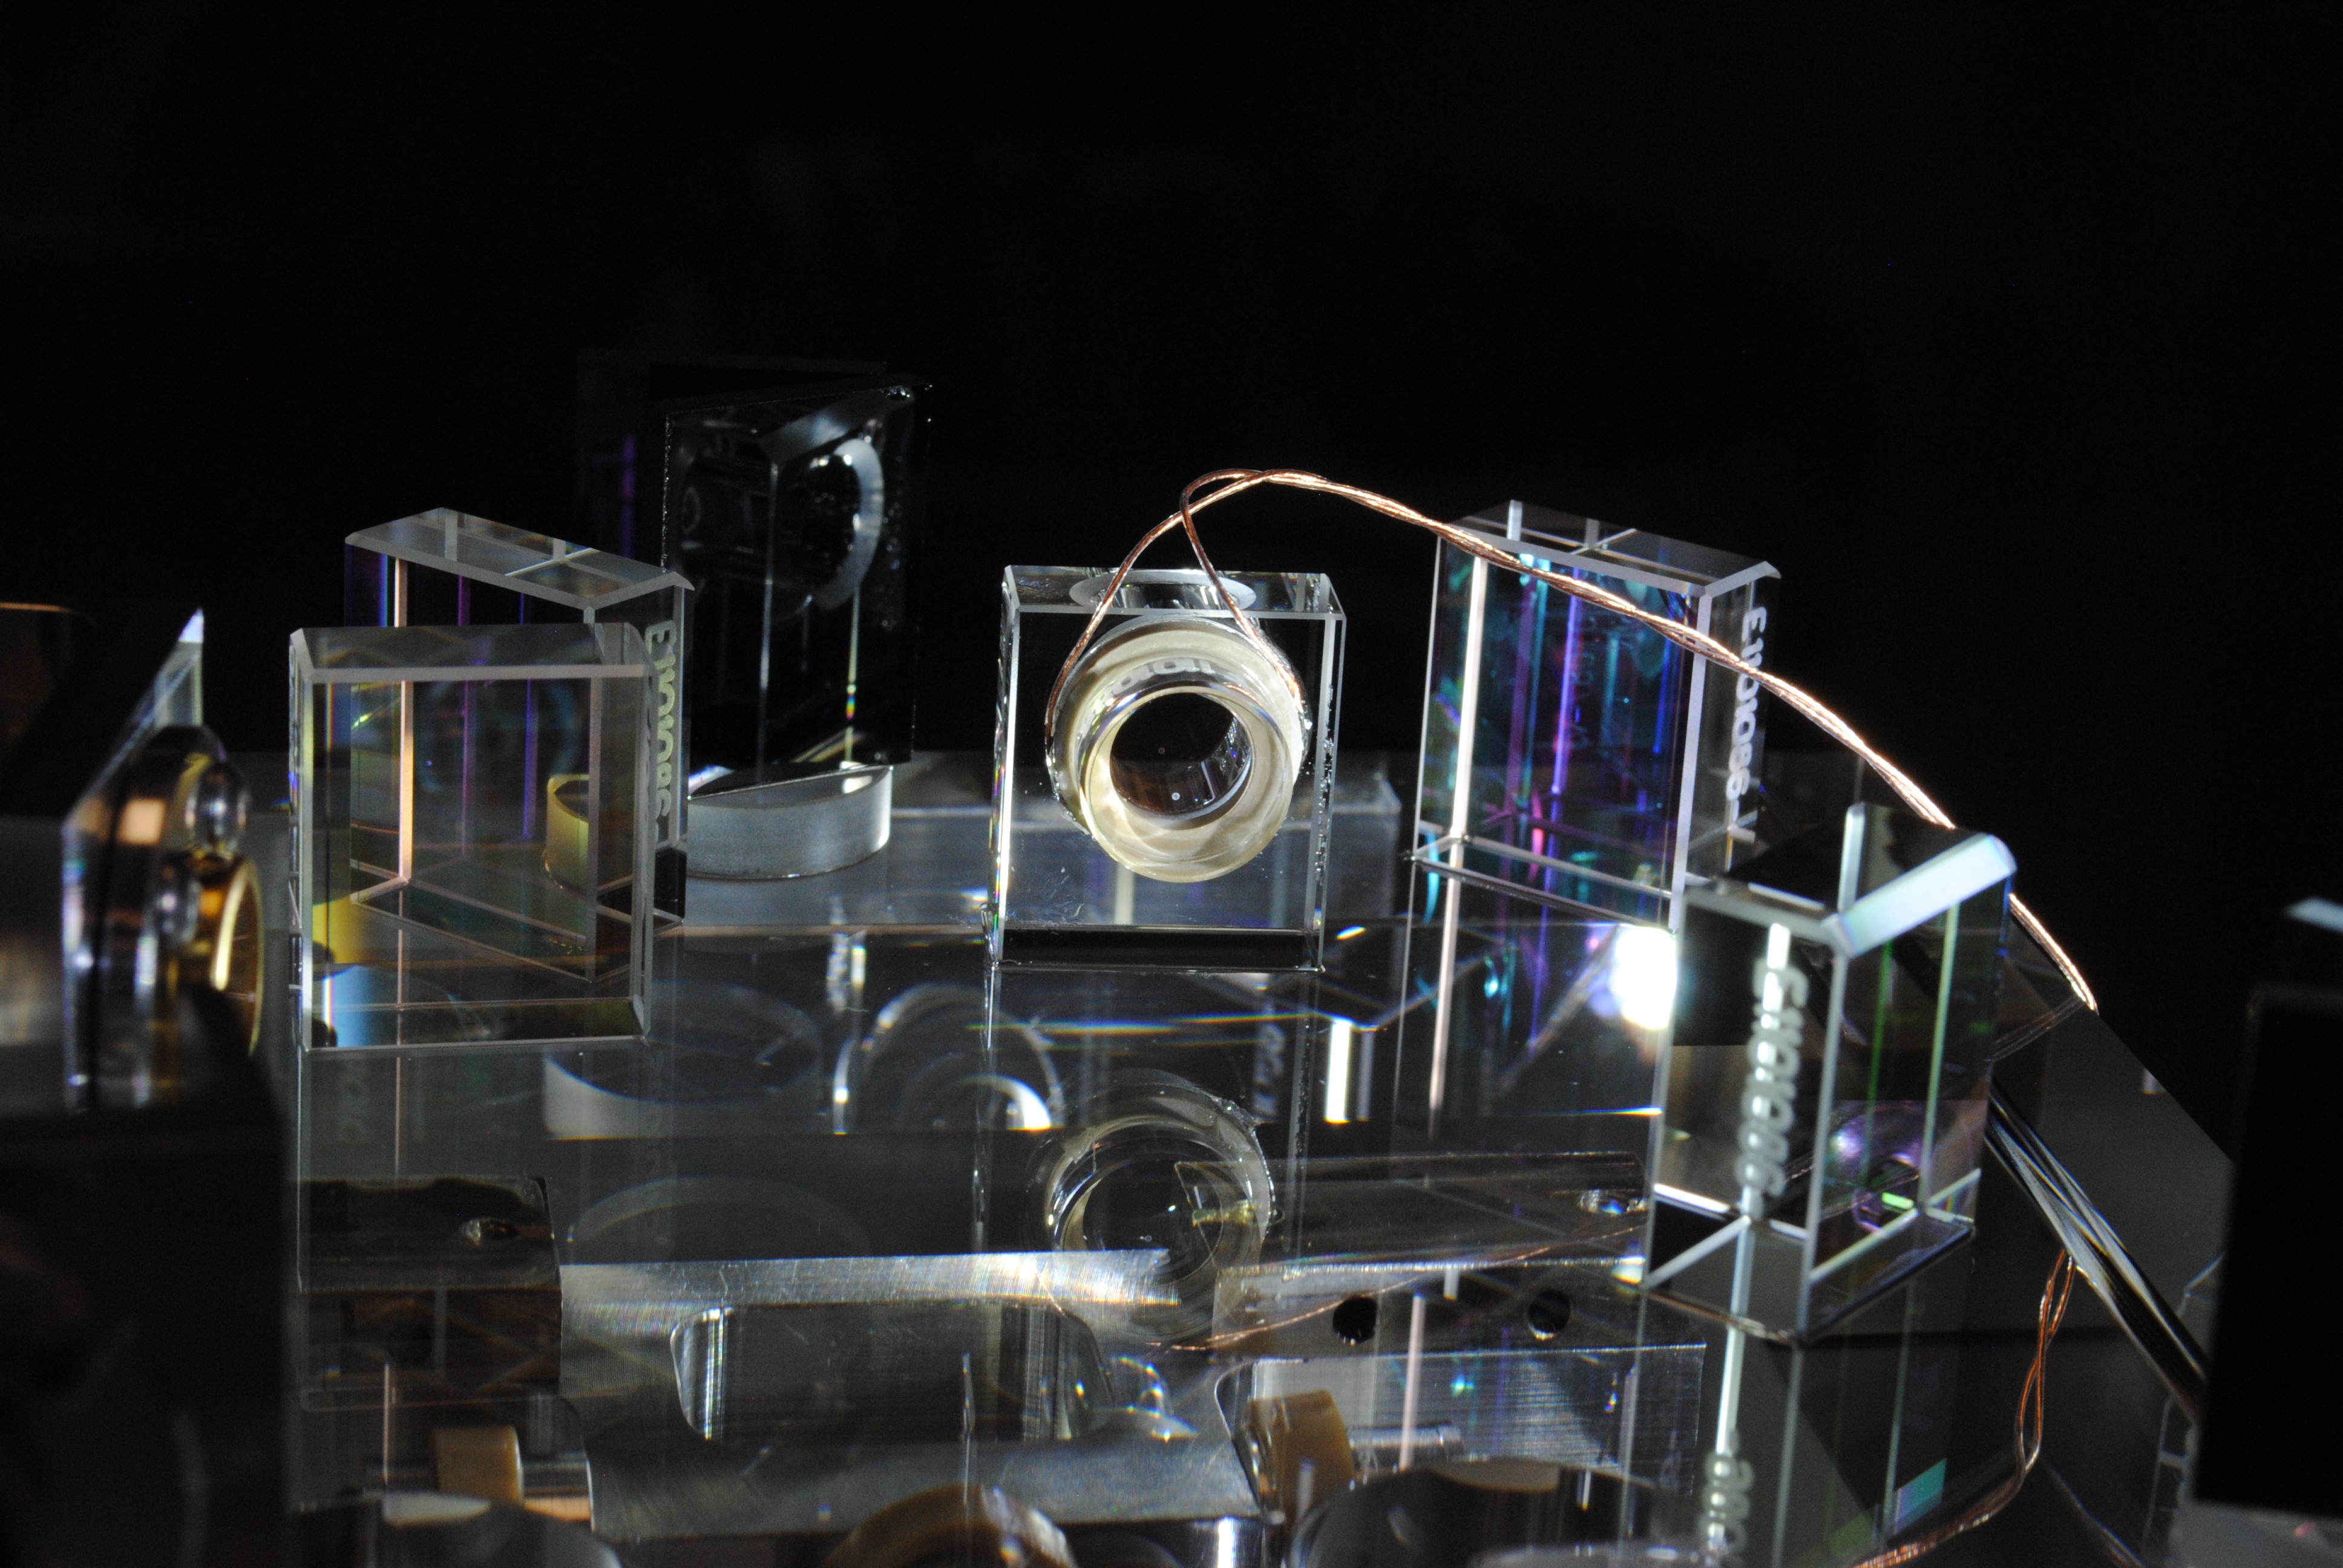
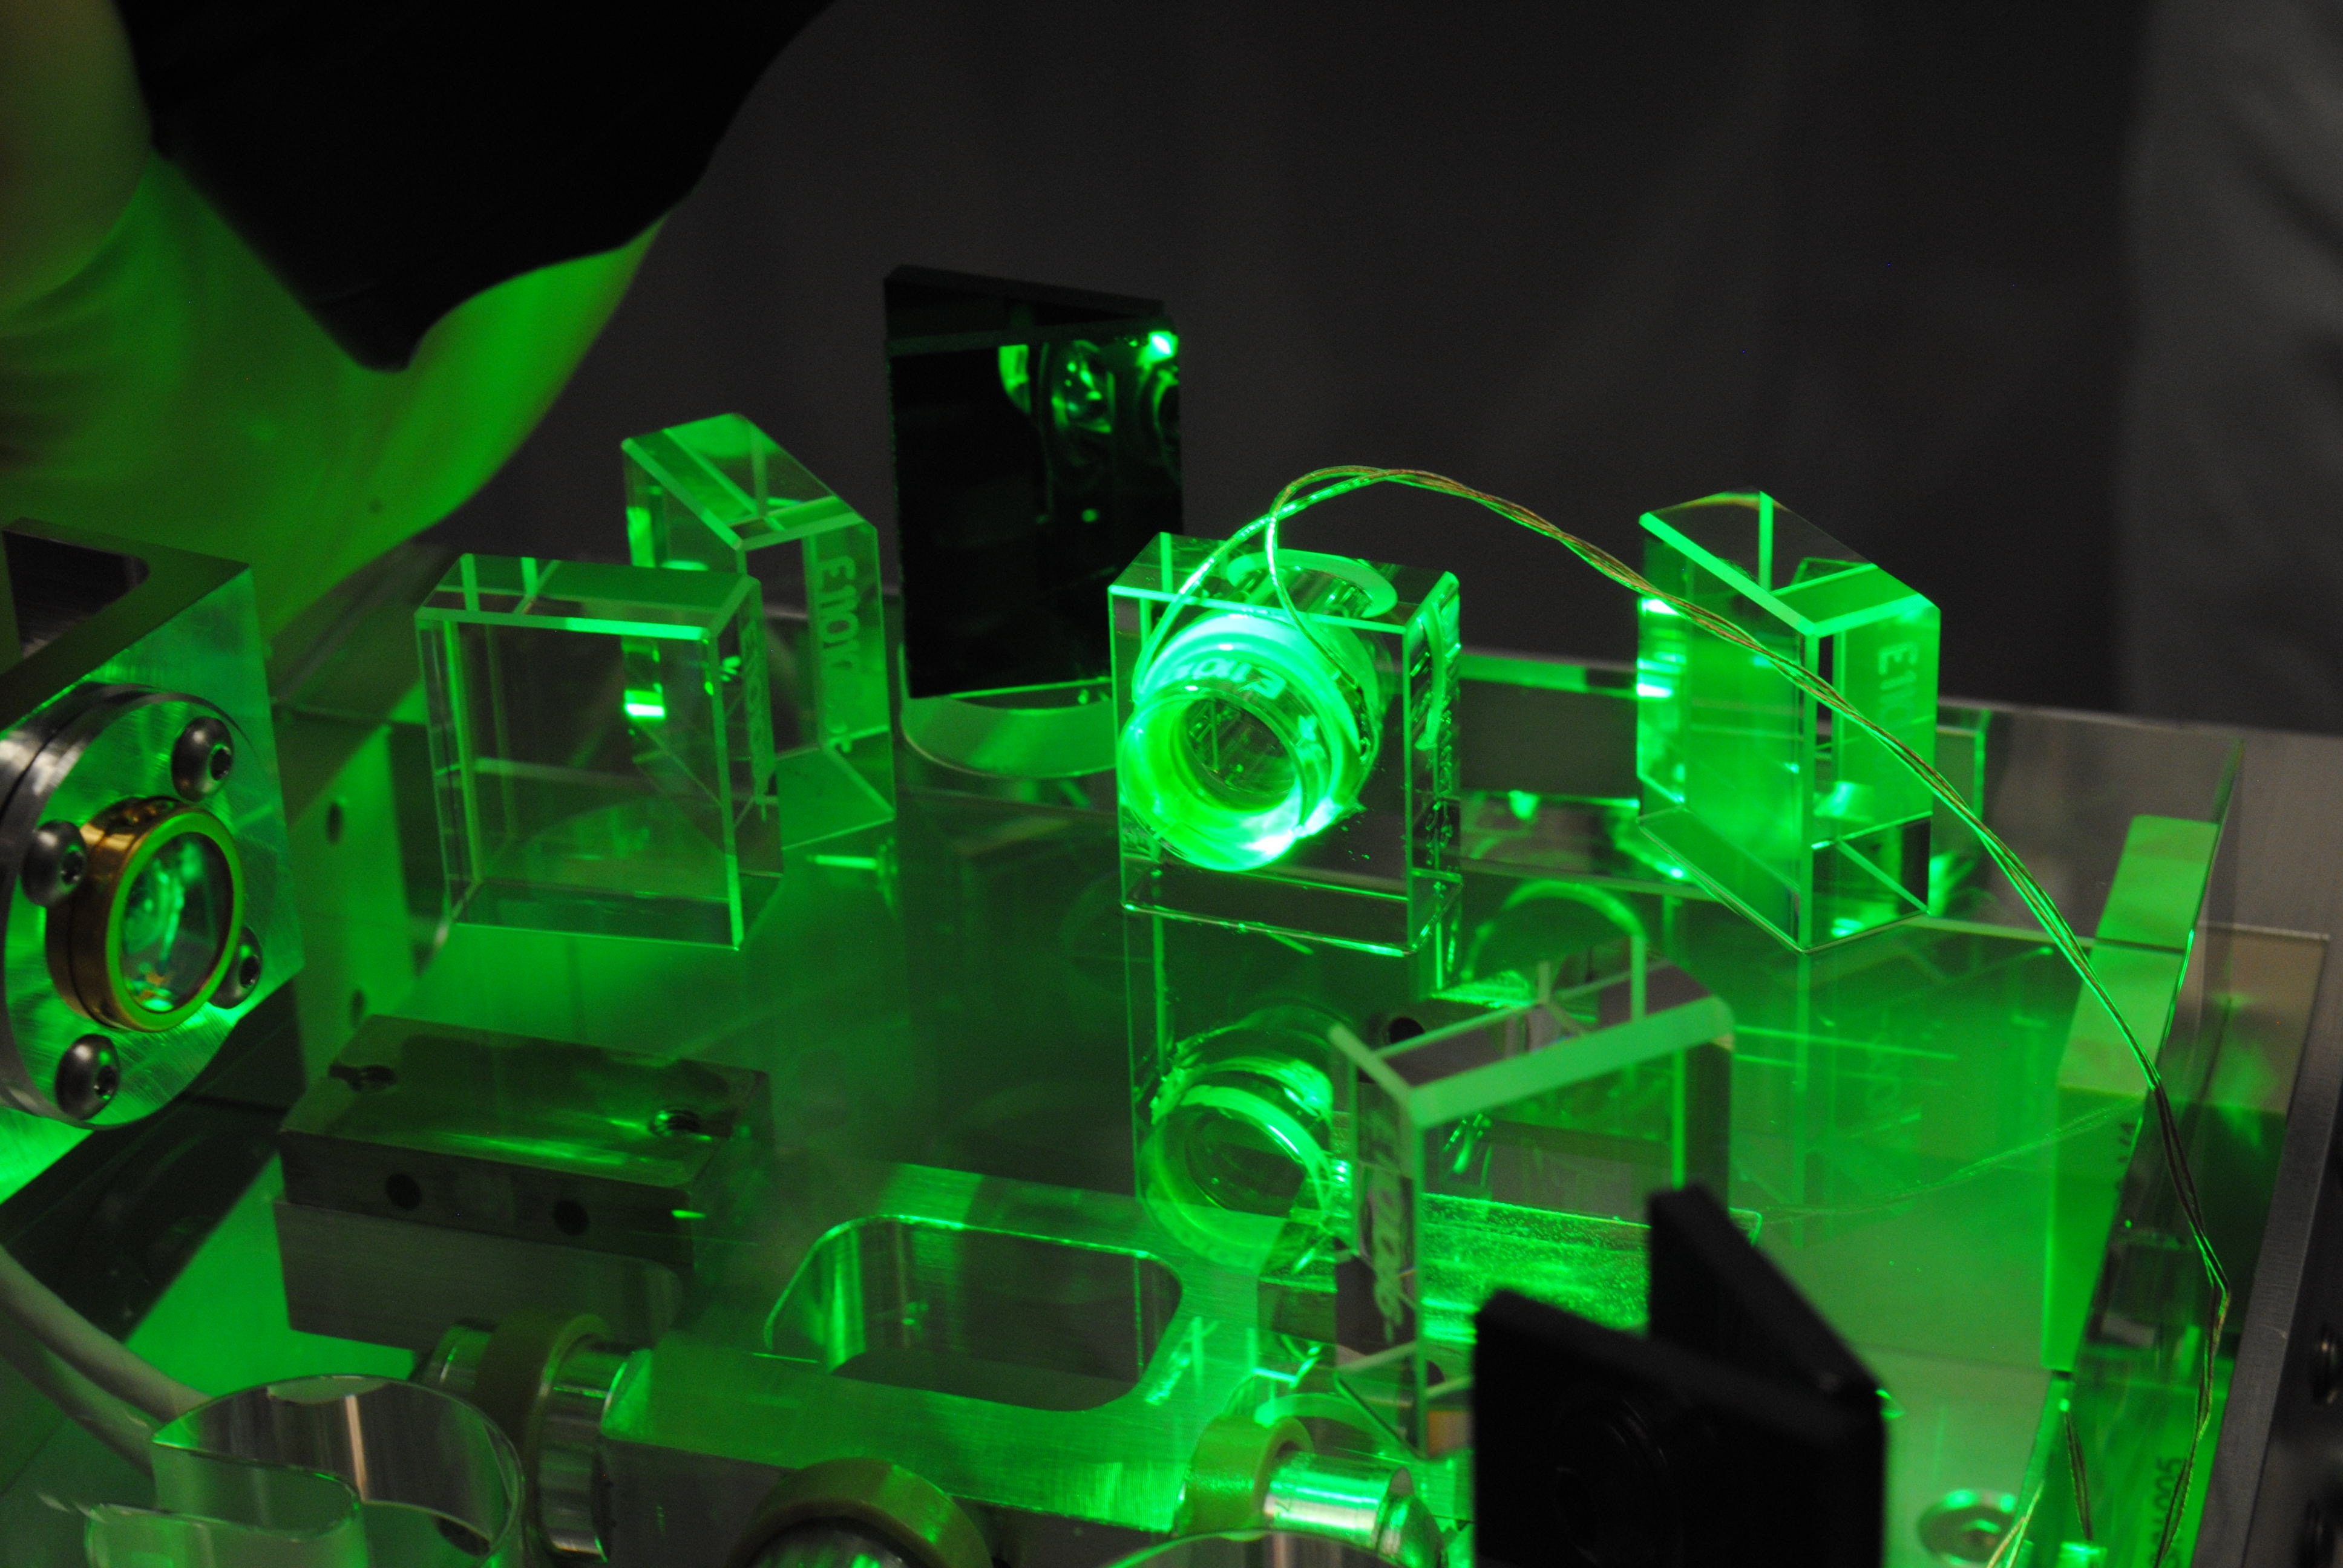
Shutter mirror inspection
The surface of the shutter mirror was checked with the green lantern. We didn't observe any sign of degradation.
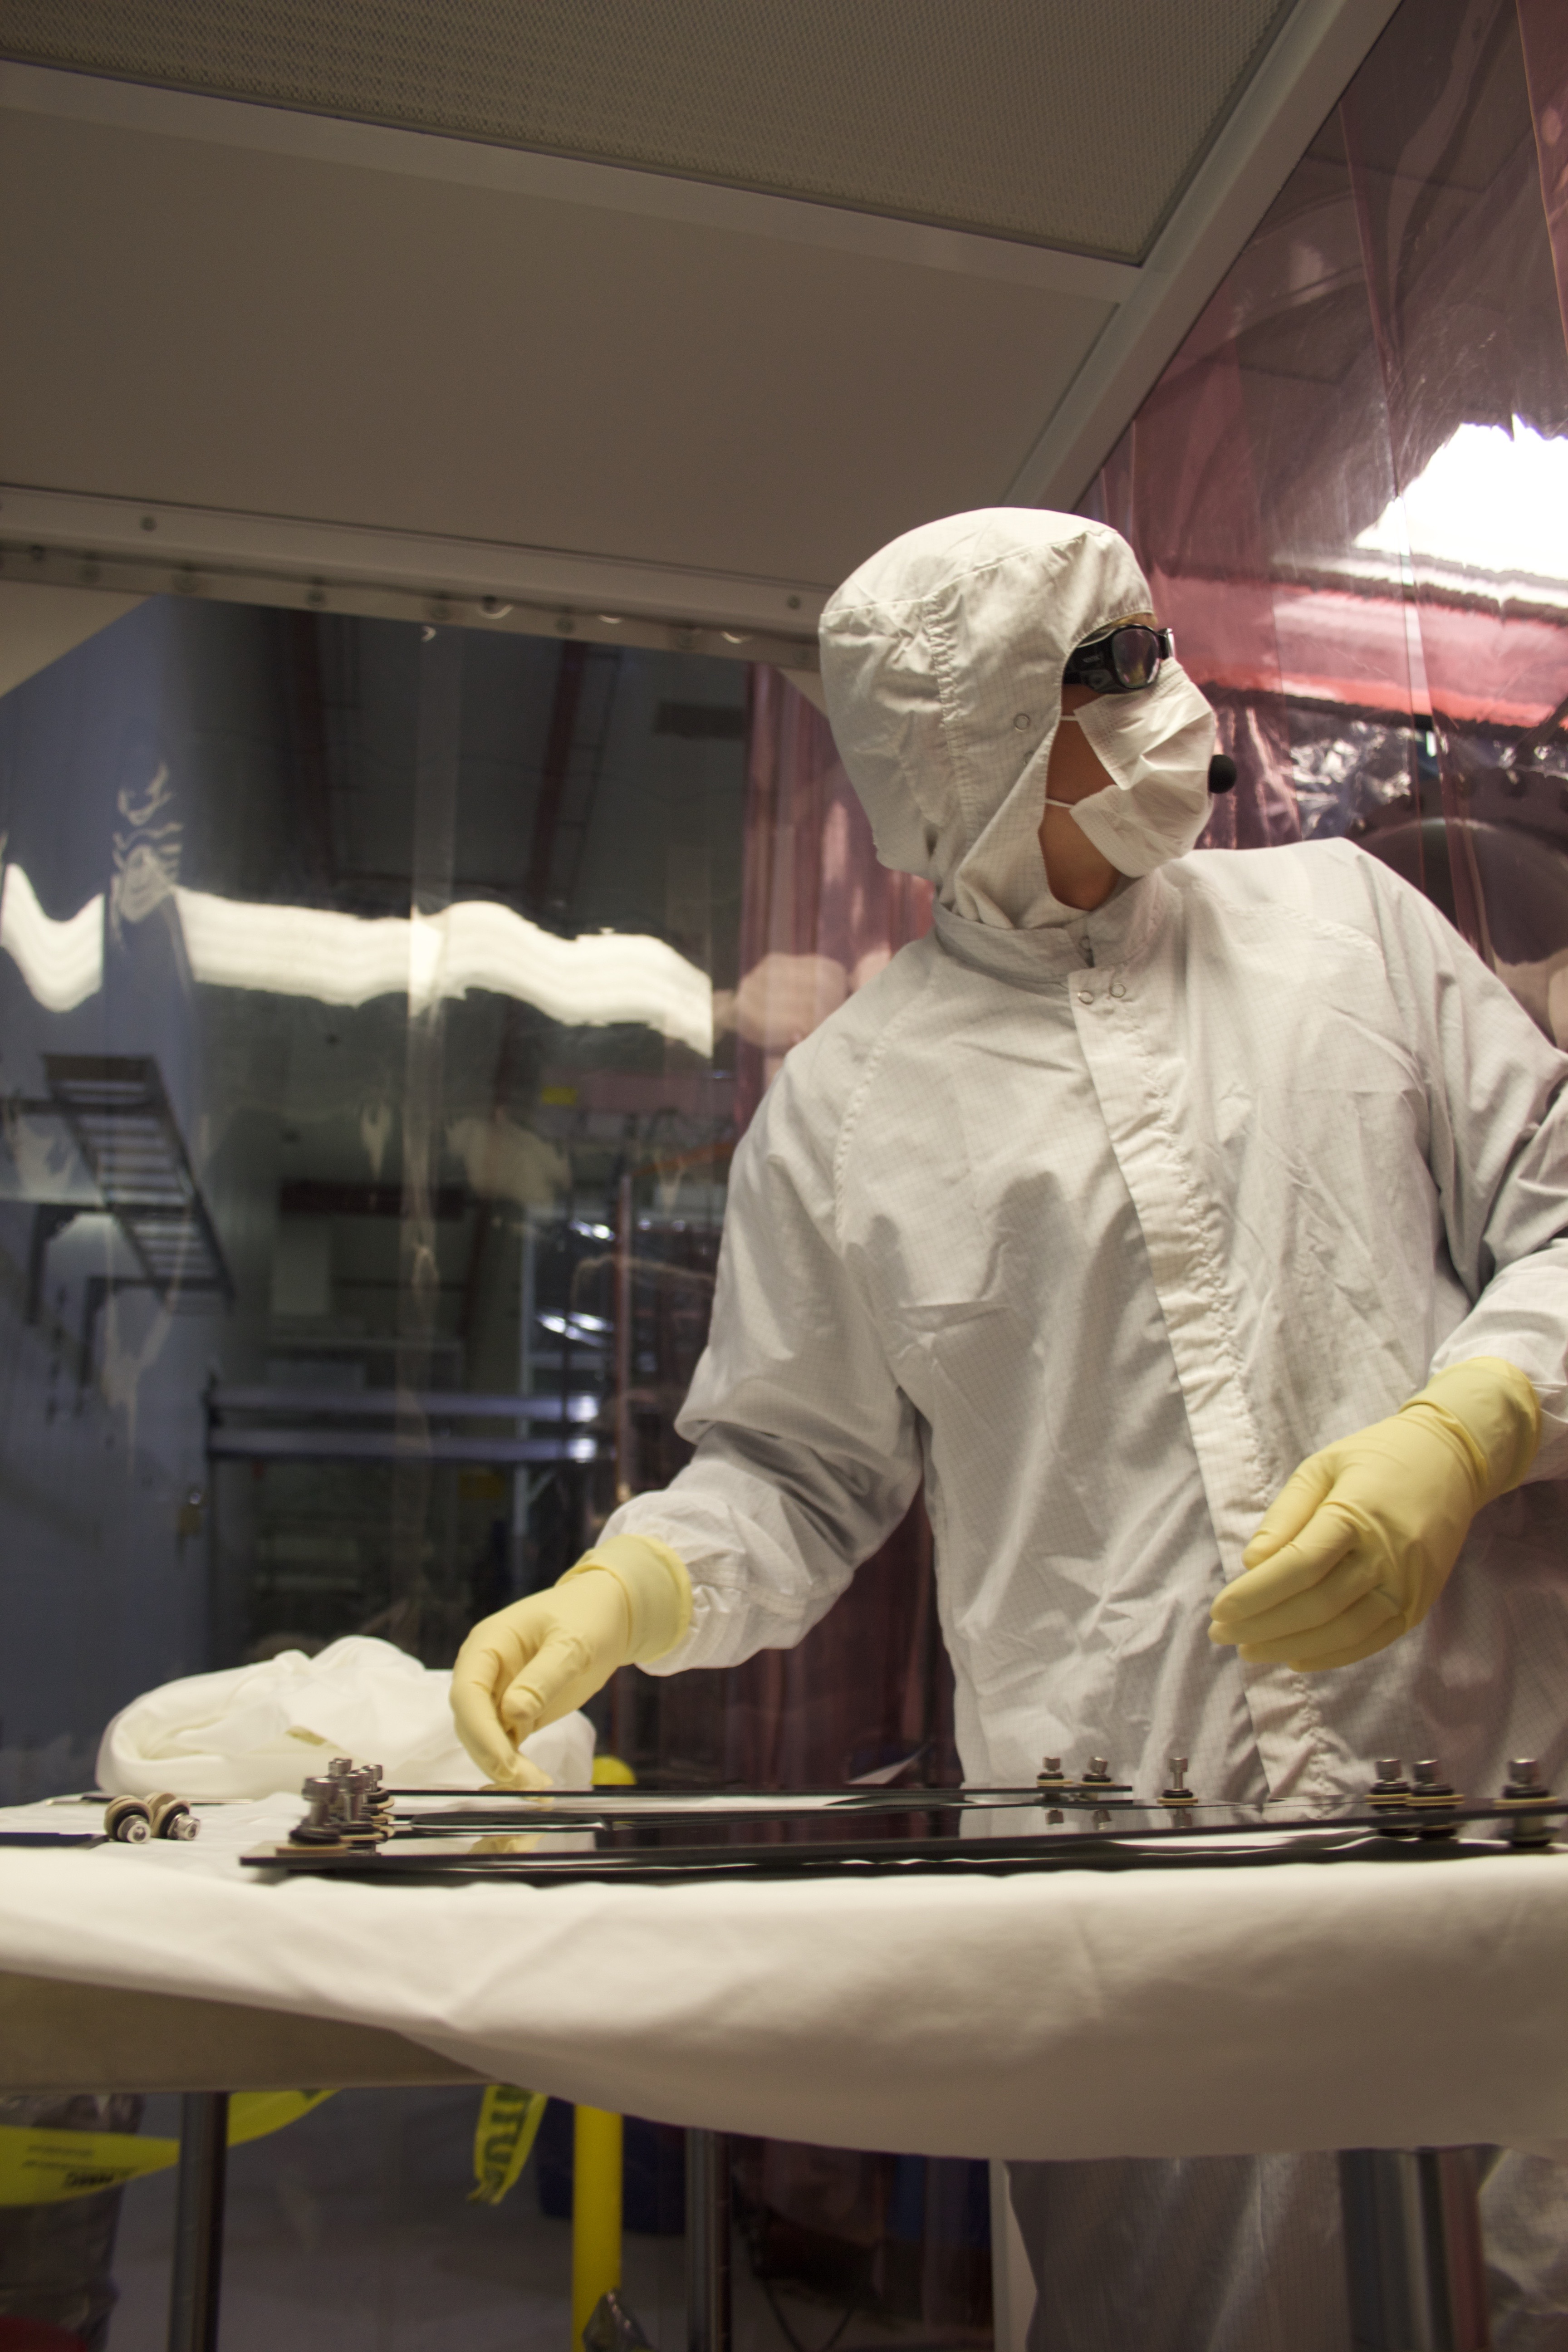
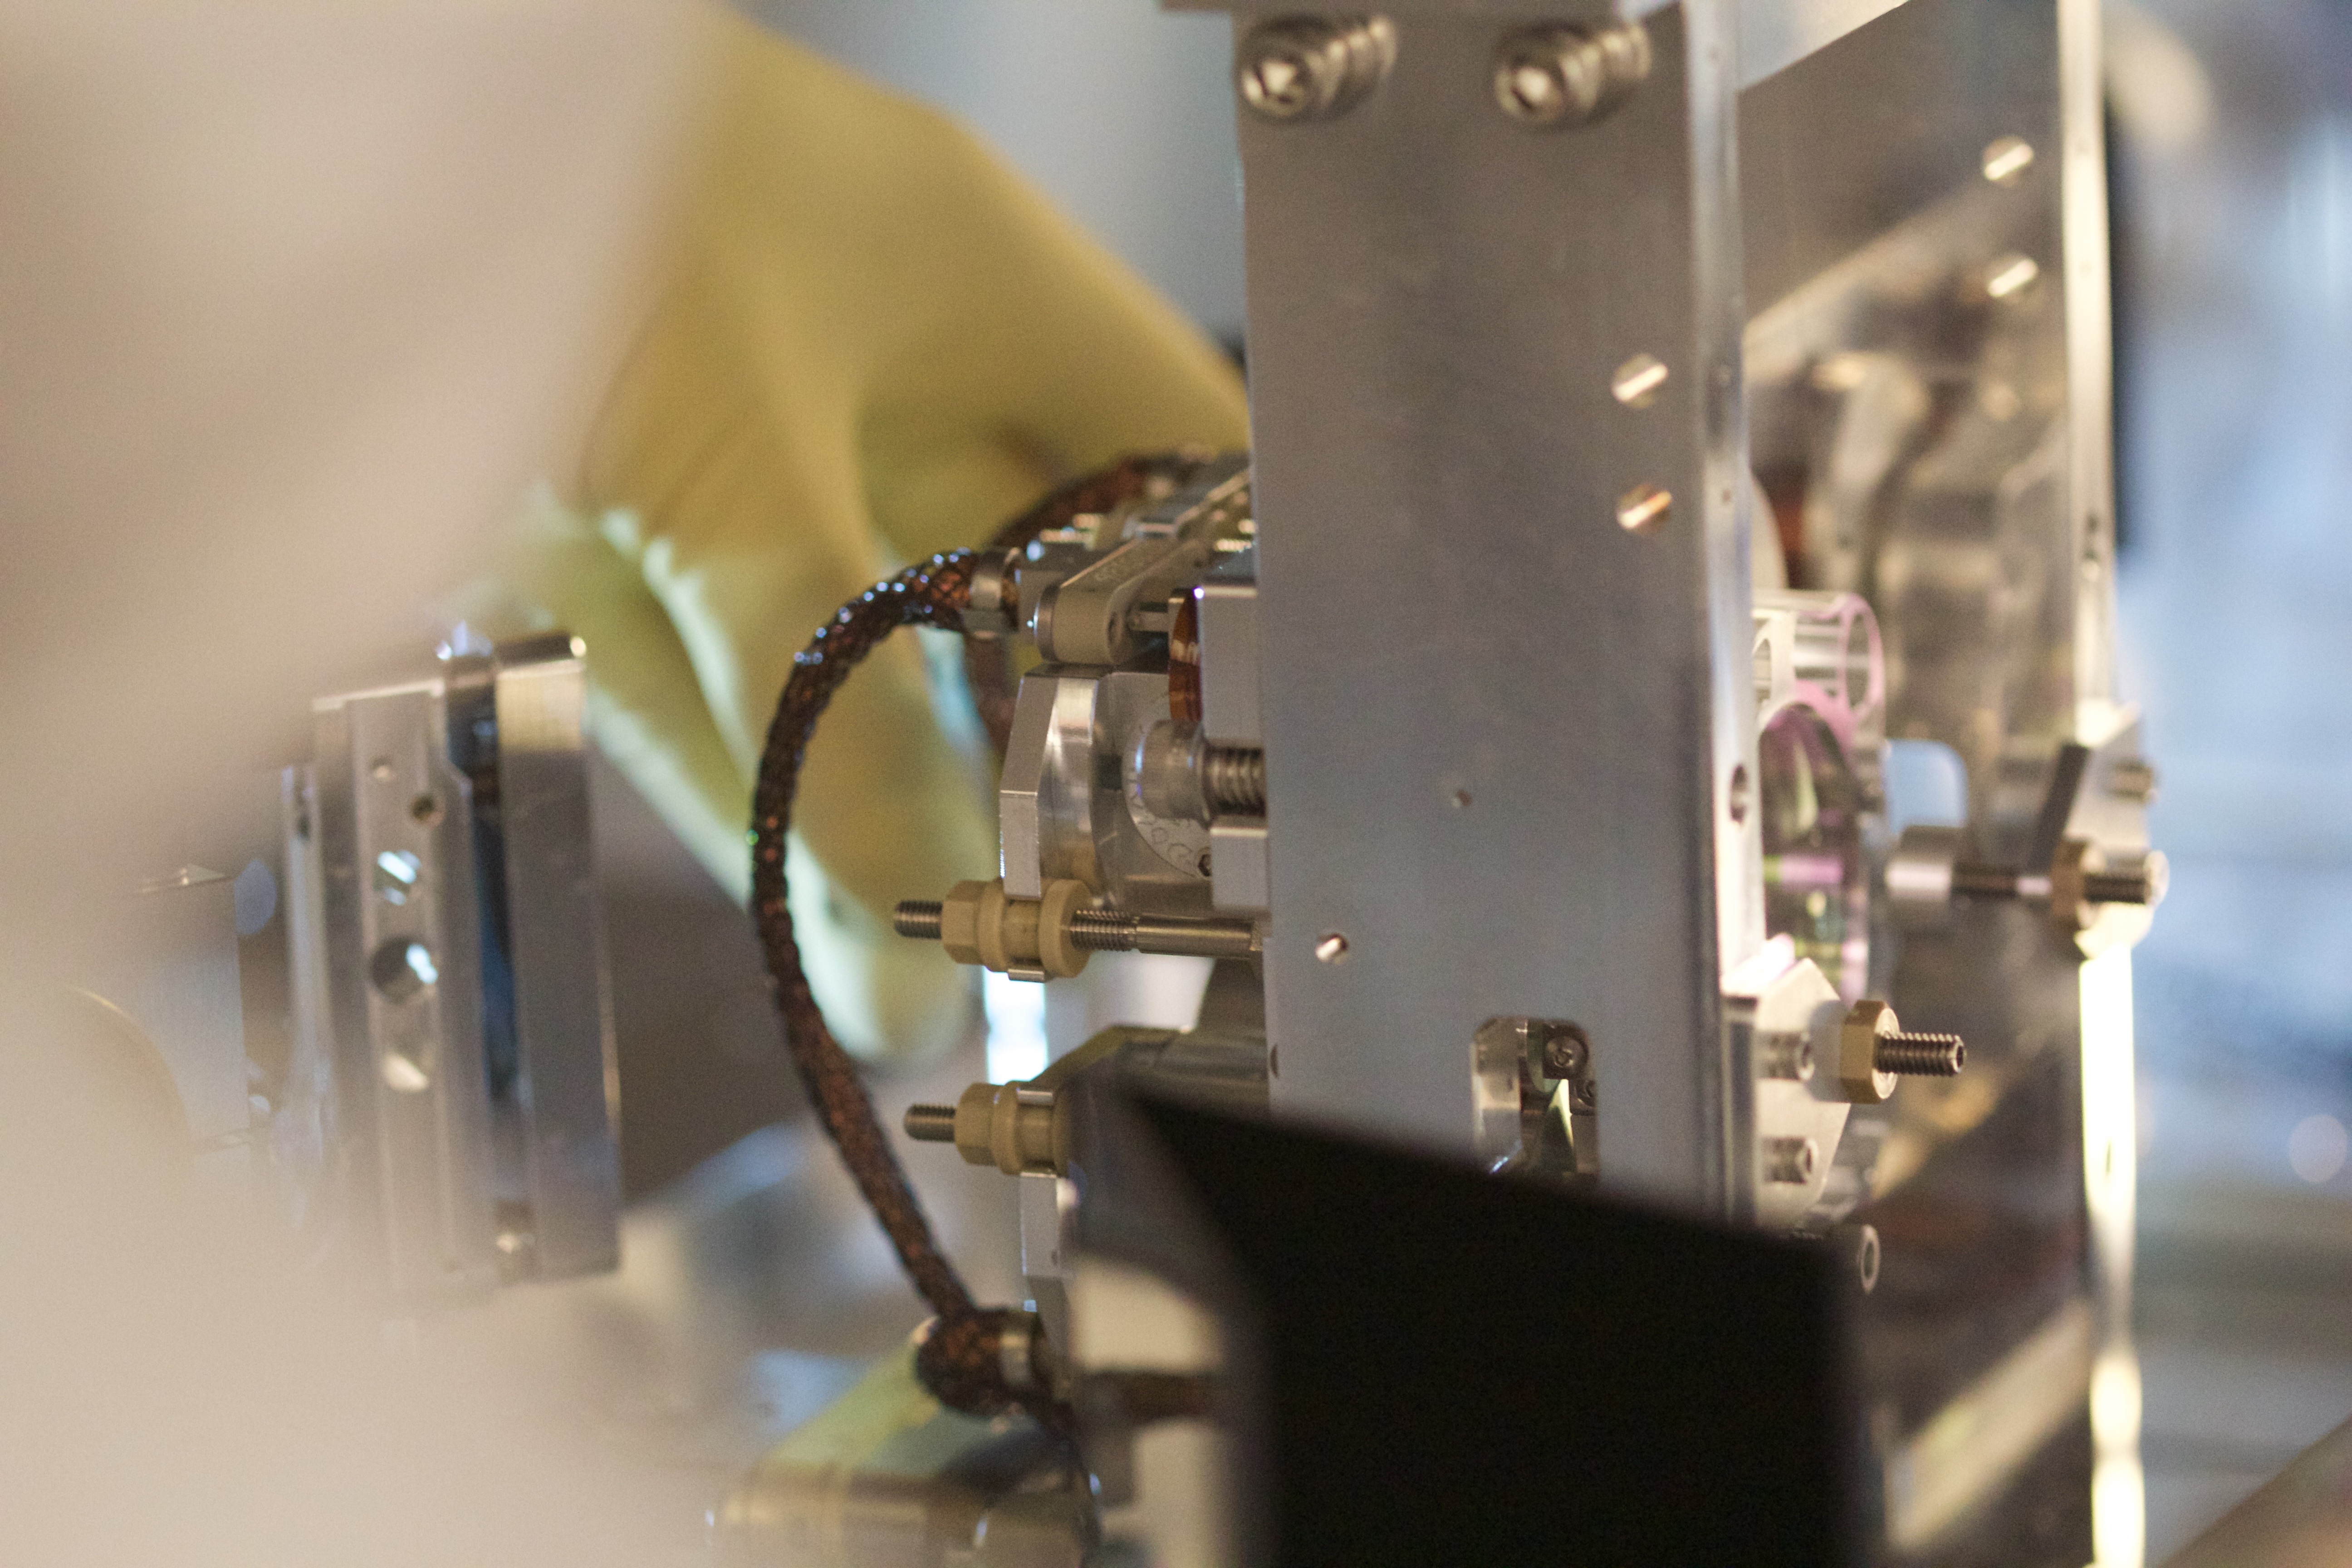
Mass balance
- We adjusted the weight of the new OMC to match with the old one as much as possible. Then the mass was moved to have reasonable flag positions in the OMC suspension.
|
OLD OMC OMC ASSY-D1201439-002
Balance mass arrangement (Topview)
[Incident Beam]
20g+20g+10g |
[DCPD R side]
10g+10g |
[Steering Mirror]
50g+10g+5g |
[DCPD T side]
50g+2g+2g+10g |
OMC (6960g) + Mass (201g) = 7161g
|
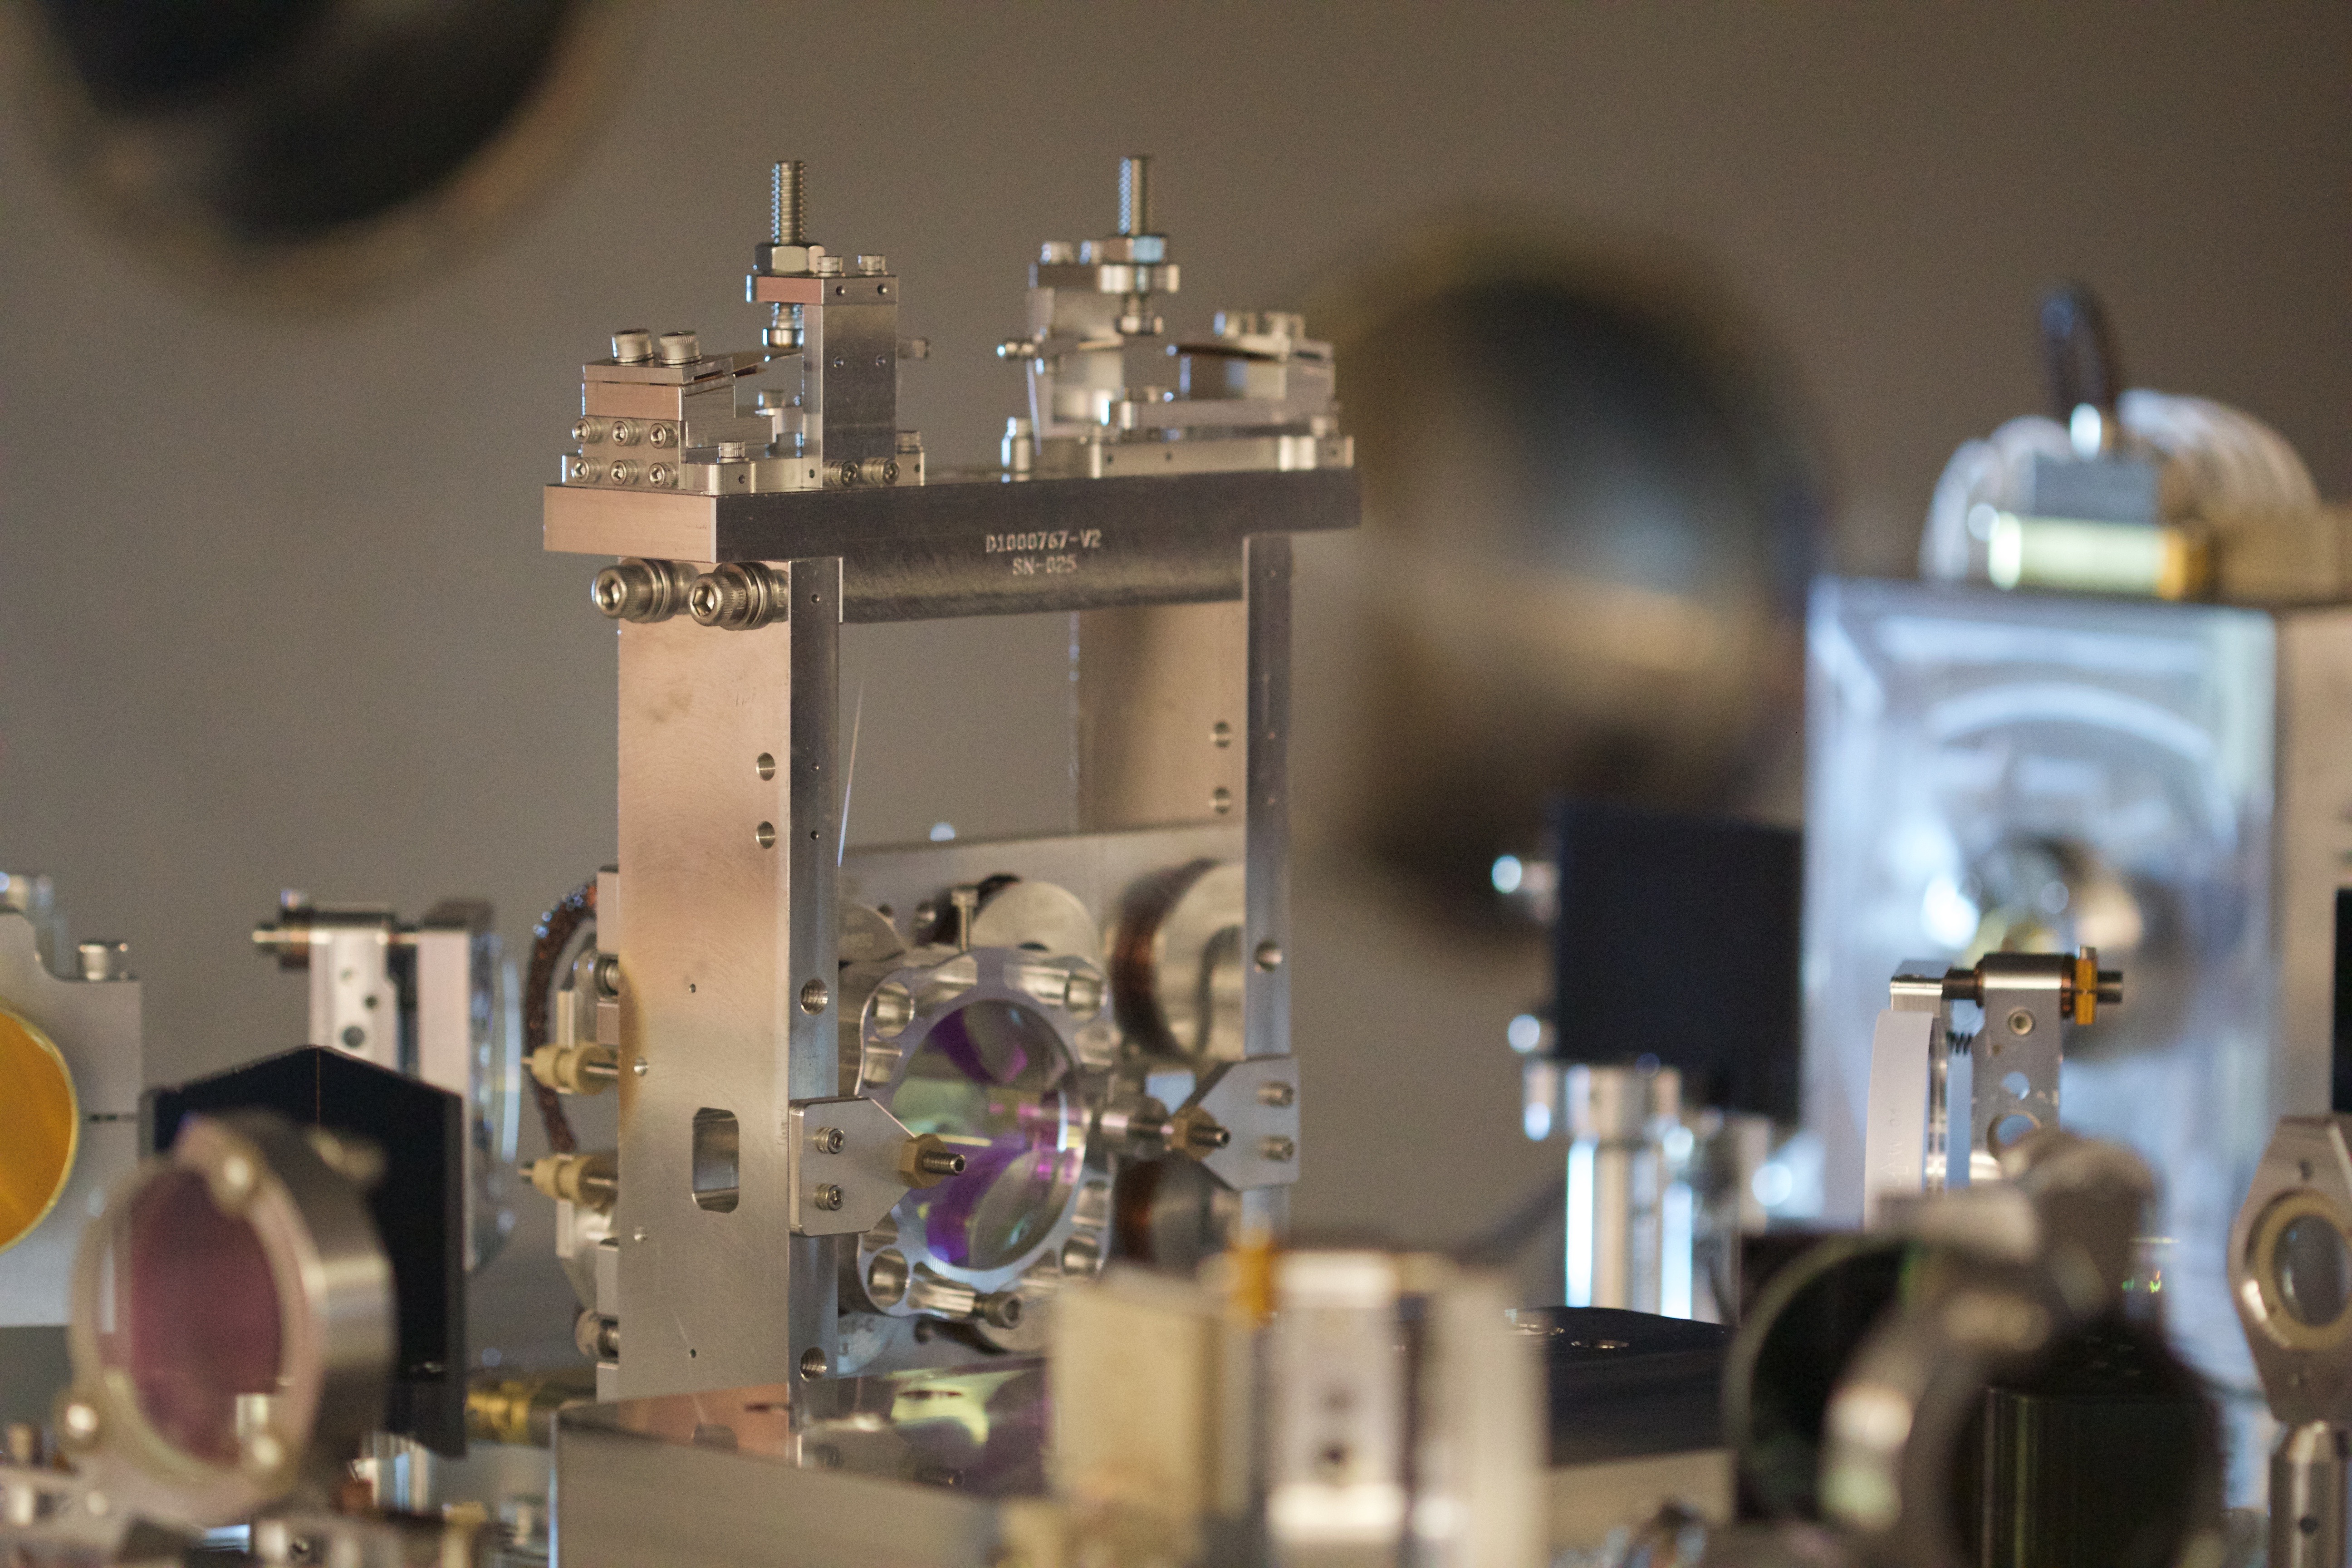
New OMC OMC ASSY-D1201439-3_2
Balance mass arrangement - final (Topview)
[Incident Beam]
20g+20g |
[DCPD R side]
10g |
[Steering Mirror]
50g+10g+10g+5g |
[DCPD T side]
50g+2g+2g+10g |
OMC (6978g) + Mass (189g) = 7167g
|
- The lateral position of OMCS RT OSEM was adjusted to have the flag at the center in the OSEM.
- The centering of the OMCS OSEMs were checked to be within the tolerance range.
- Along with the mass balancing, the positions of the EQ stops for the OMC breadboard were checked. We found several EQ stops were too close or too far. The EQ stop holders were adjusted to have them reasonable gaps to the glass breadboard.
Electrical functionality check
- The DCPDs were illuminated by a white flash light to check which DCPD responds to which channel. DCPDA and DCPDB are related to the DCPD on the transmission anfd reflection sides of the BS prism, respectively. (DCPD(T) = DCPDA, DCPD(R) = DCPDB). This seemed opposite to the case with the previous OMC. It was found that the difference in the internal cabling on the OMC caused this difference. This will be noted in the OMC testing procedure document (T1500060) athough this does not affect the calibration.
- The OMC QPDs were illuminated by the flash light. QPD1 (short arm) and QPD2 (long arm) correspond to QPDA and QPDB, as nominal.
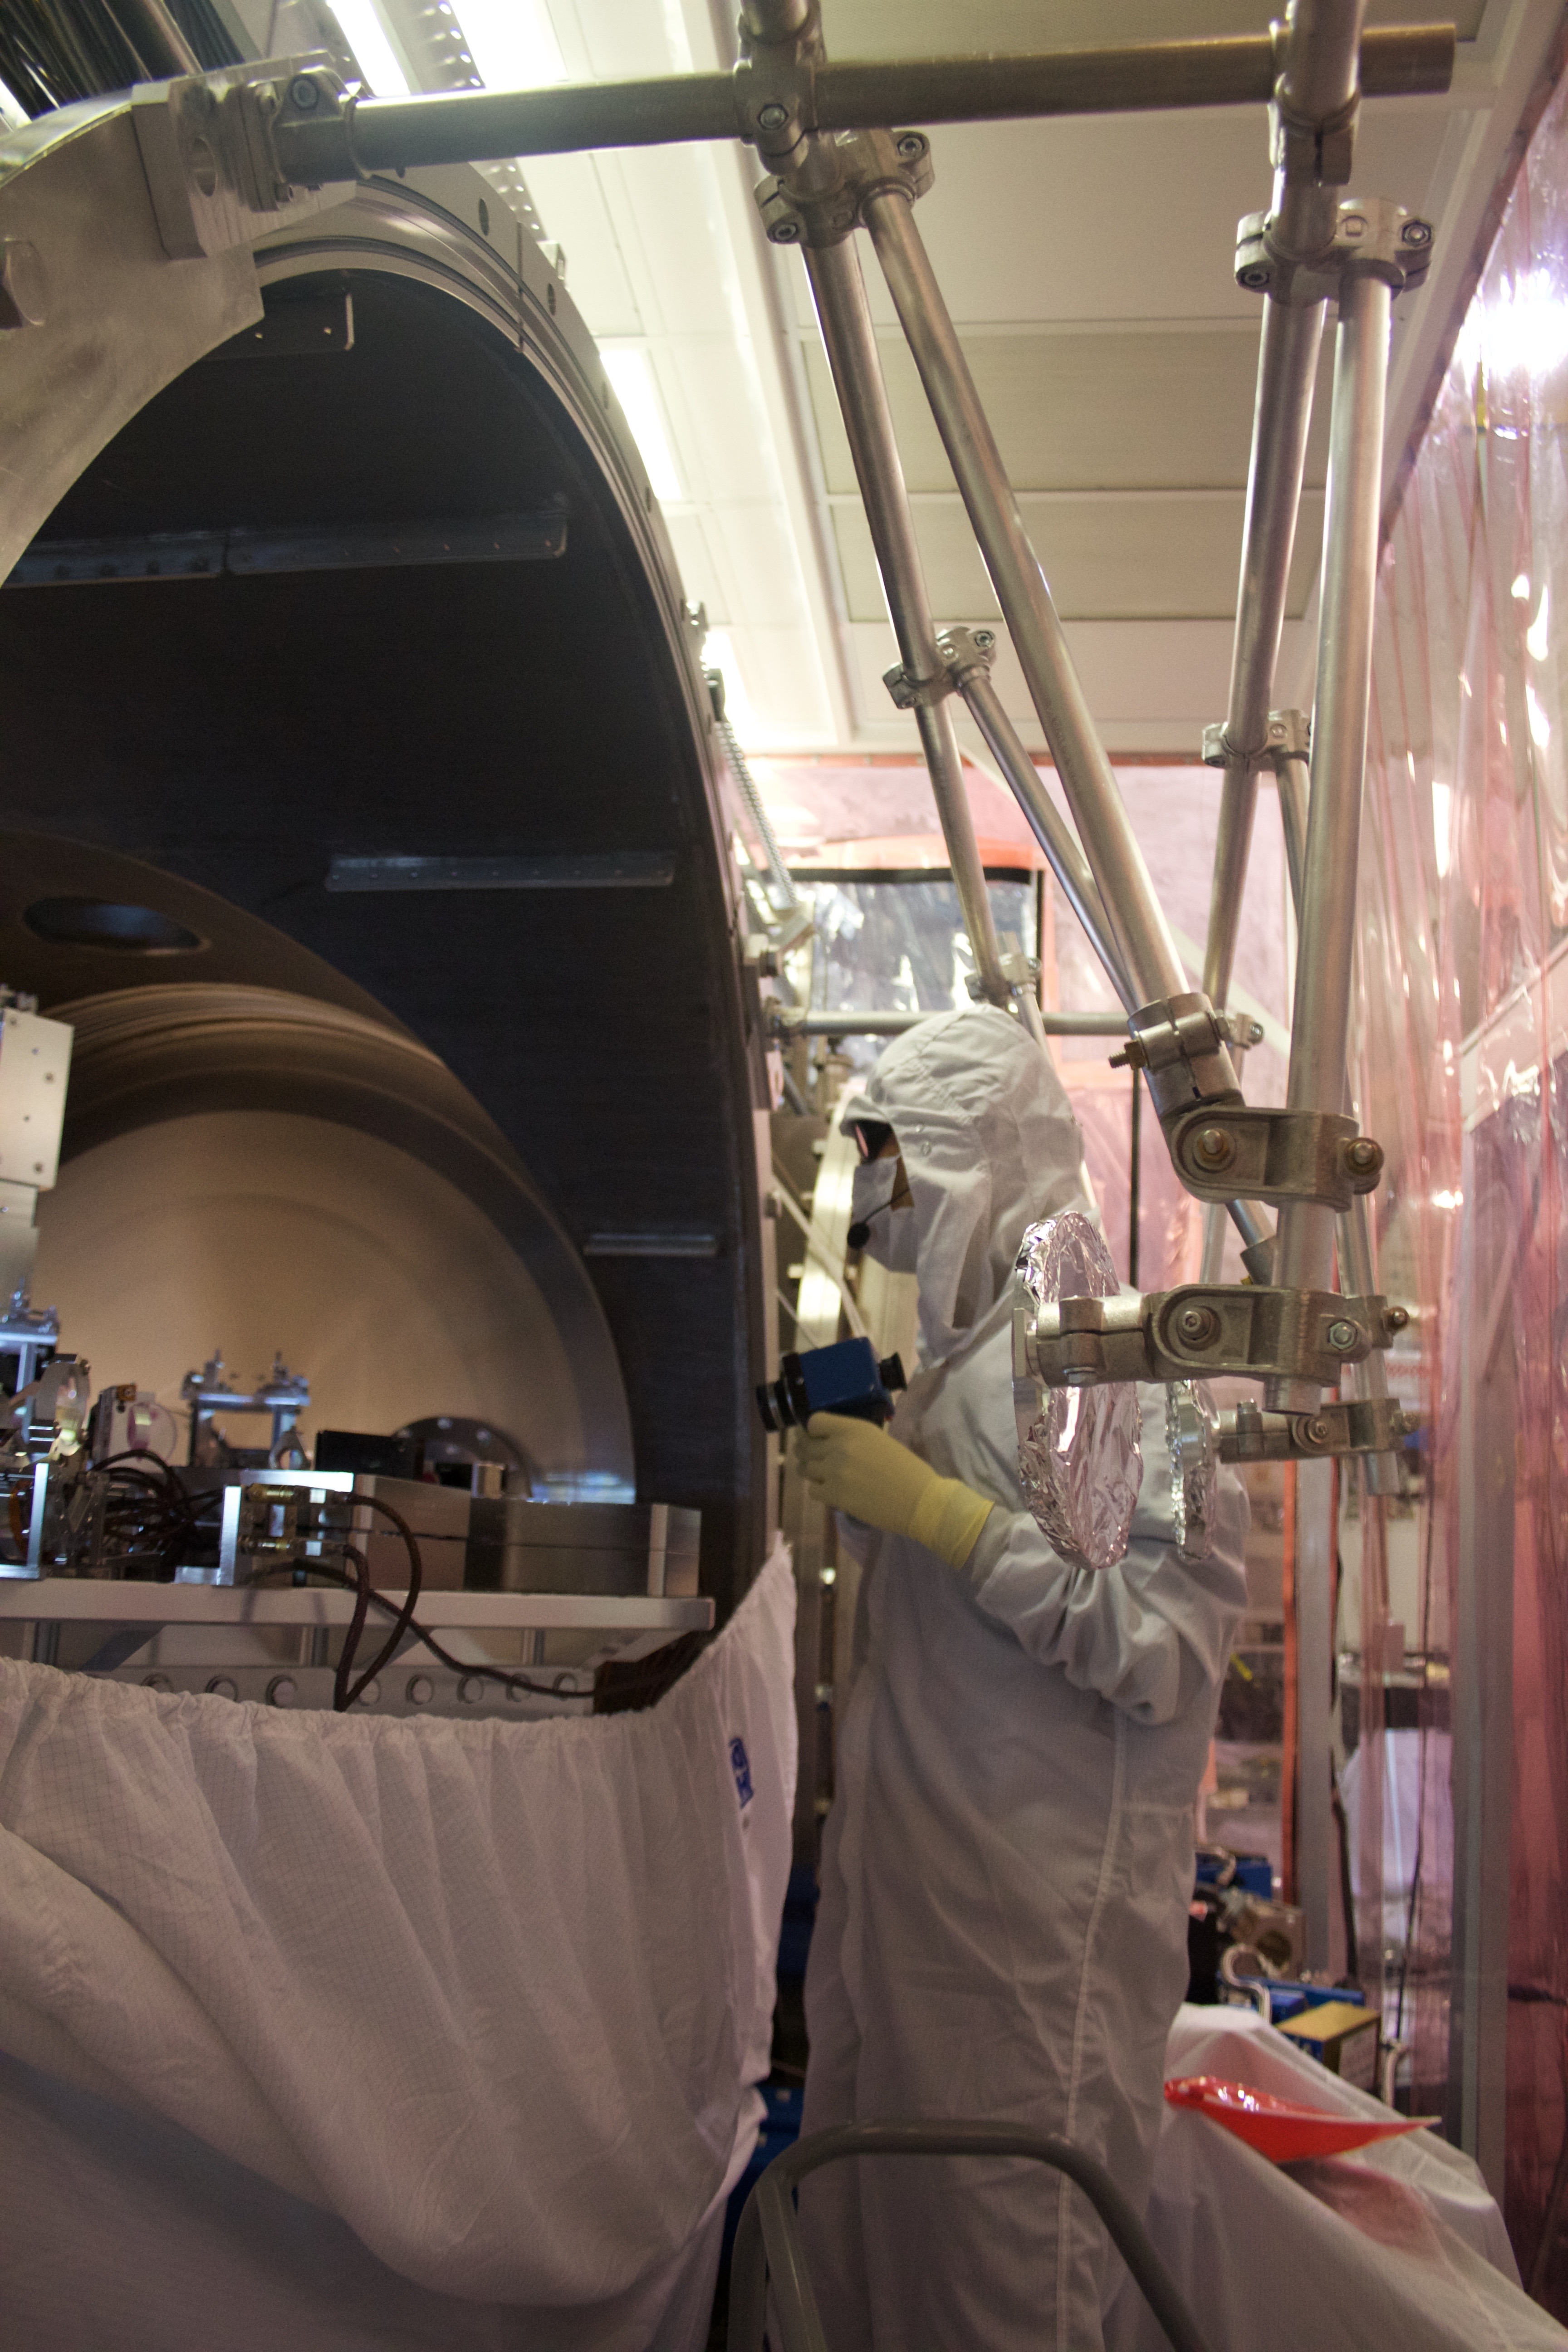
Incident beam alignment & suspension debiasing
- Prep: IMC was locked at 2W. The beam was aligned on to the center of AS_C QPD.
- At this point, we already could observe the beams were on the OMC QPDs. Very good reproducibility.
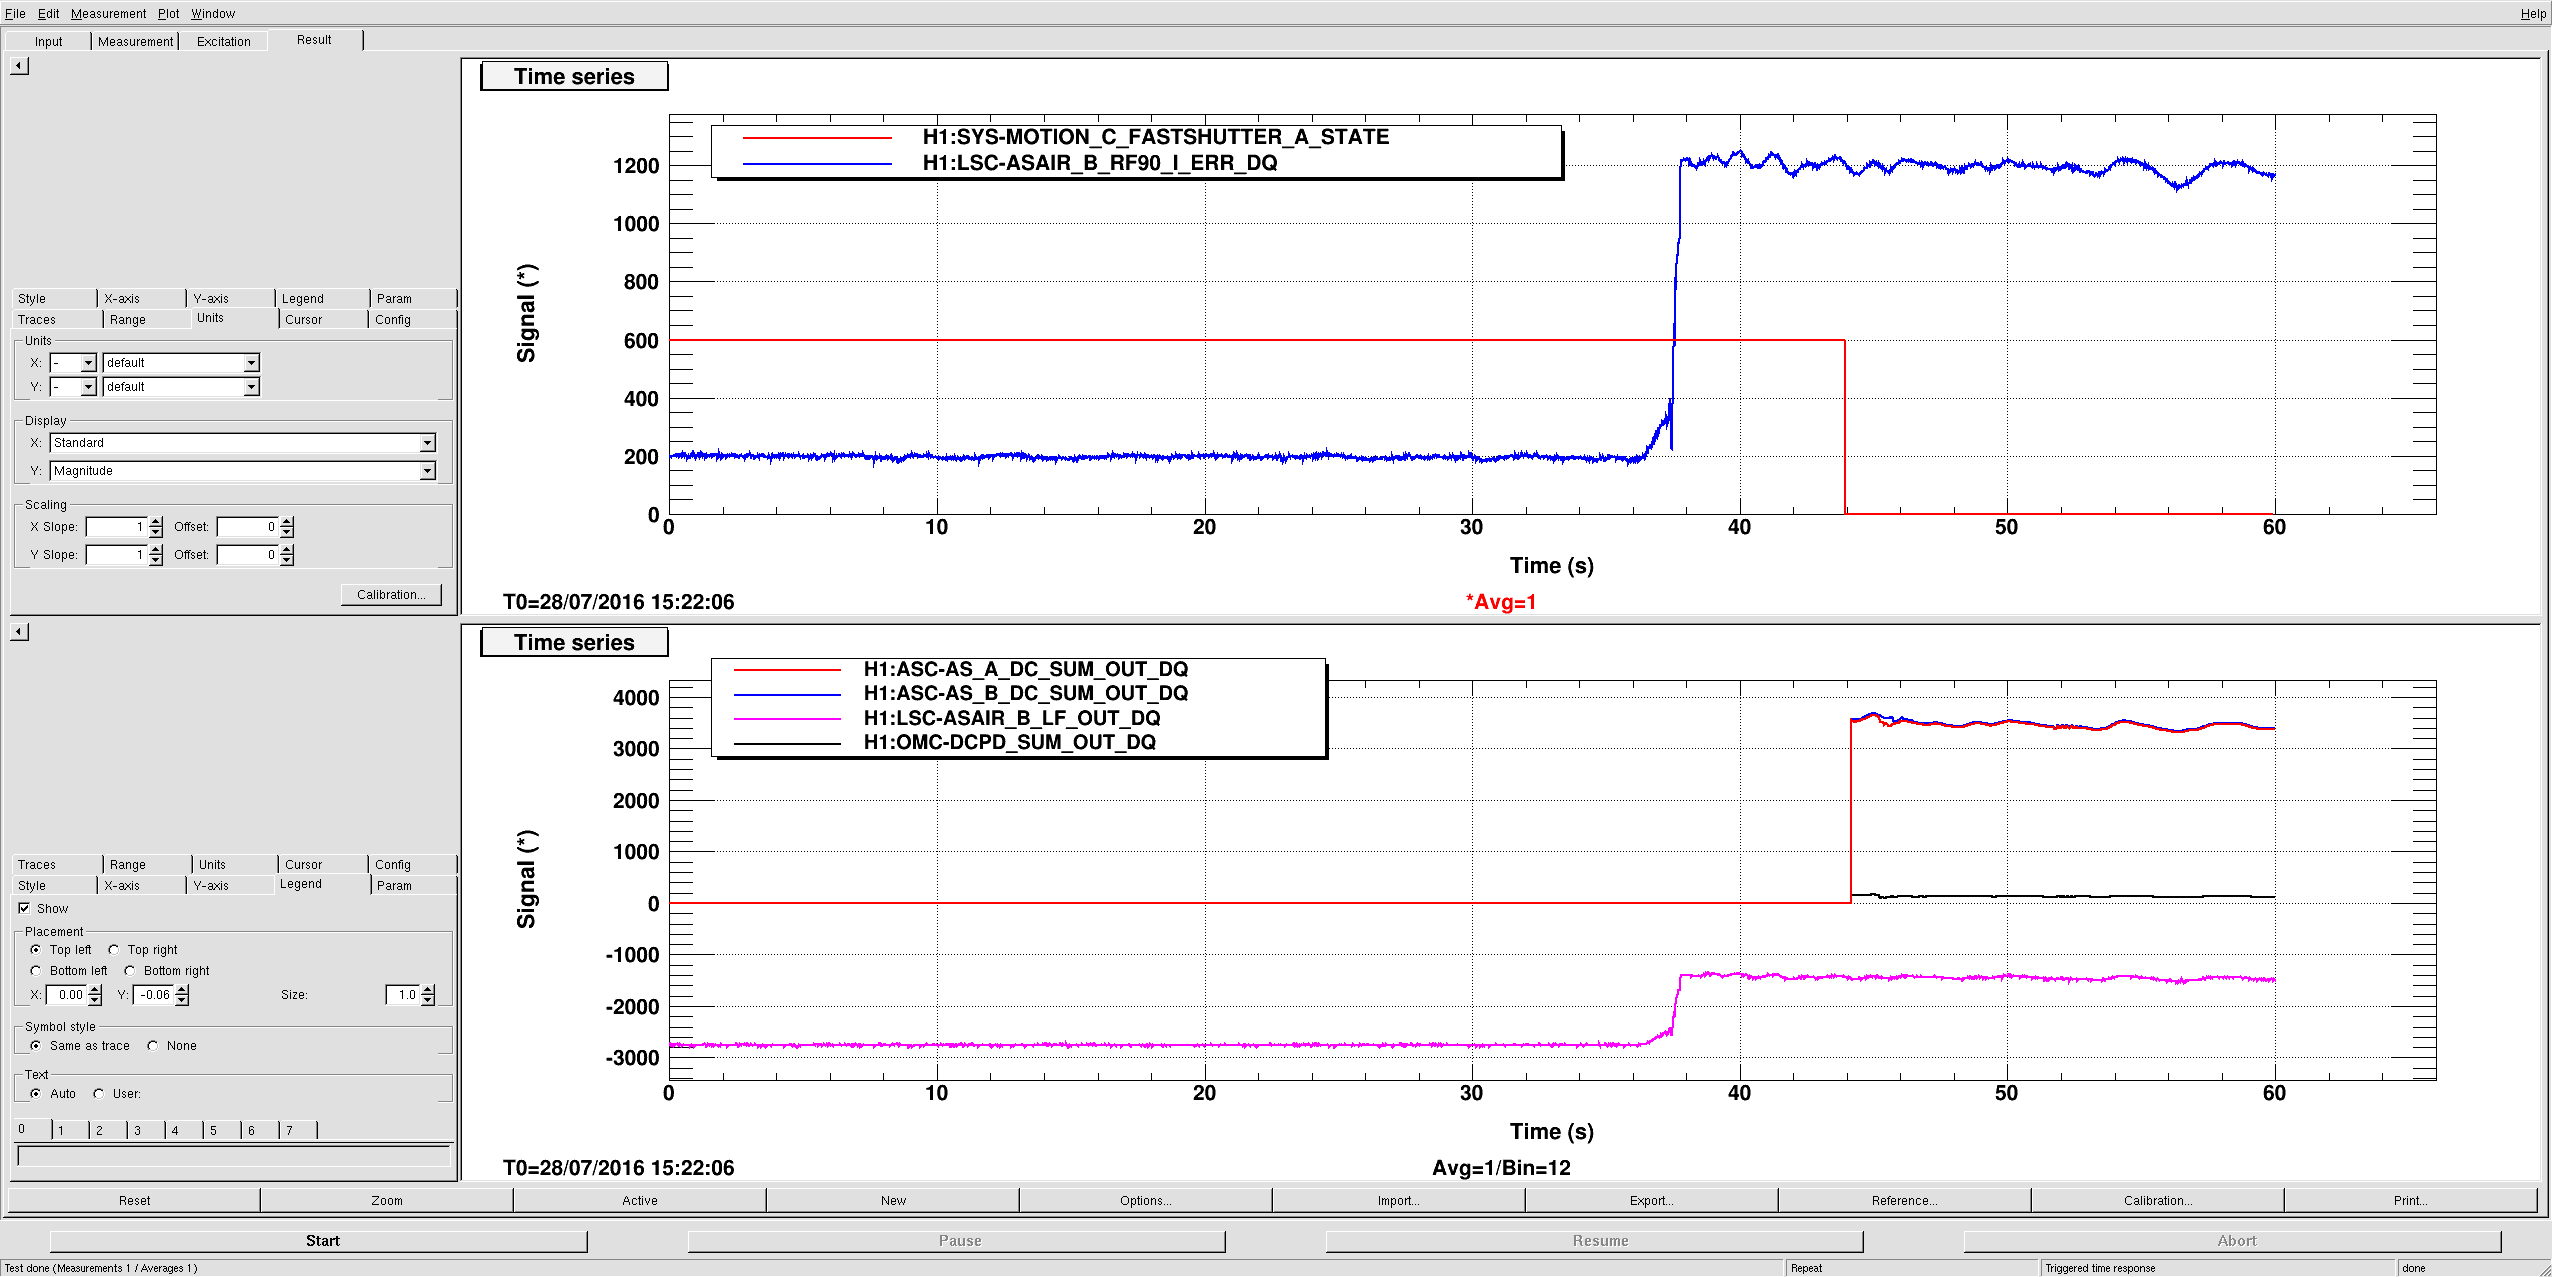
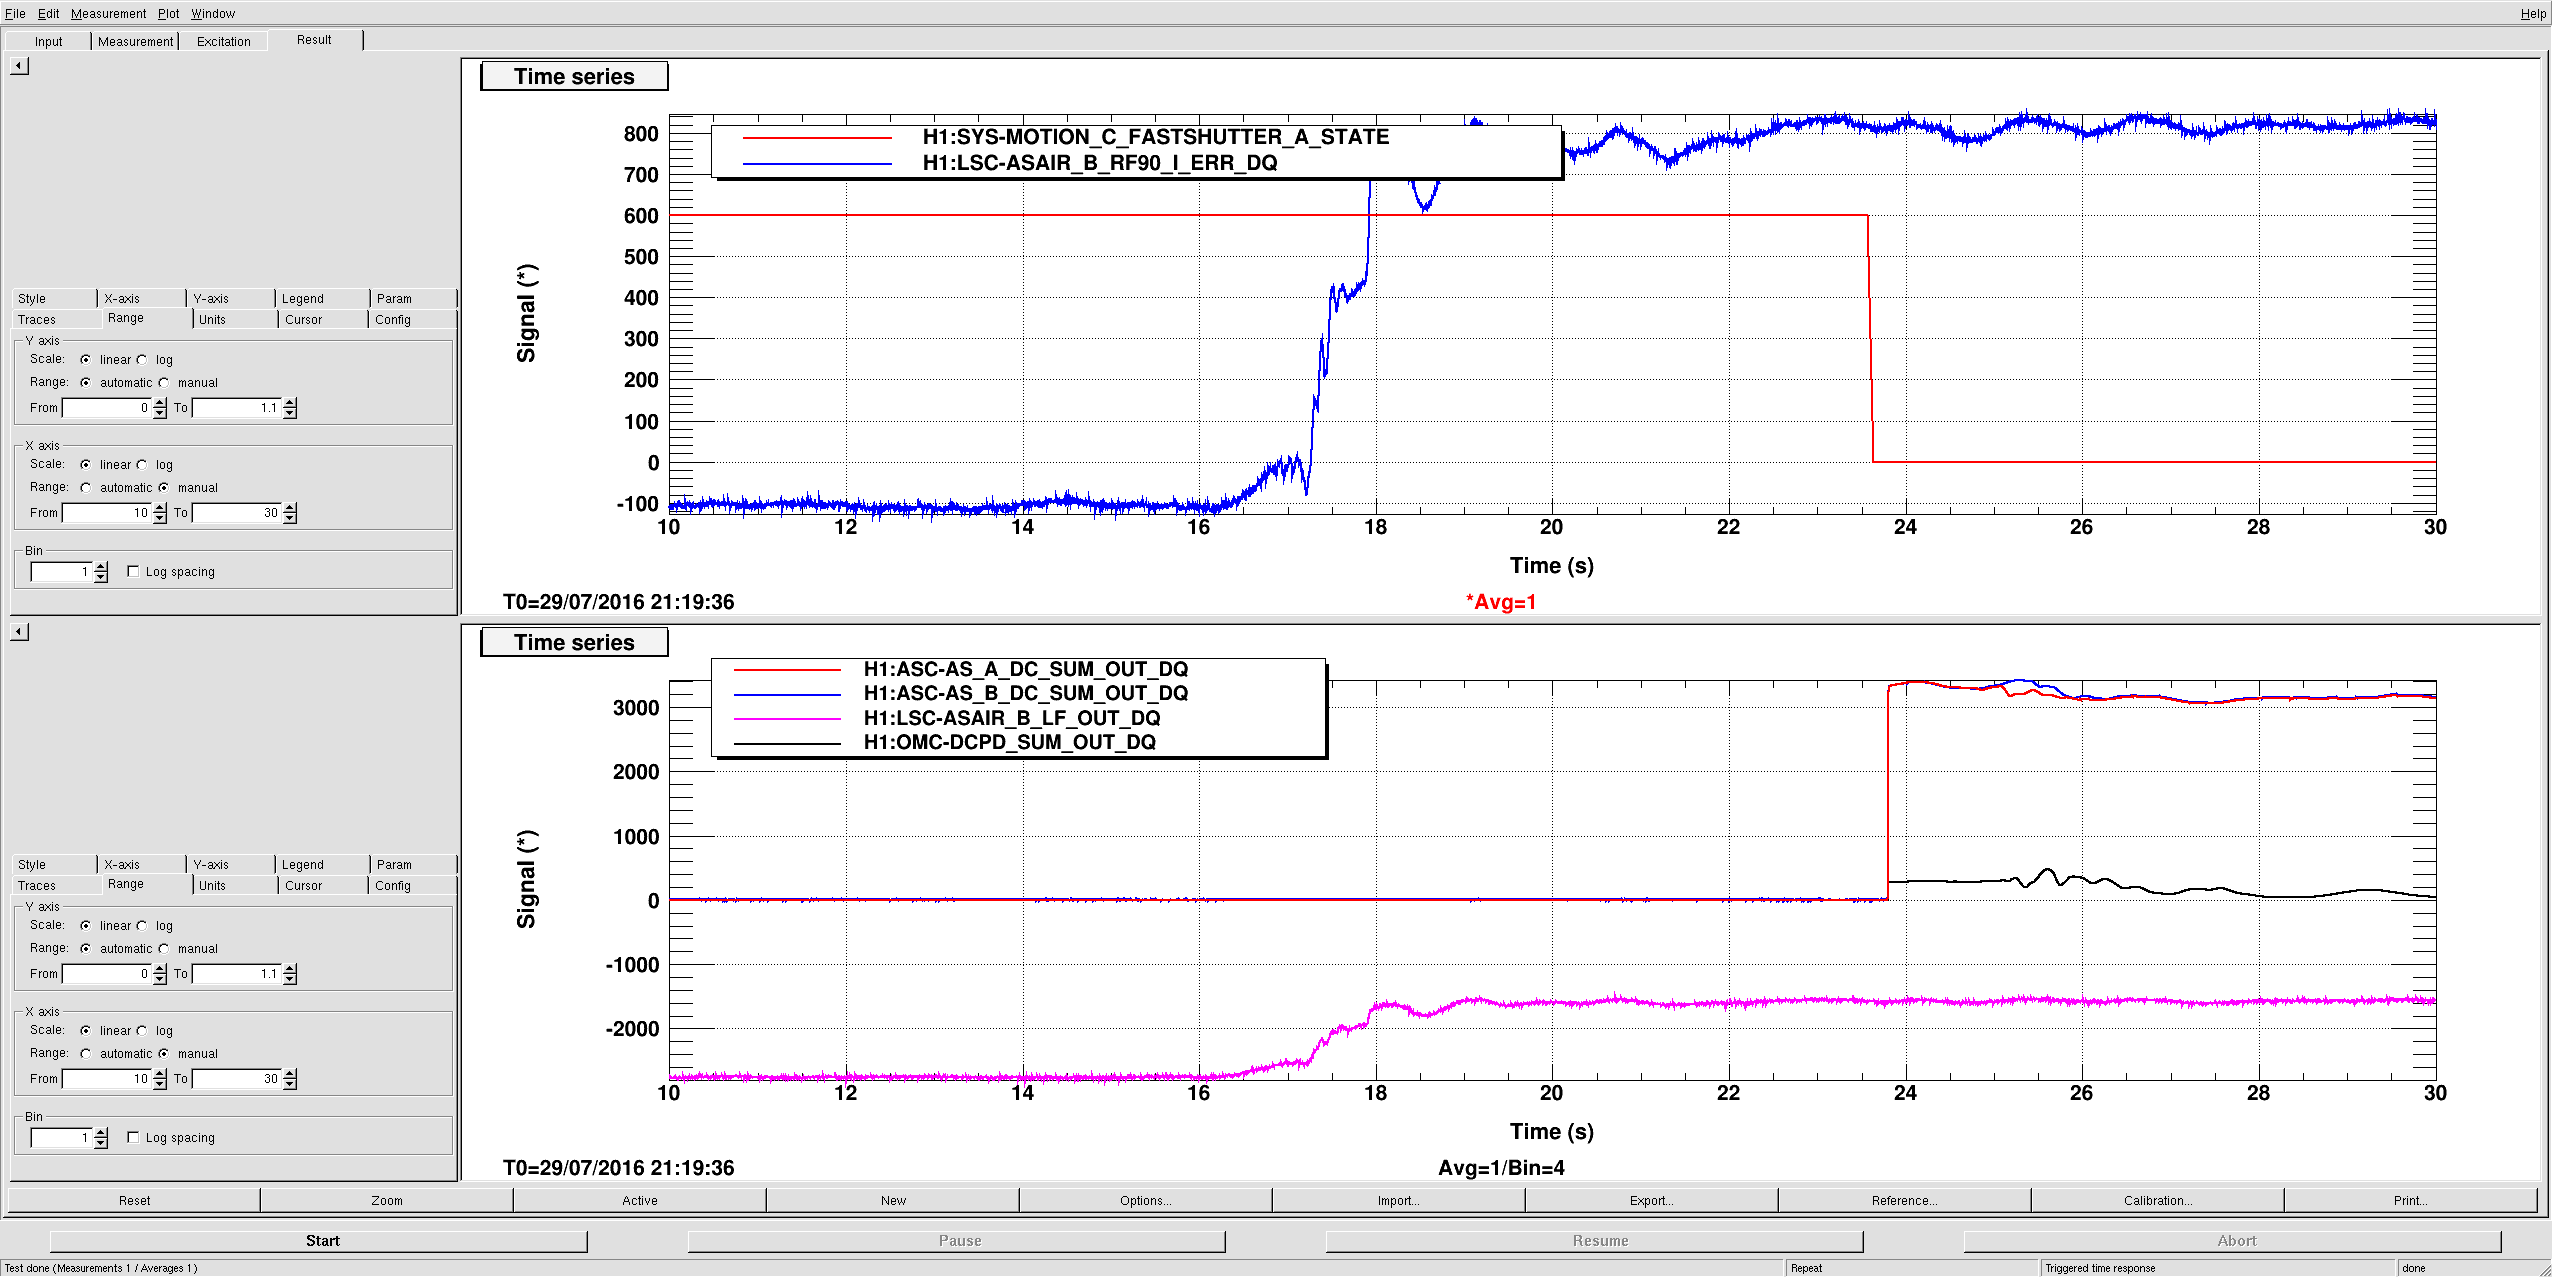
The signal ratios between OMC_QPD_A/B_SUM and AS_C_QPD_SUM (0.56 and 0.59 today) were confirmed with the ones with the numbers on Jul 28 (0.48 and 0.45).
These ratios were enough similar to convince ourselves that they are the real spots.
From this point, we could follow the procedure in T1400588 (sec 2.3.3 and later).
- OMCS and OM3 were debiased to have (0,0), and used OM1 and 2 to align the spots on the OMC QPDs.
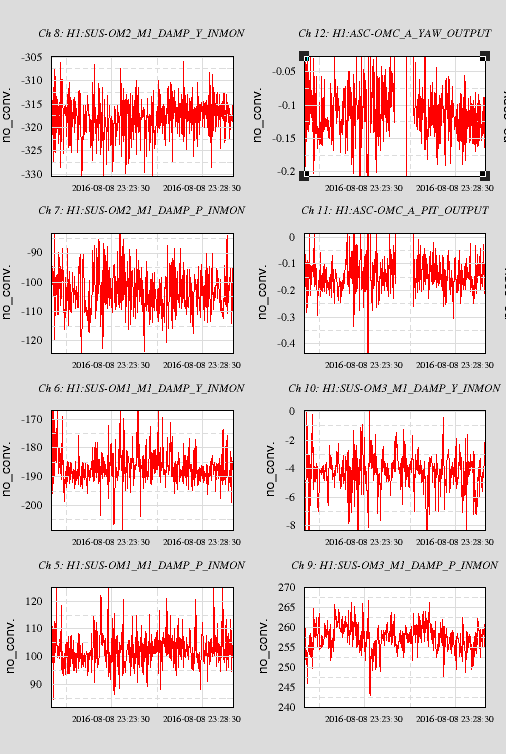
- This made OM1 Yaw ~-2000, and the OMC2 Pitch ~1500.
- The OM1 suspension cage was twisted to remove the OM1 Yaw bias.
- The OM2 suspension pitch adjustment screw was adjusted to remove the OM2 Pitch bias.
- The resulting offsets were: OM1 (116.9, -229.0), OM2 (94.5, 113.0), OM3 (0,0), OMCS (0,0) => Requirement <250 = 1/10th of the full scale => OK!
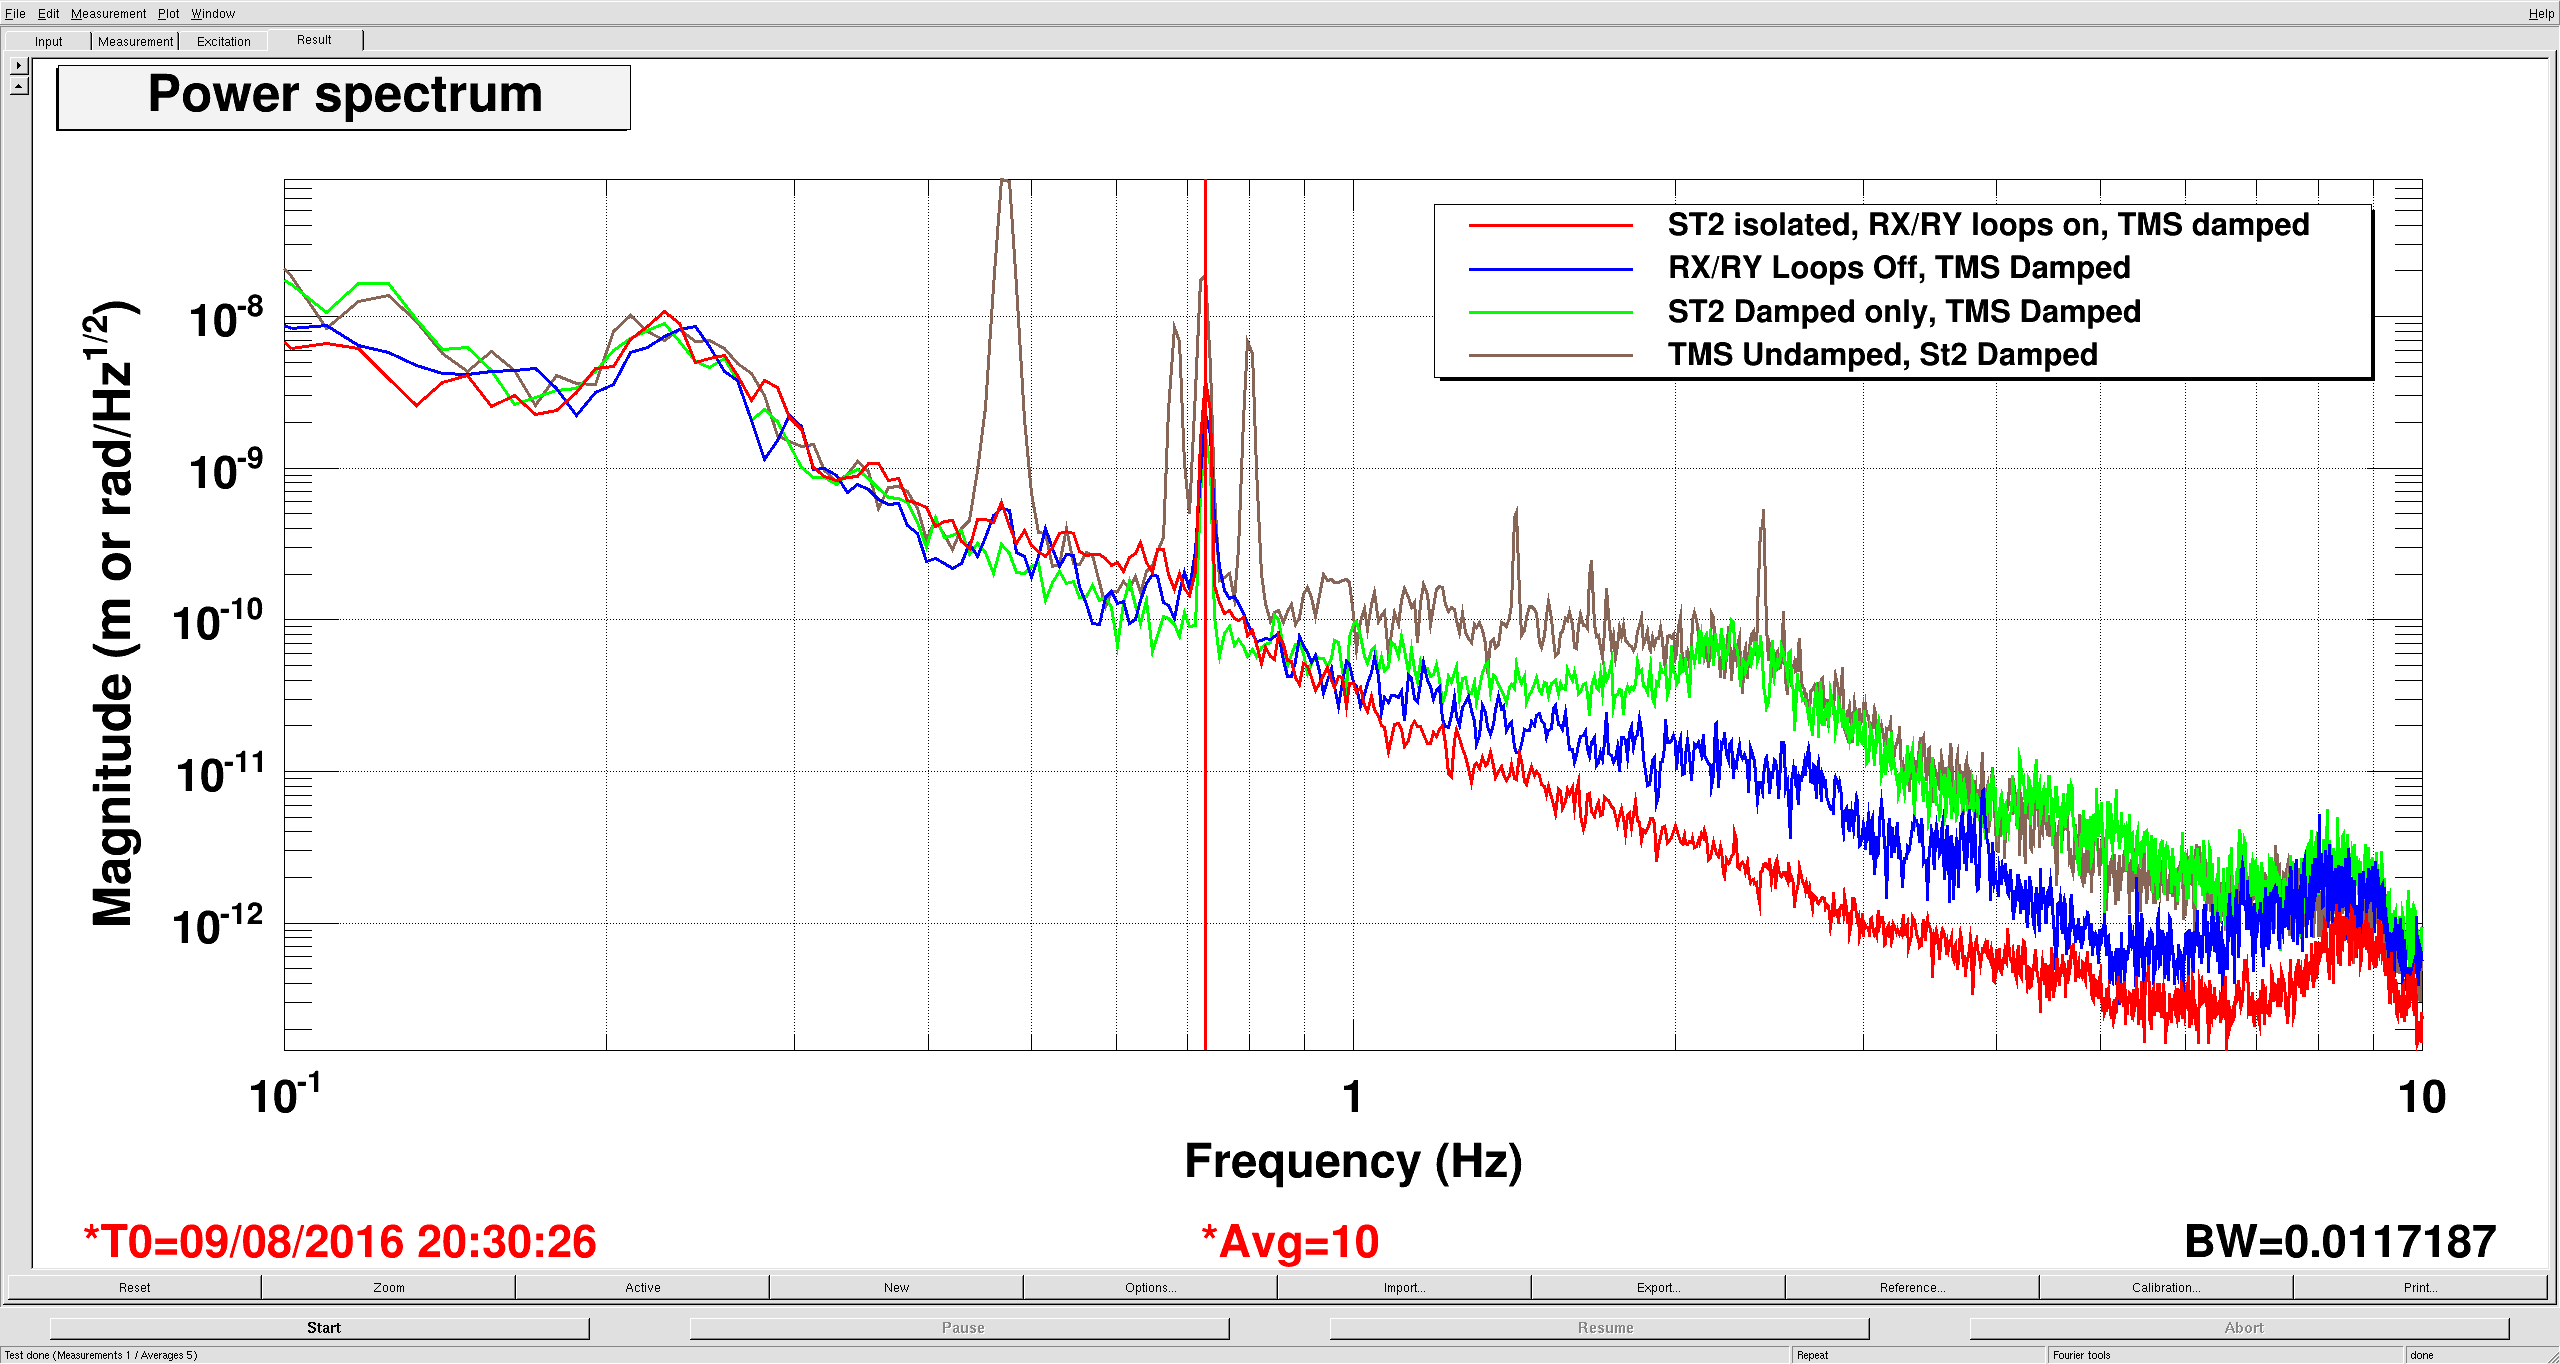
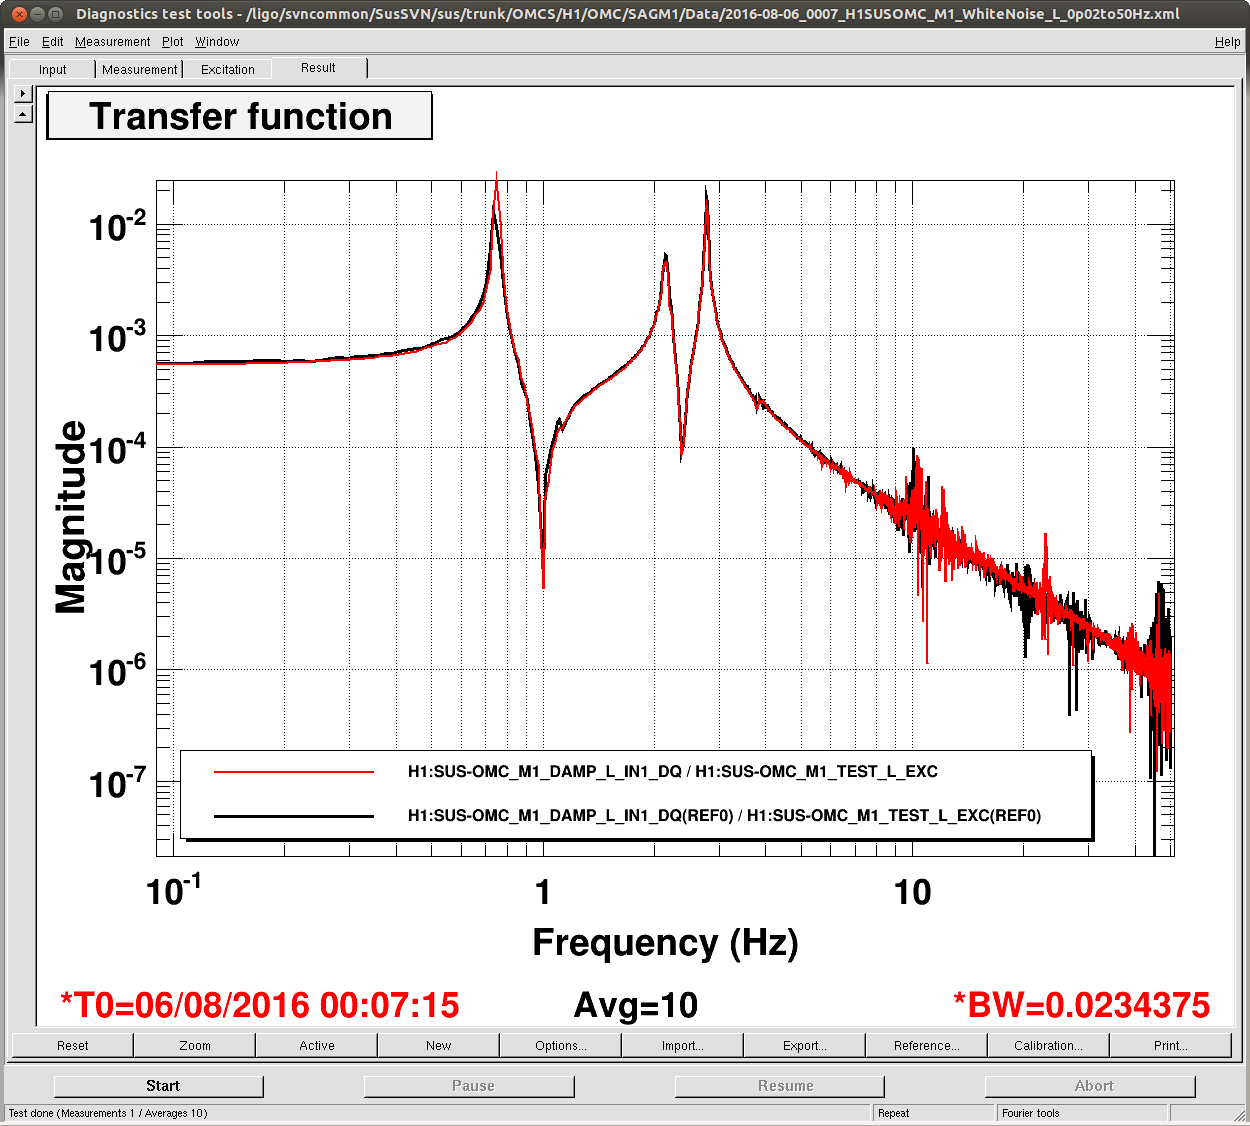
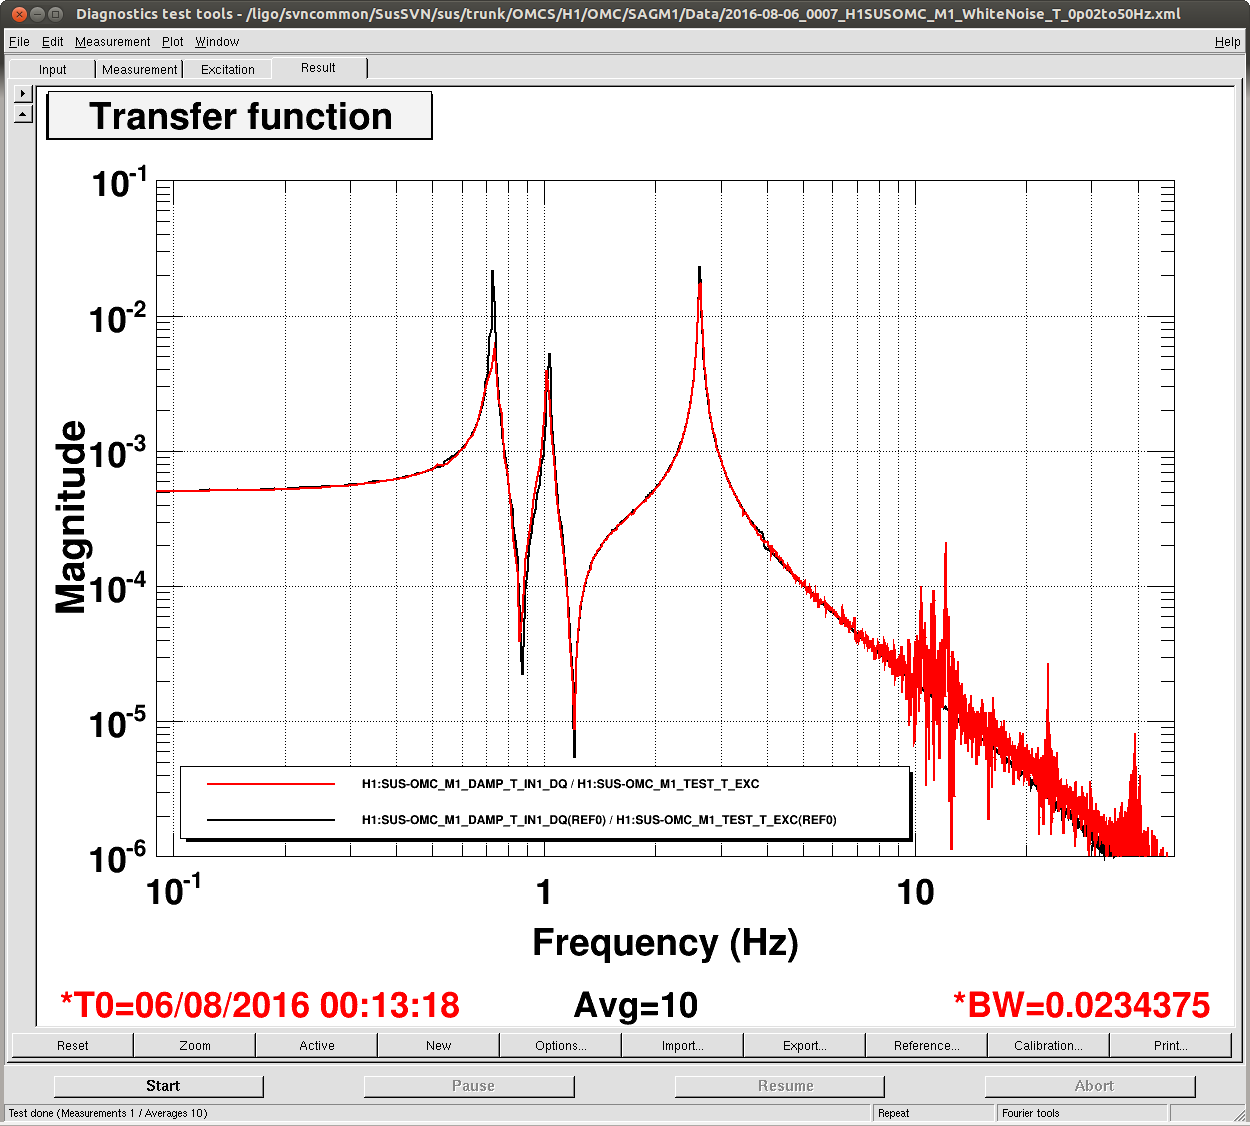
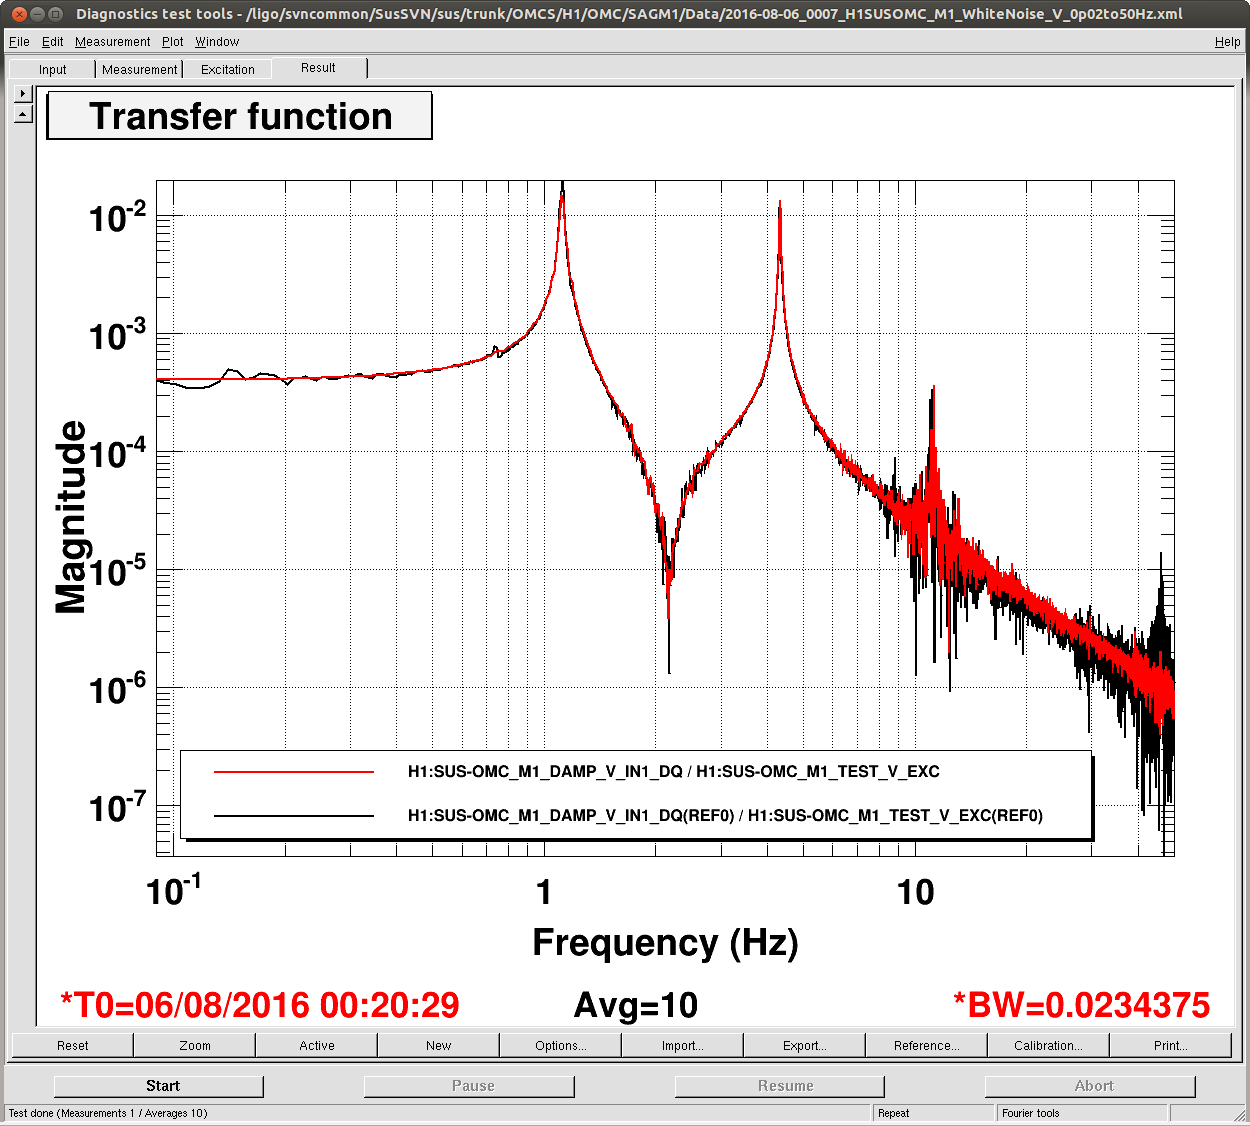
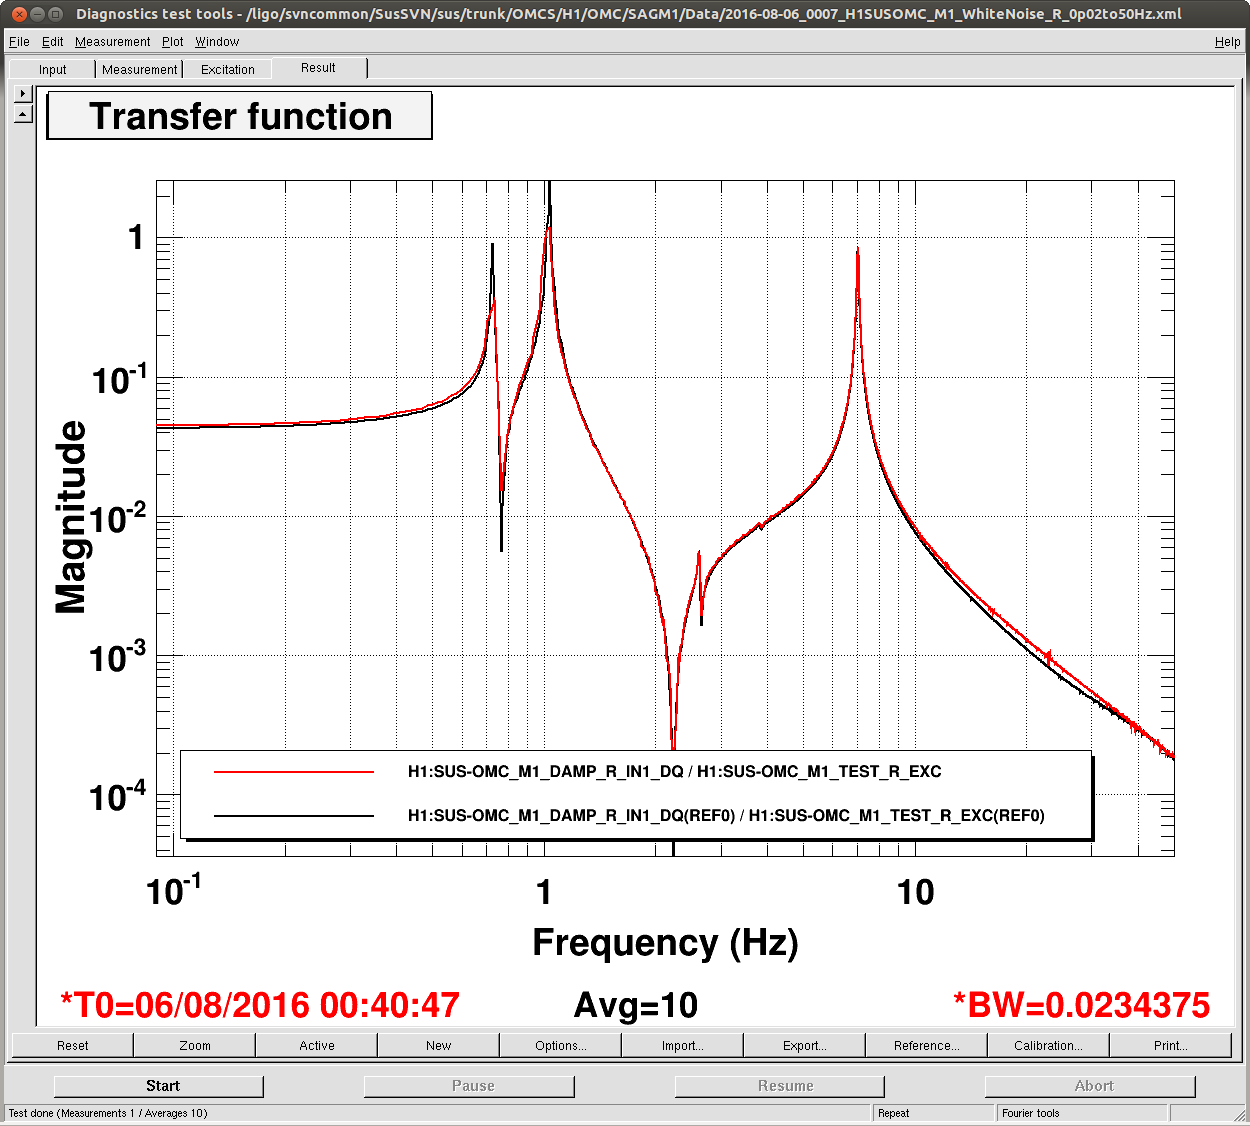
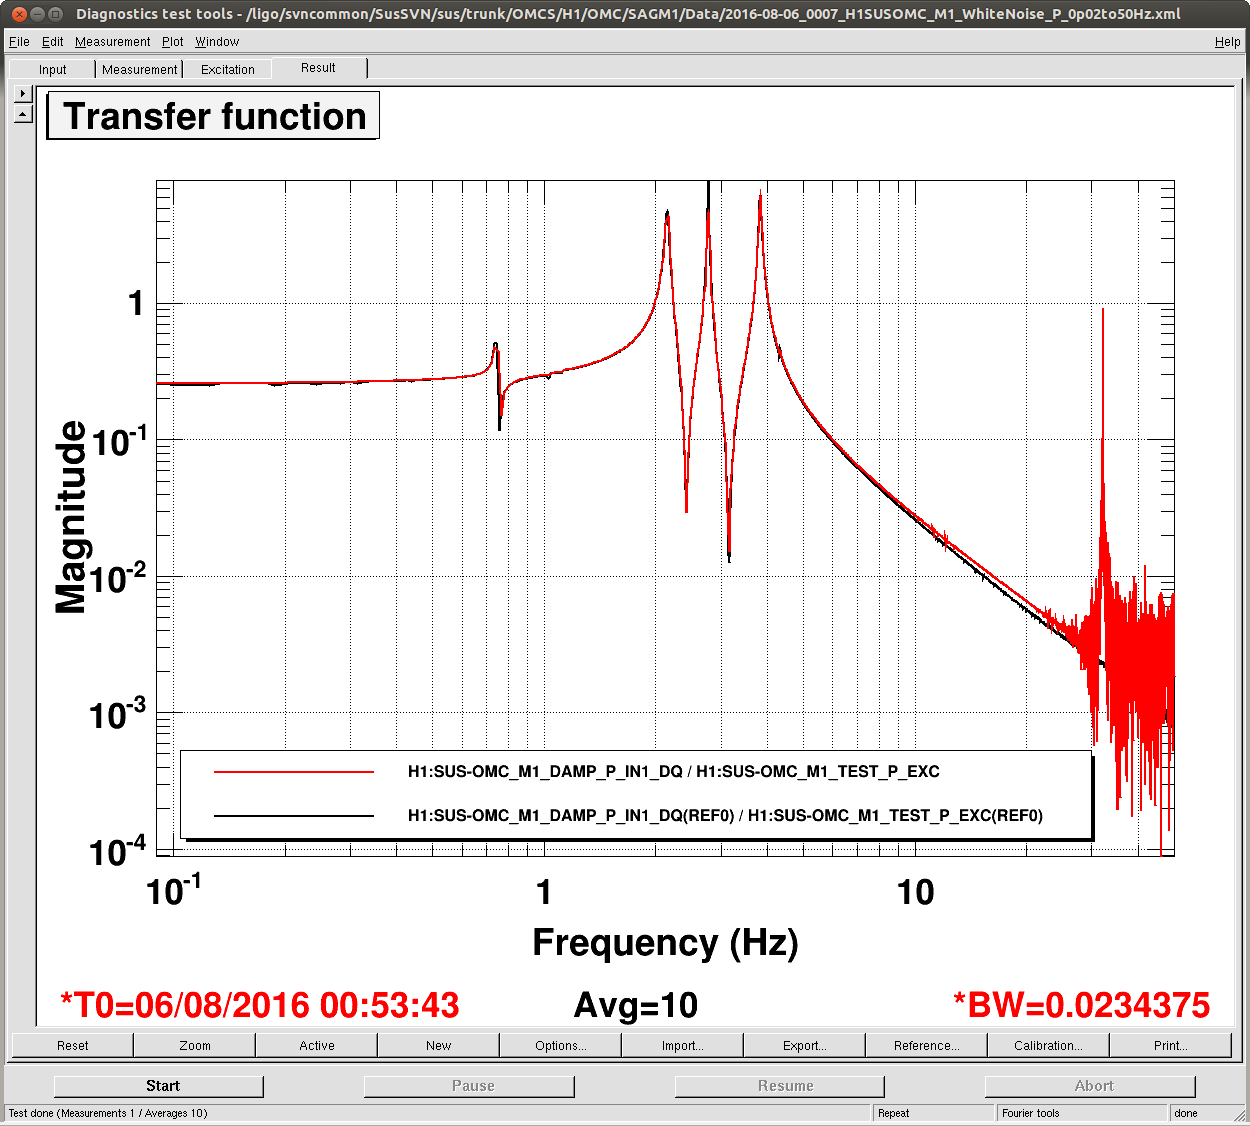
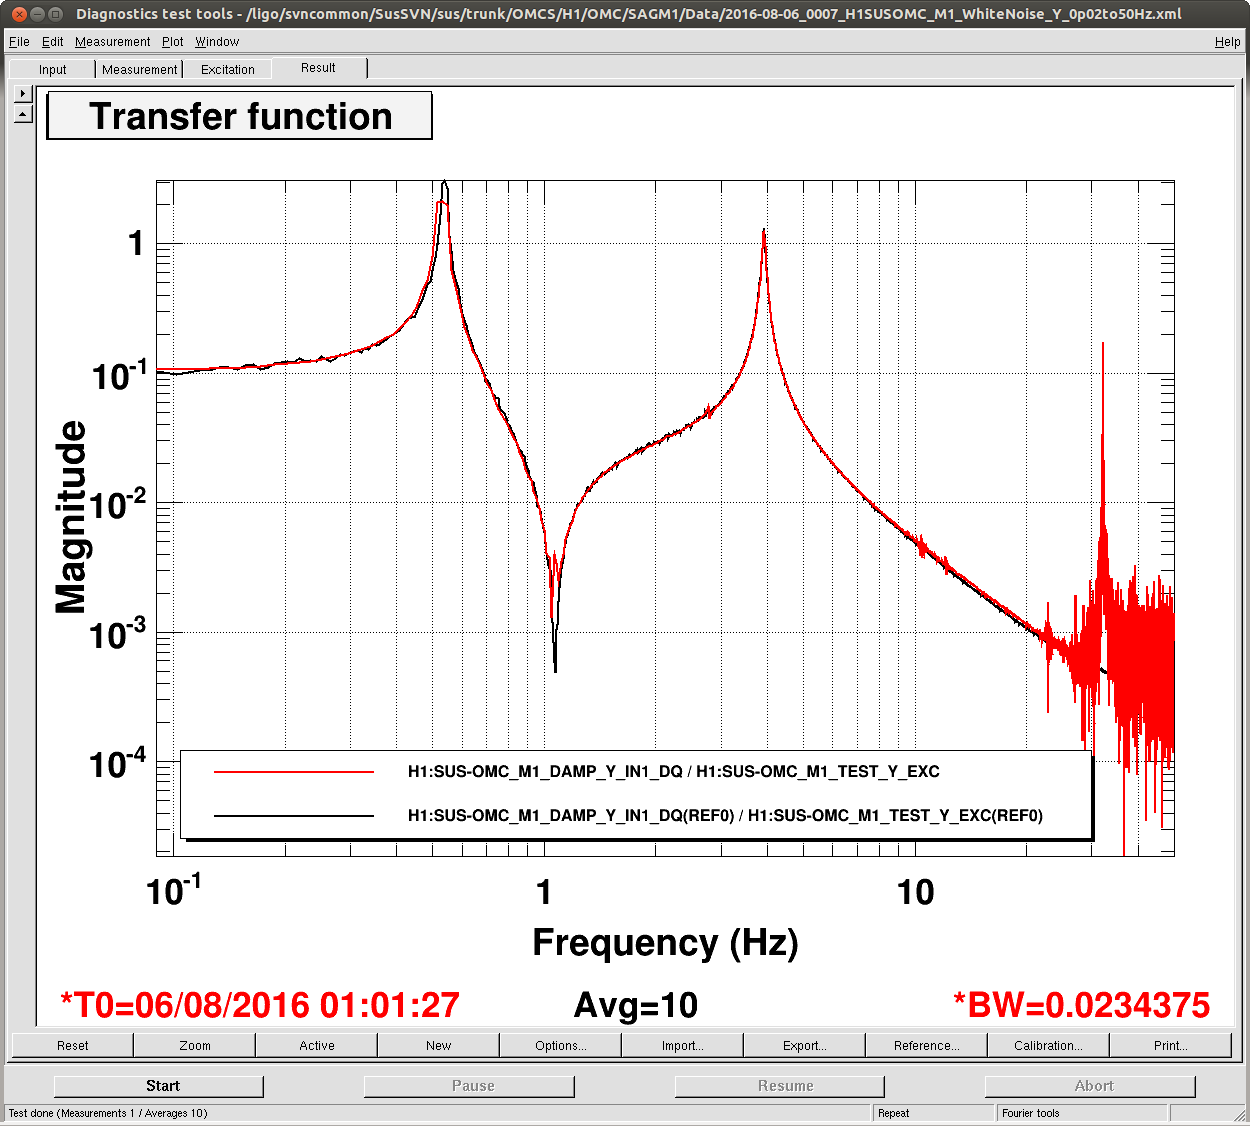
- We quickly checked some suspension transfer functions for OM1/OM2 and OMCS. OM1 and OM2 showed consistent TFs as the previous measurements. OMCS had the same resonant structures as before except for the resonant frequency of the lowest frequency mode. JeffK is checking the TFs more carefully.
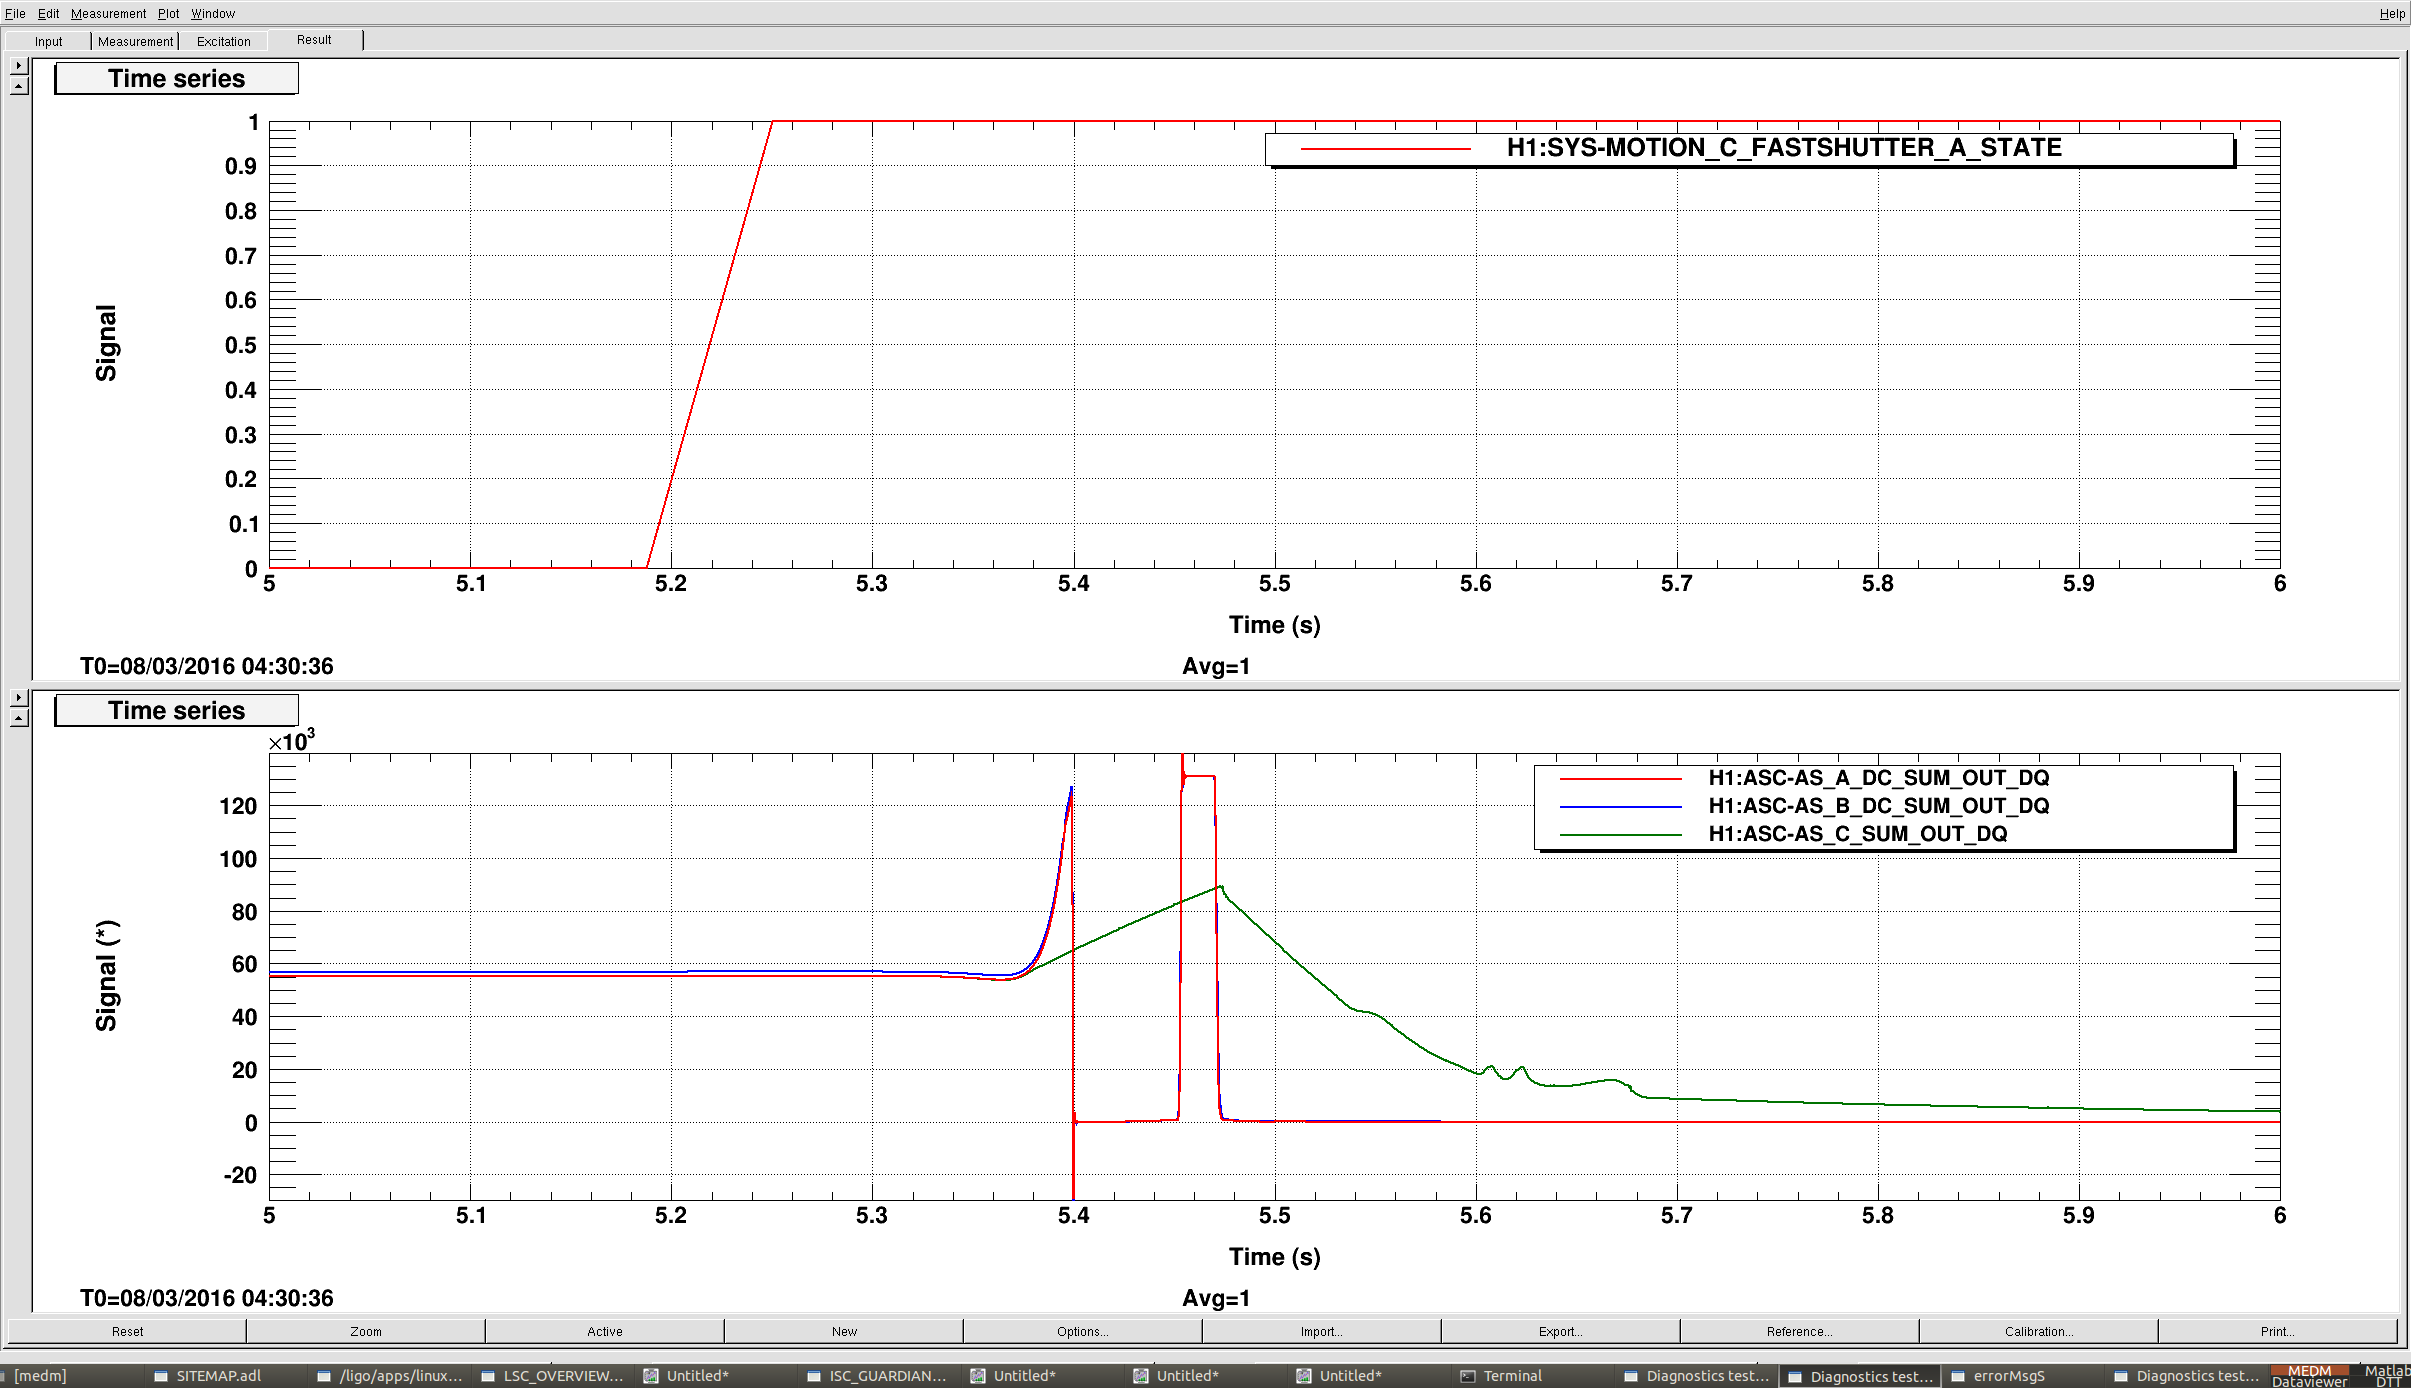
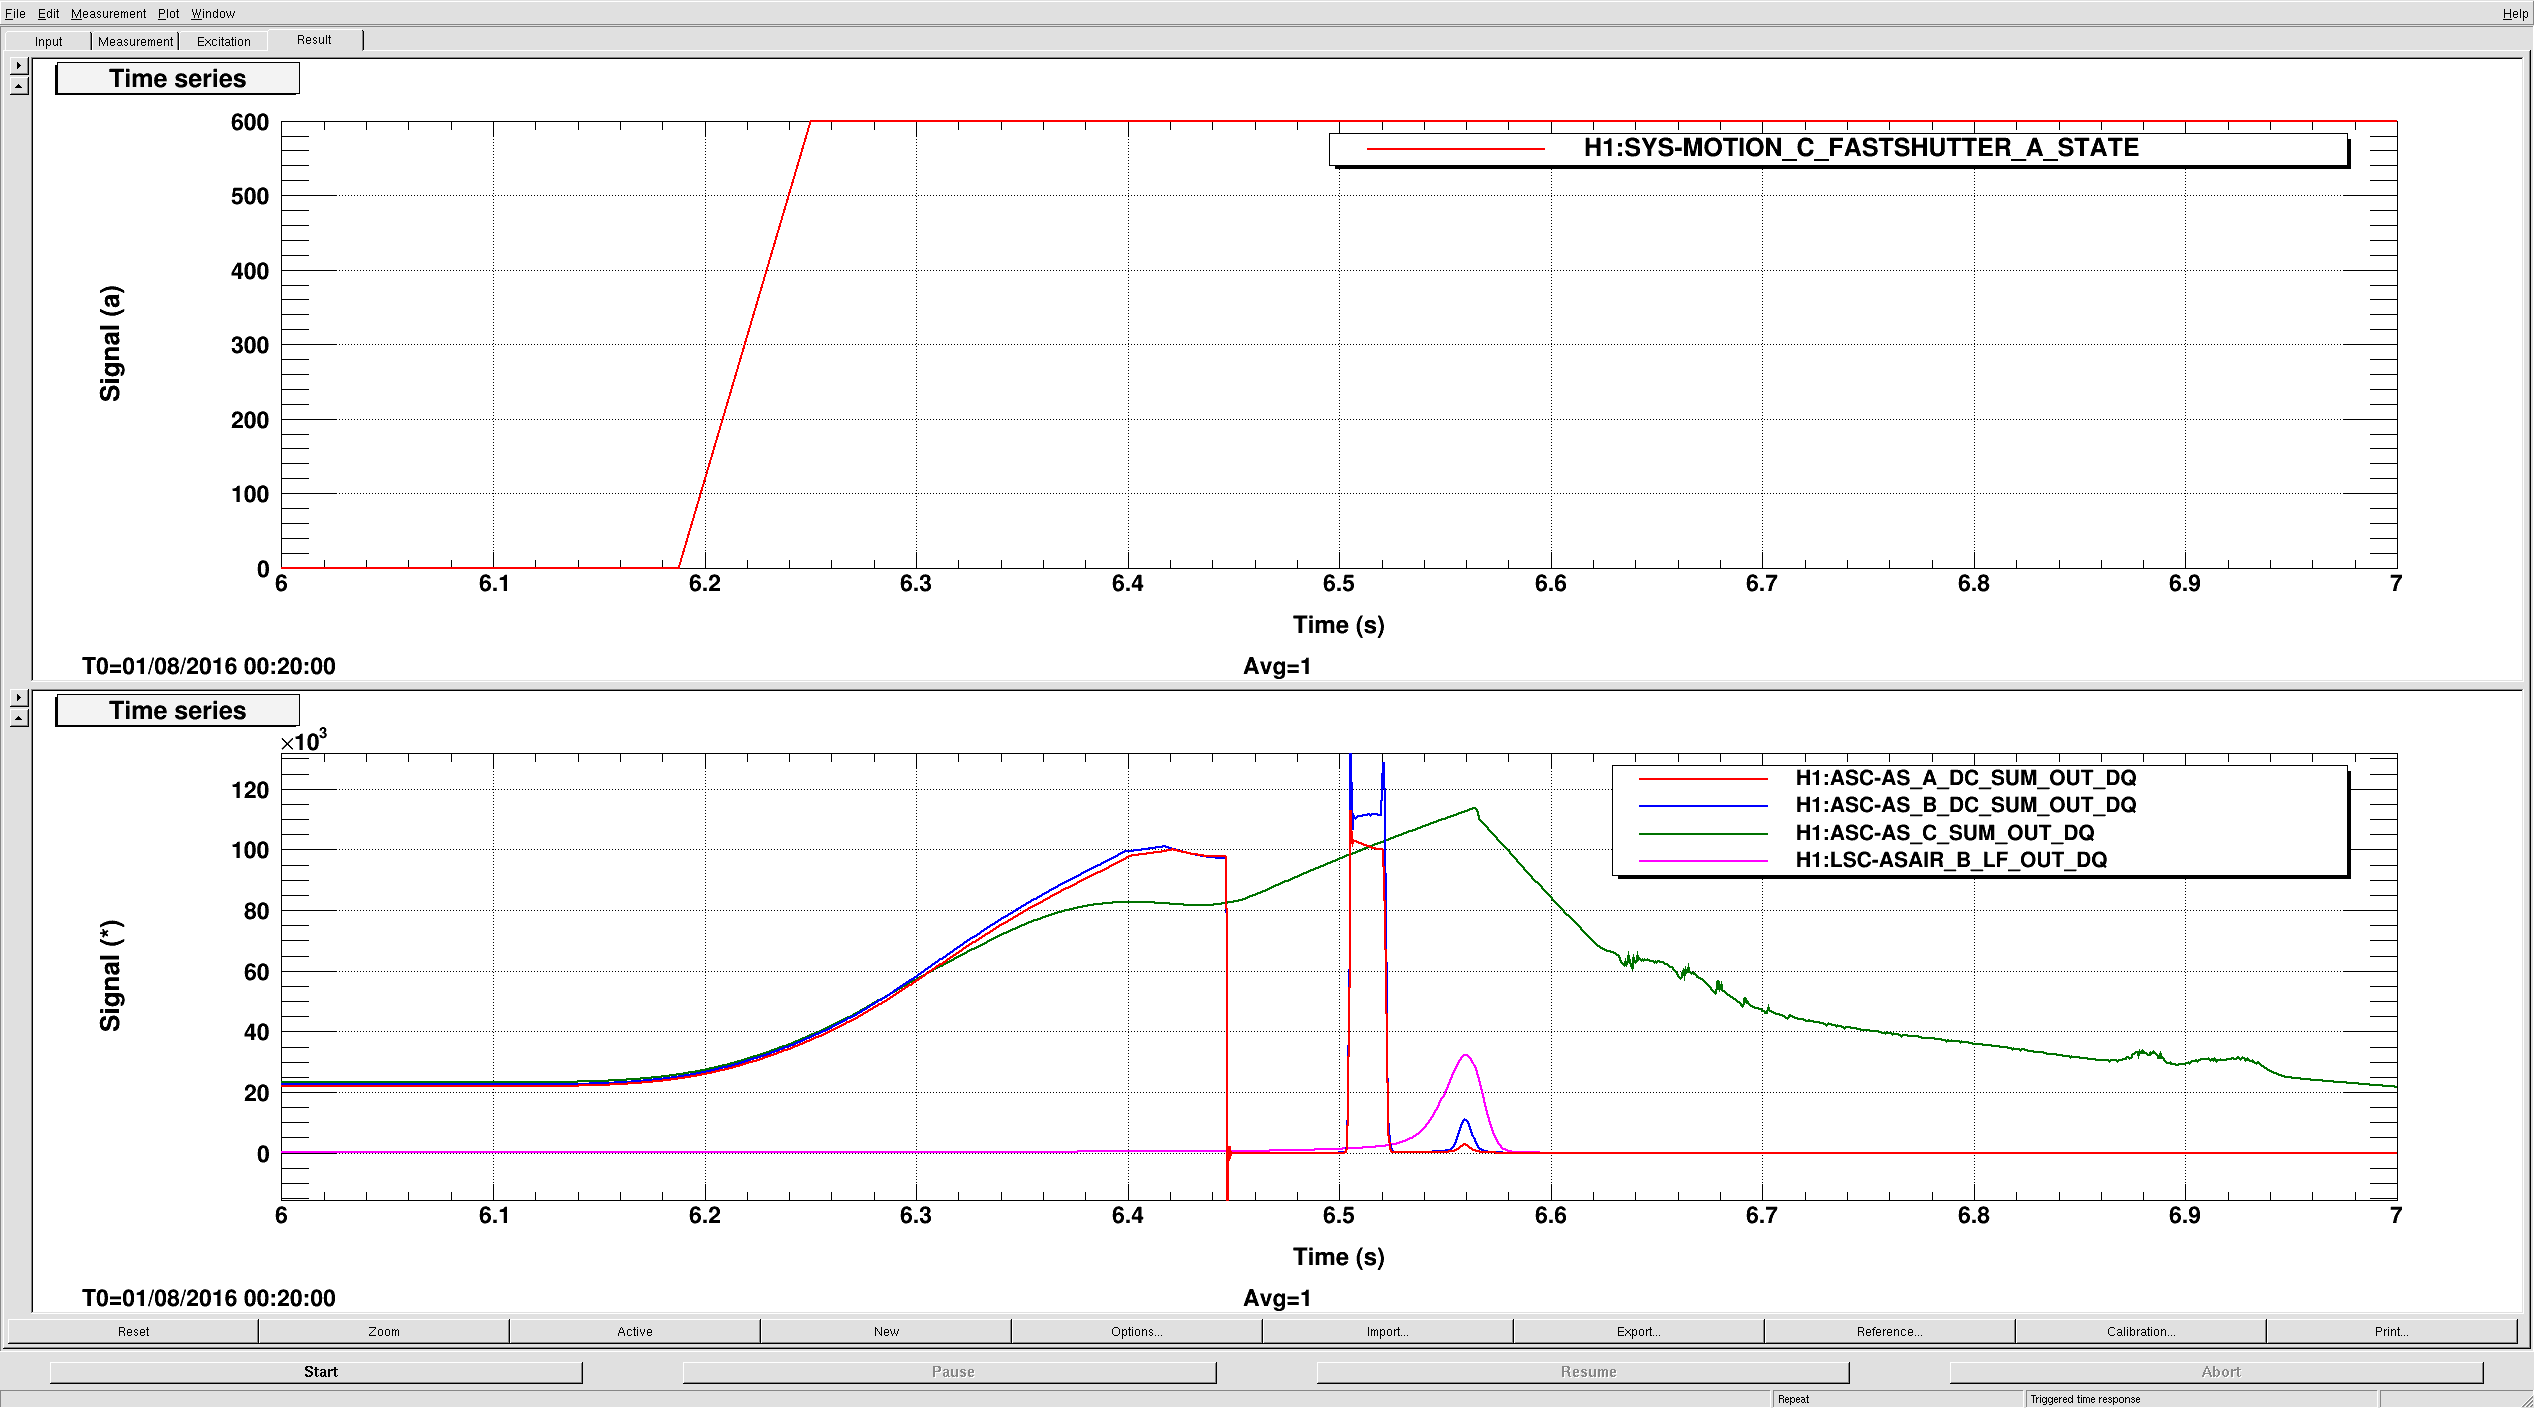
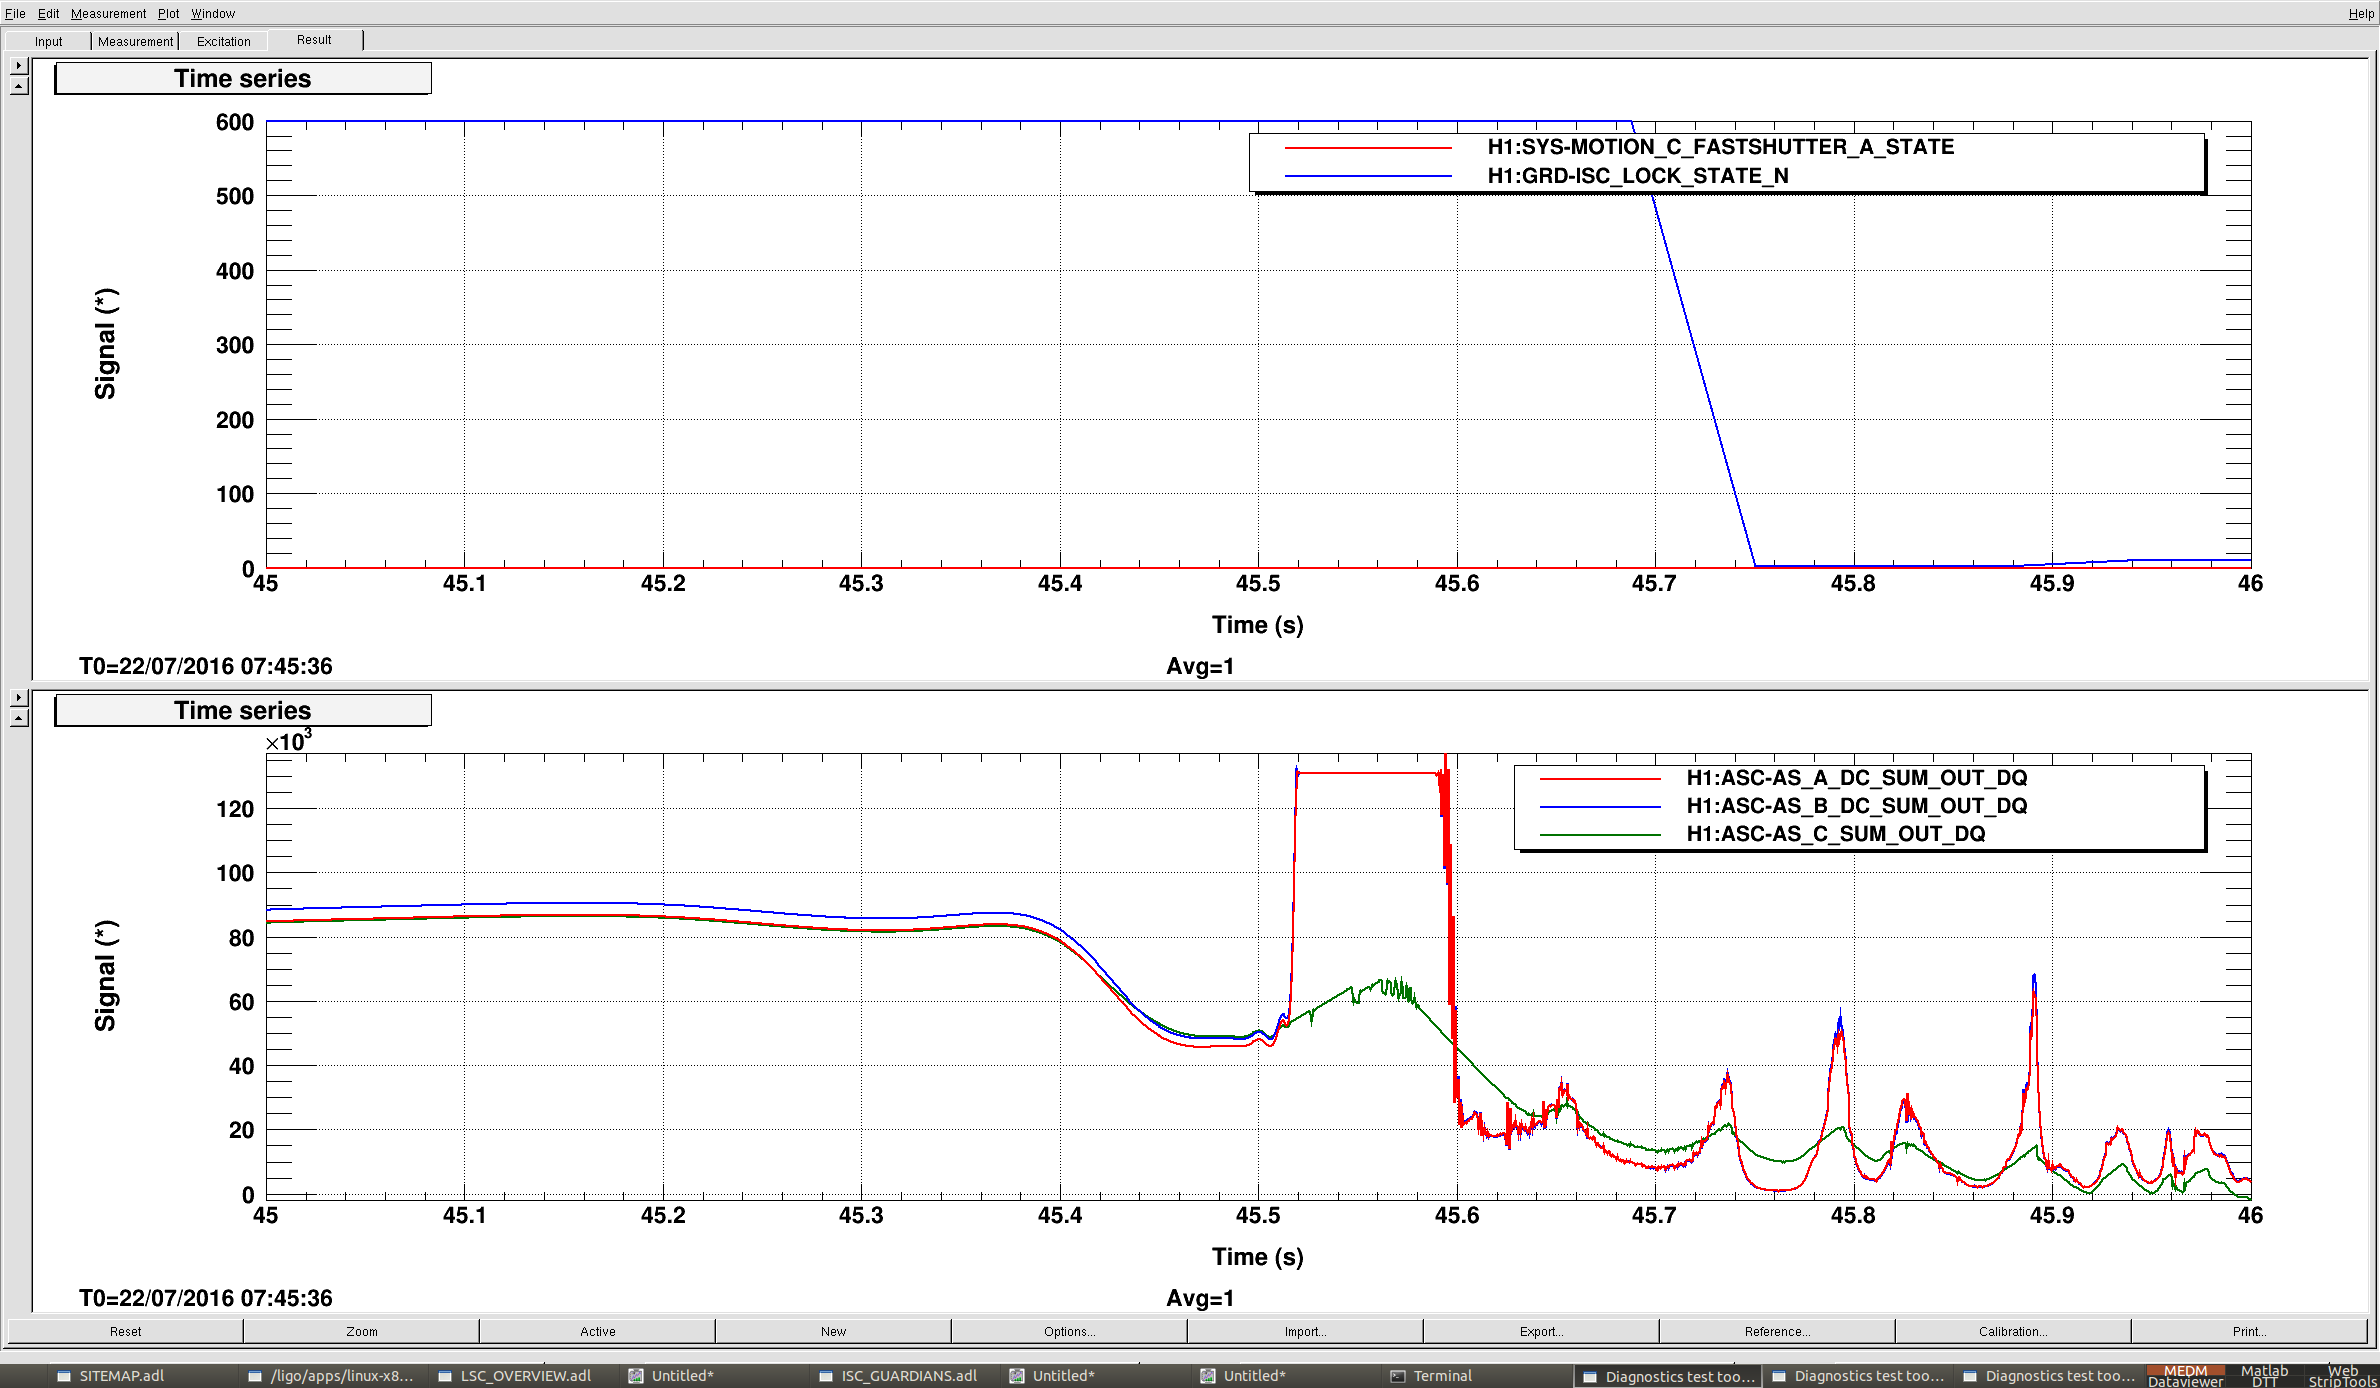
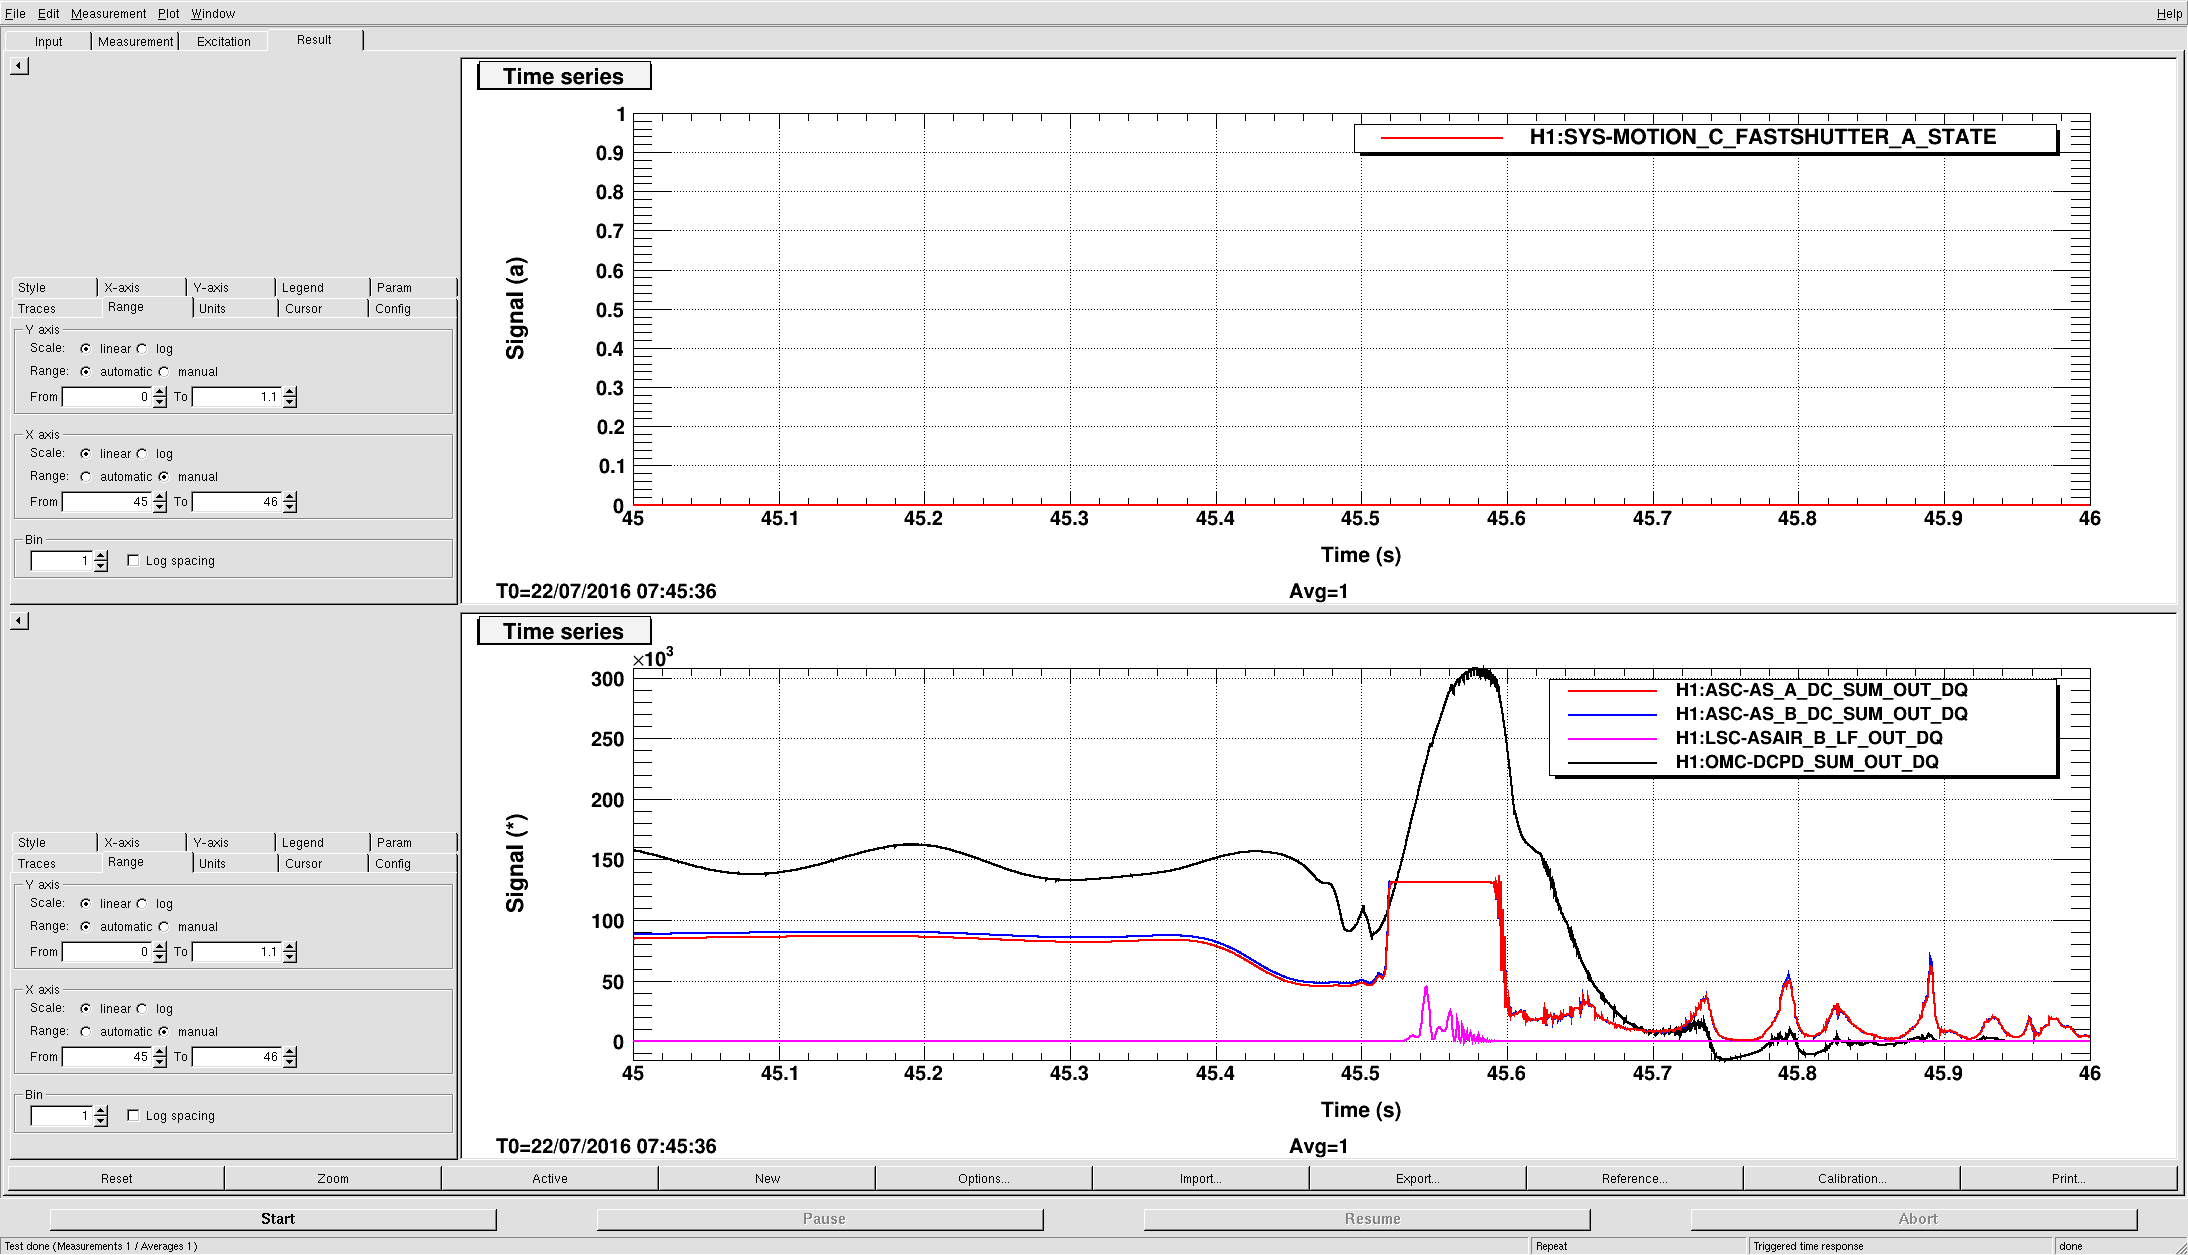
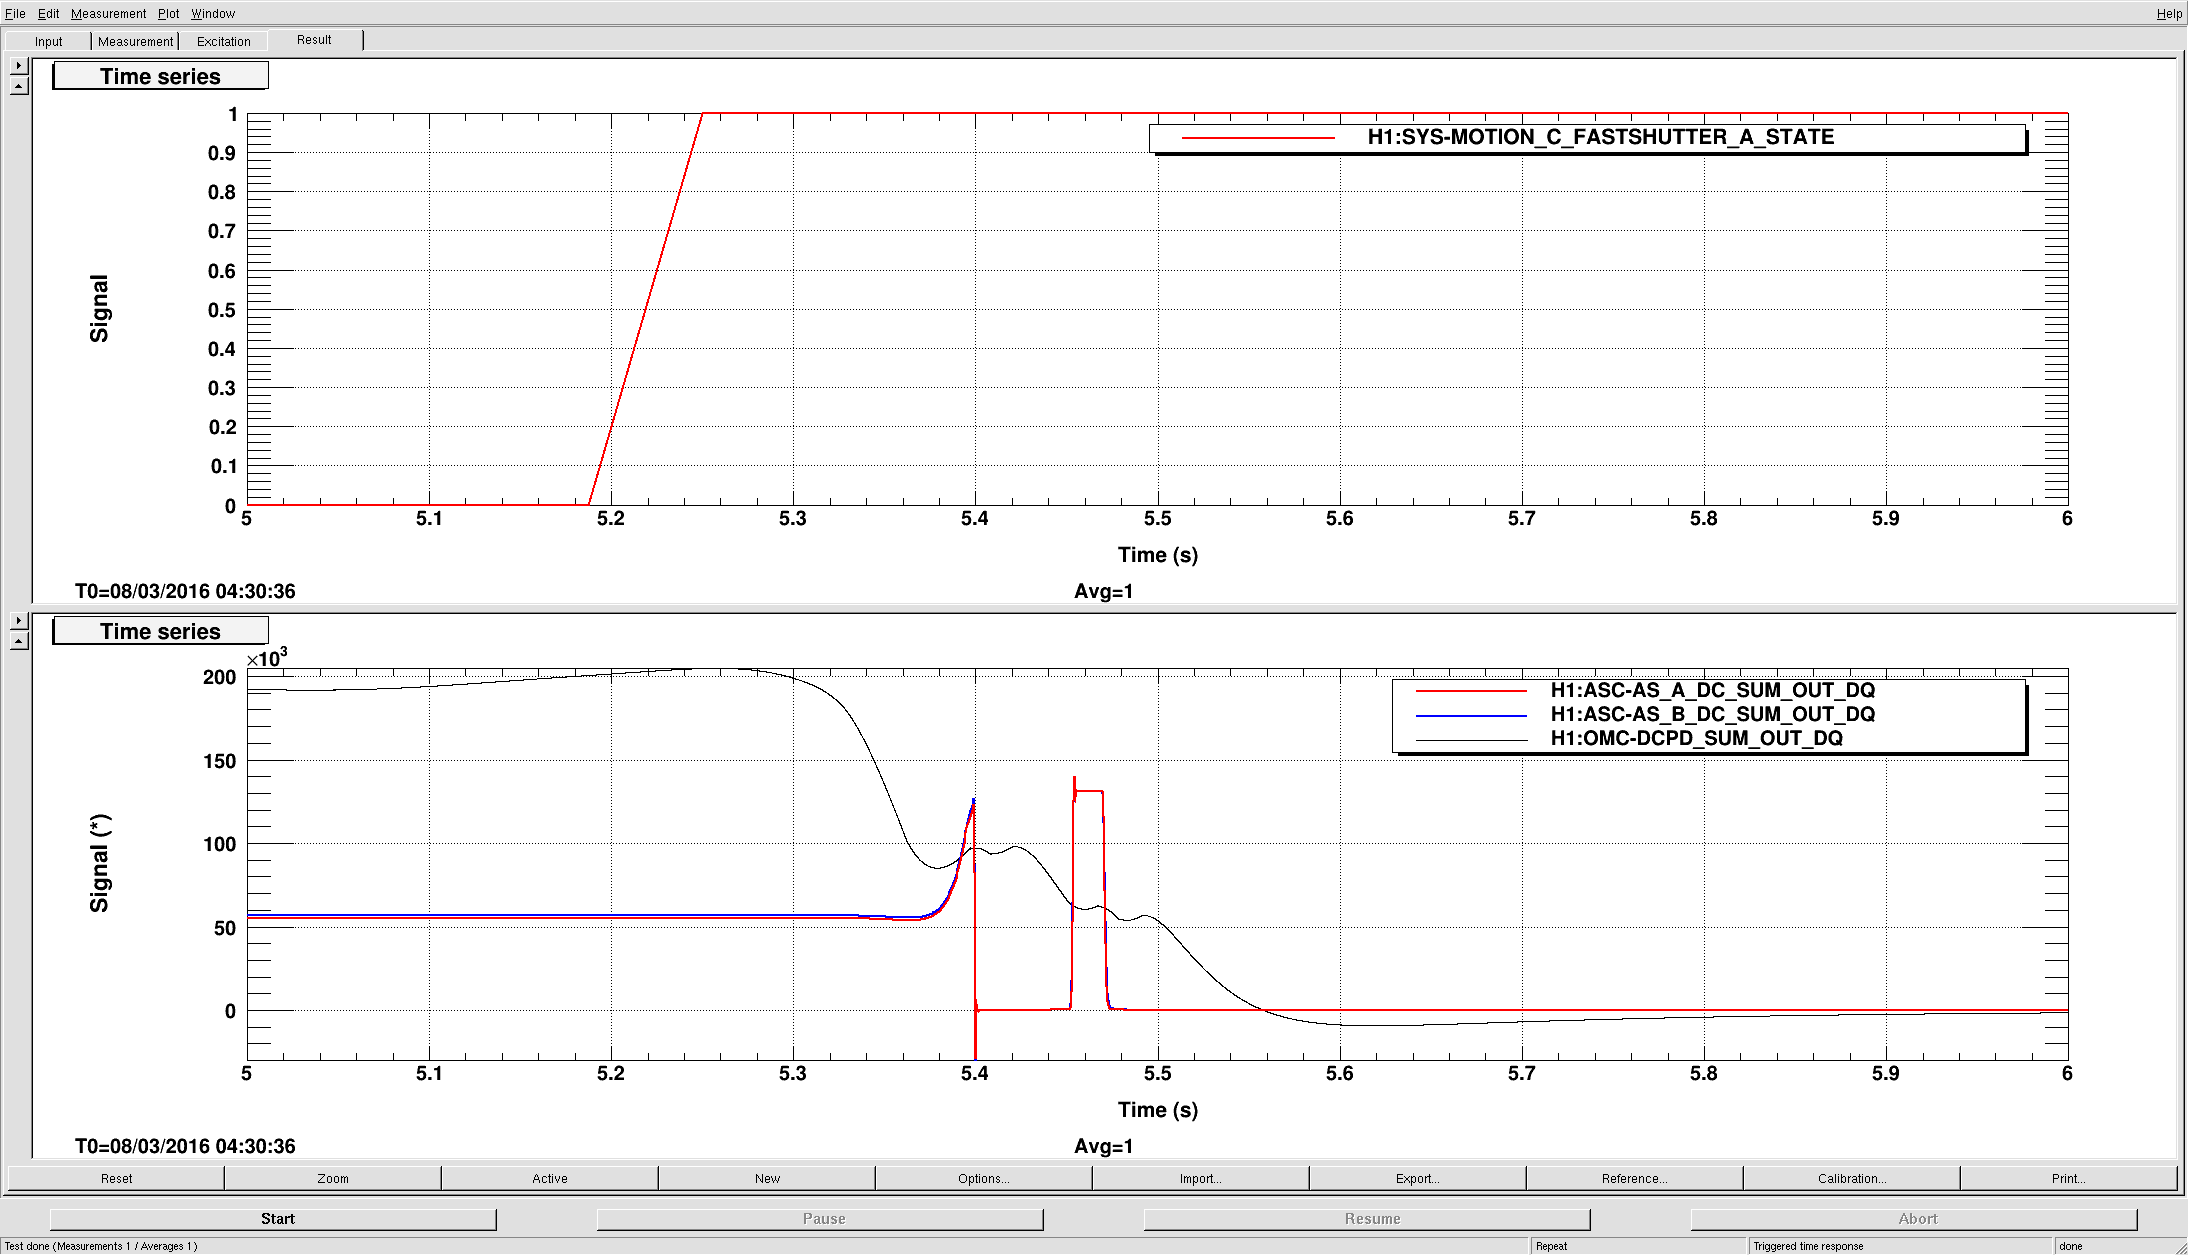
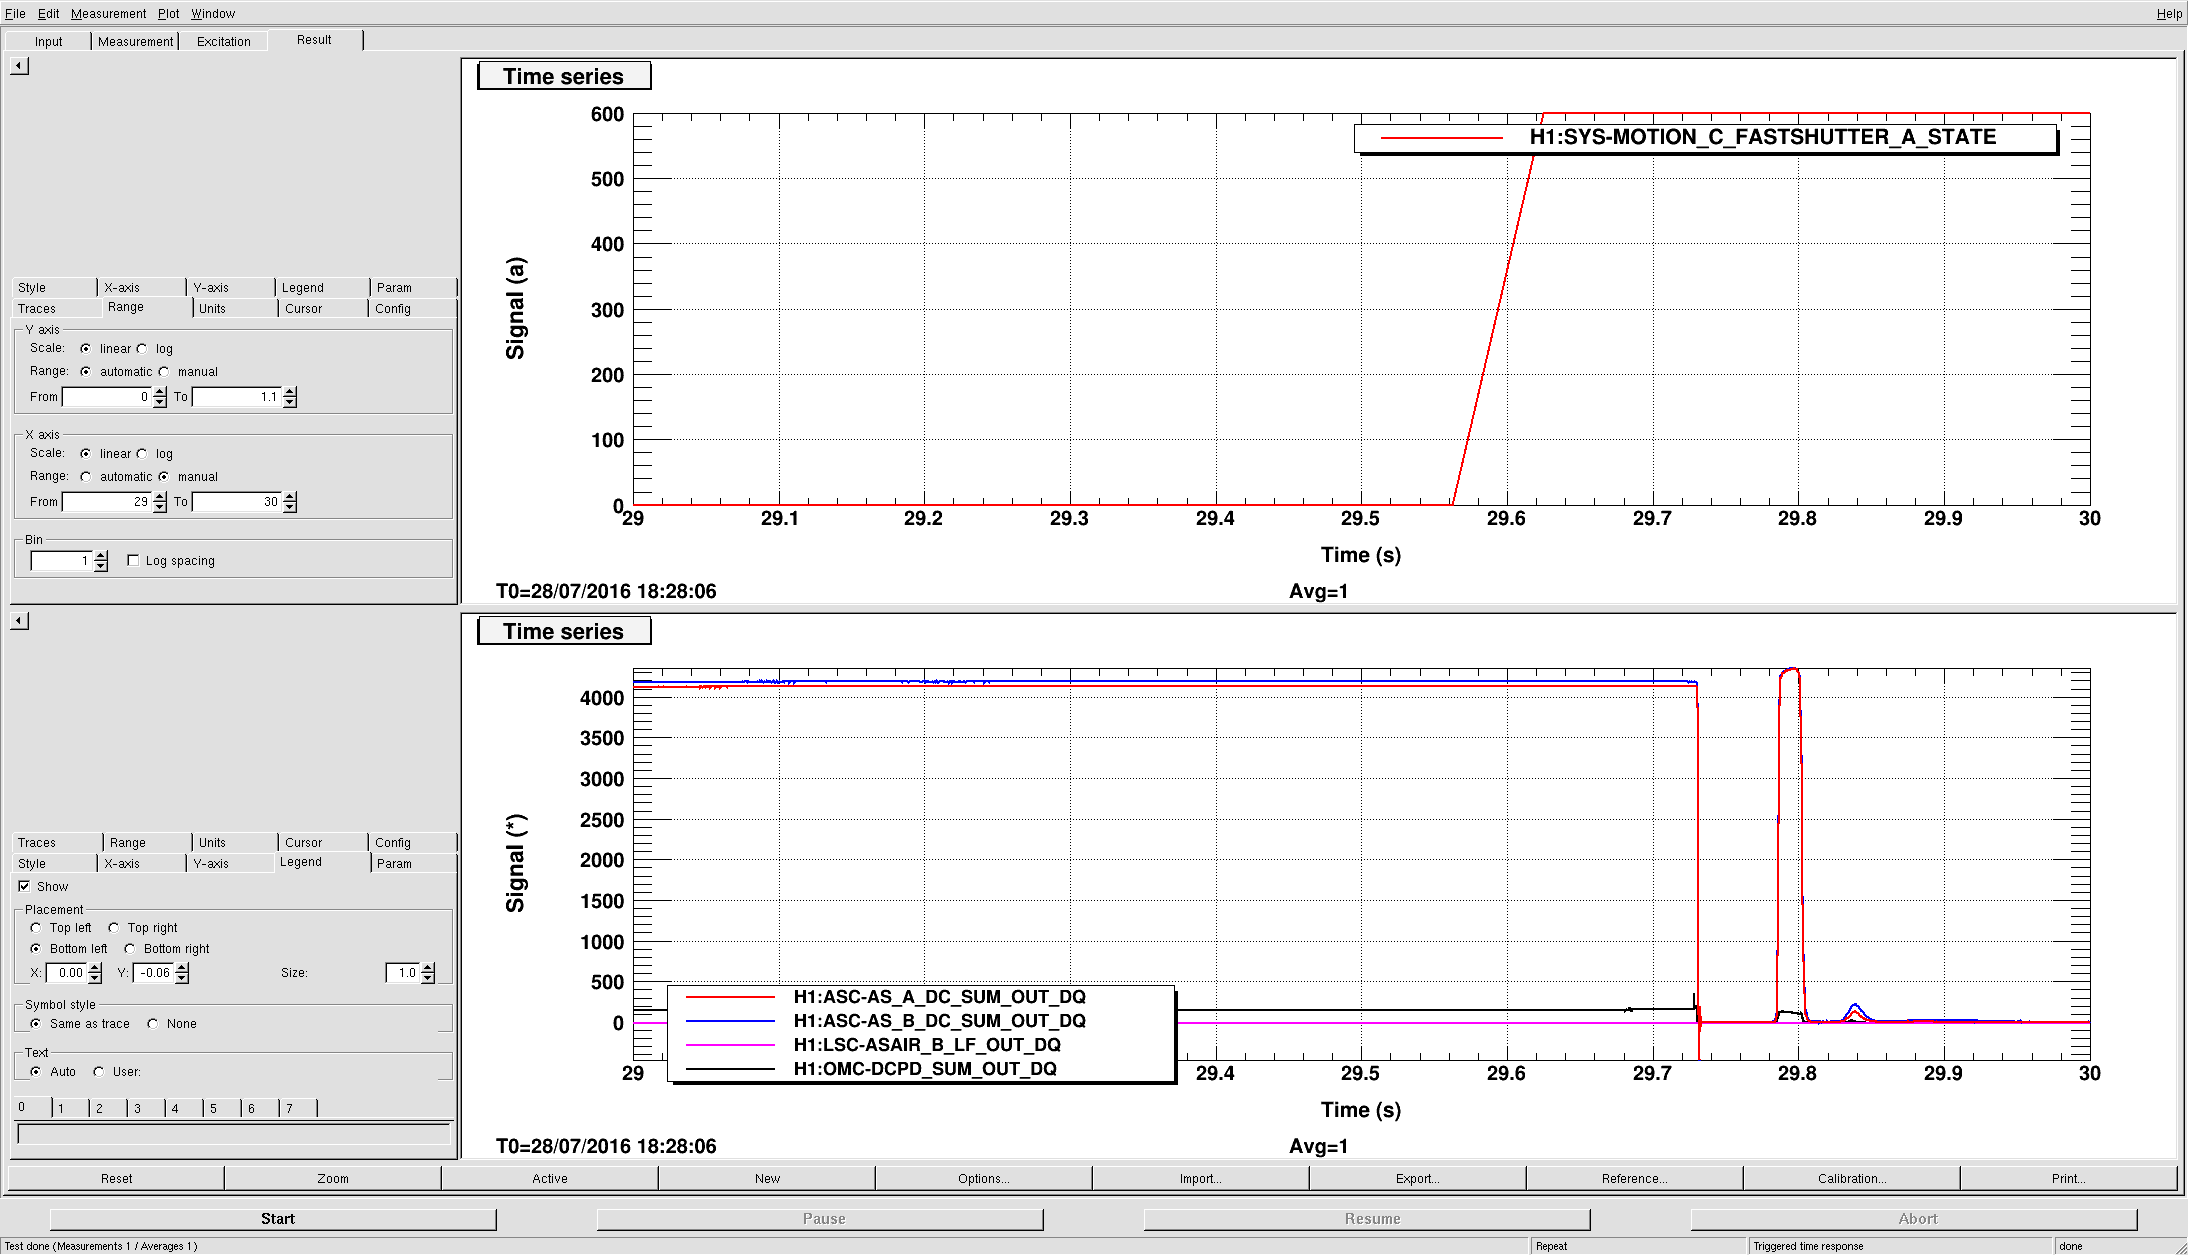
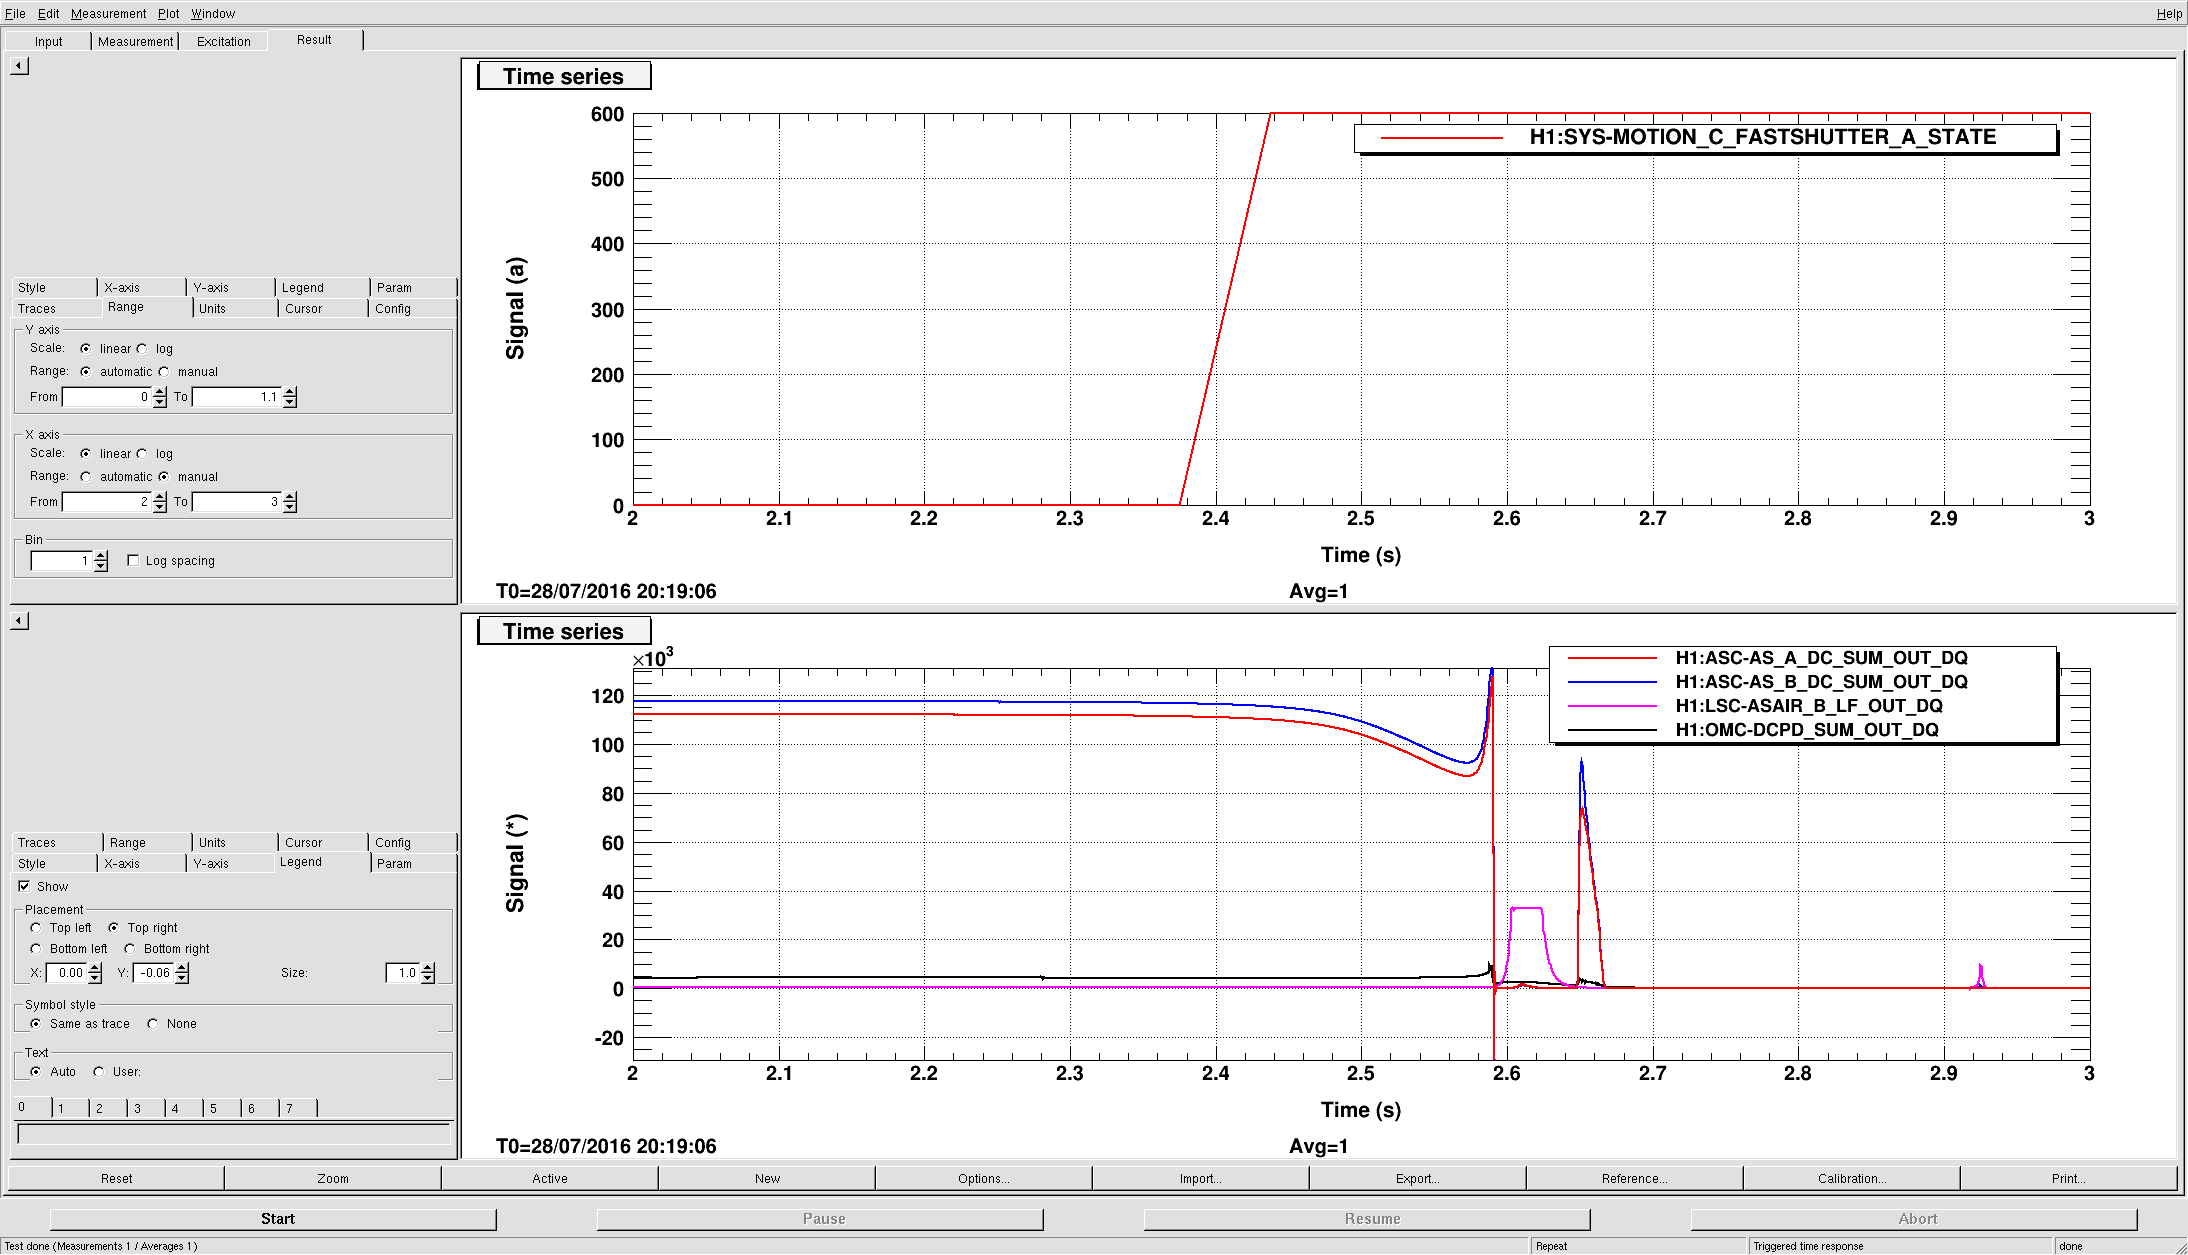
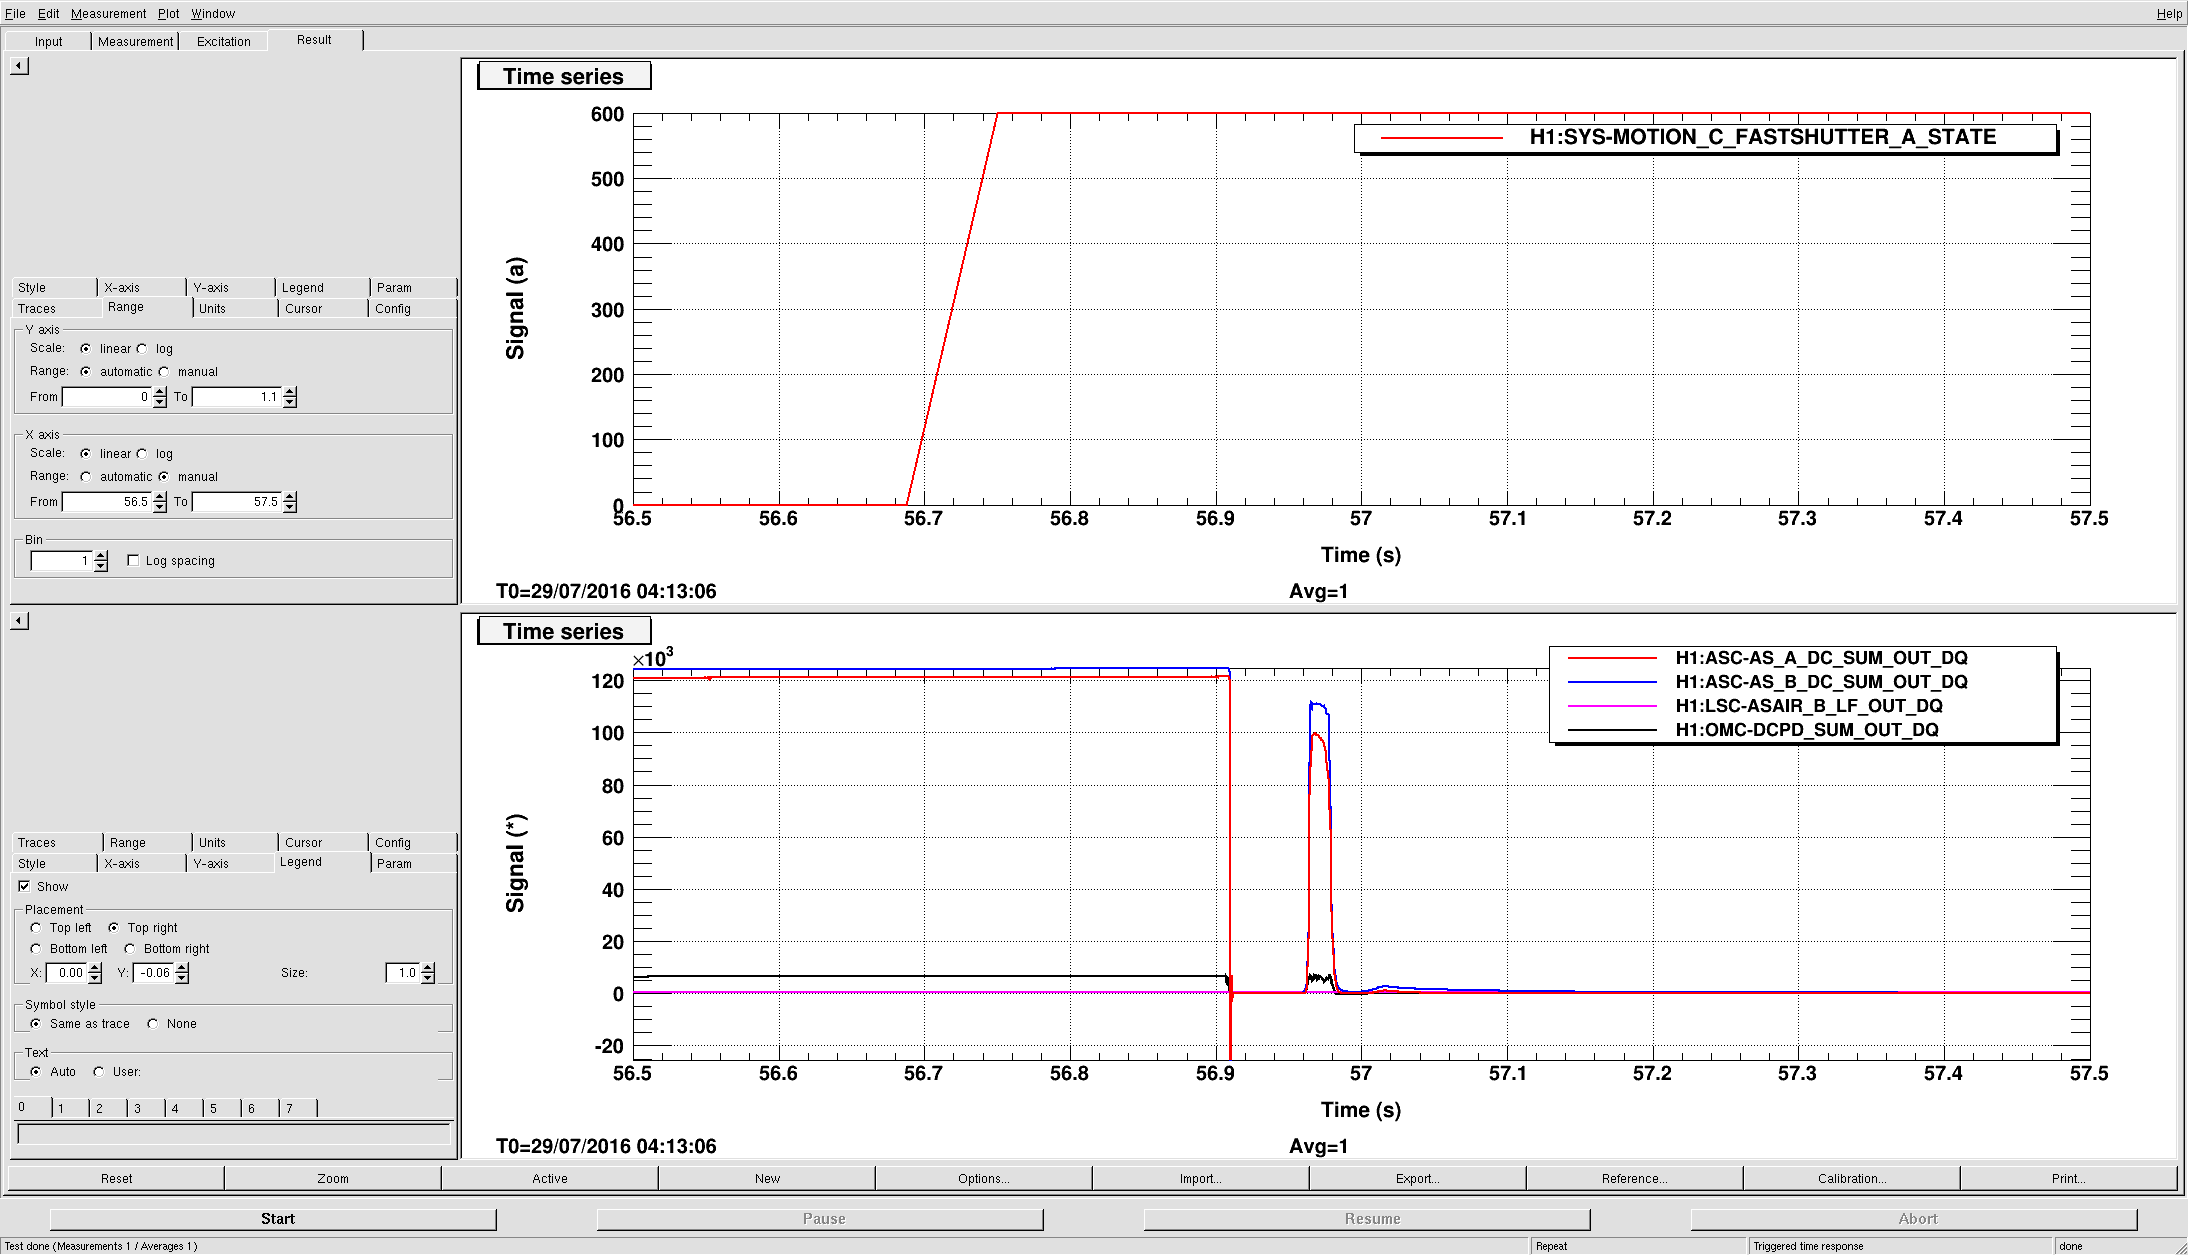
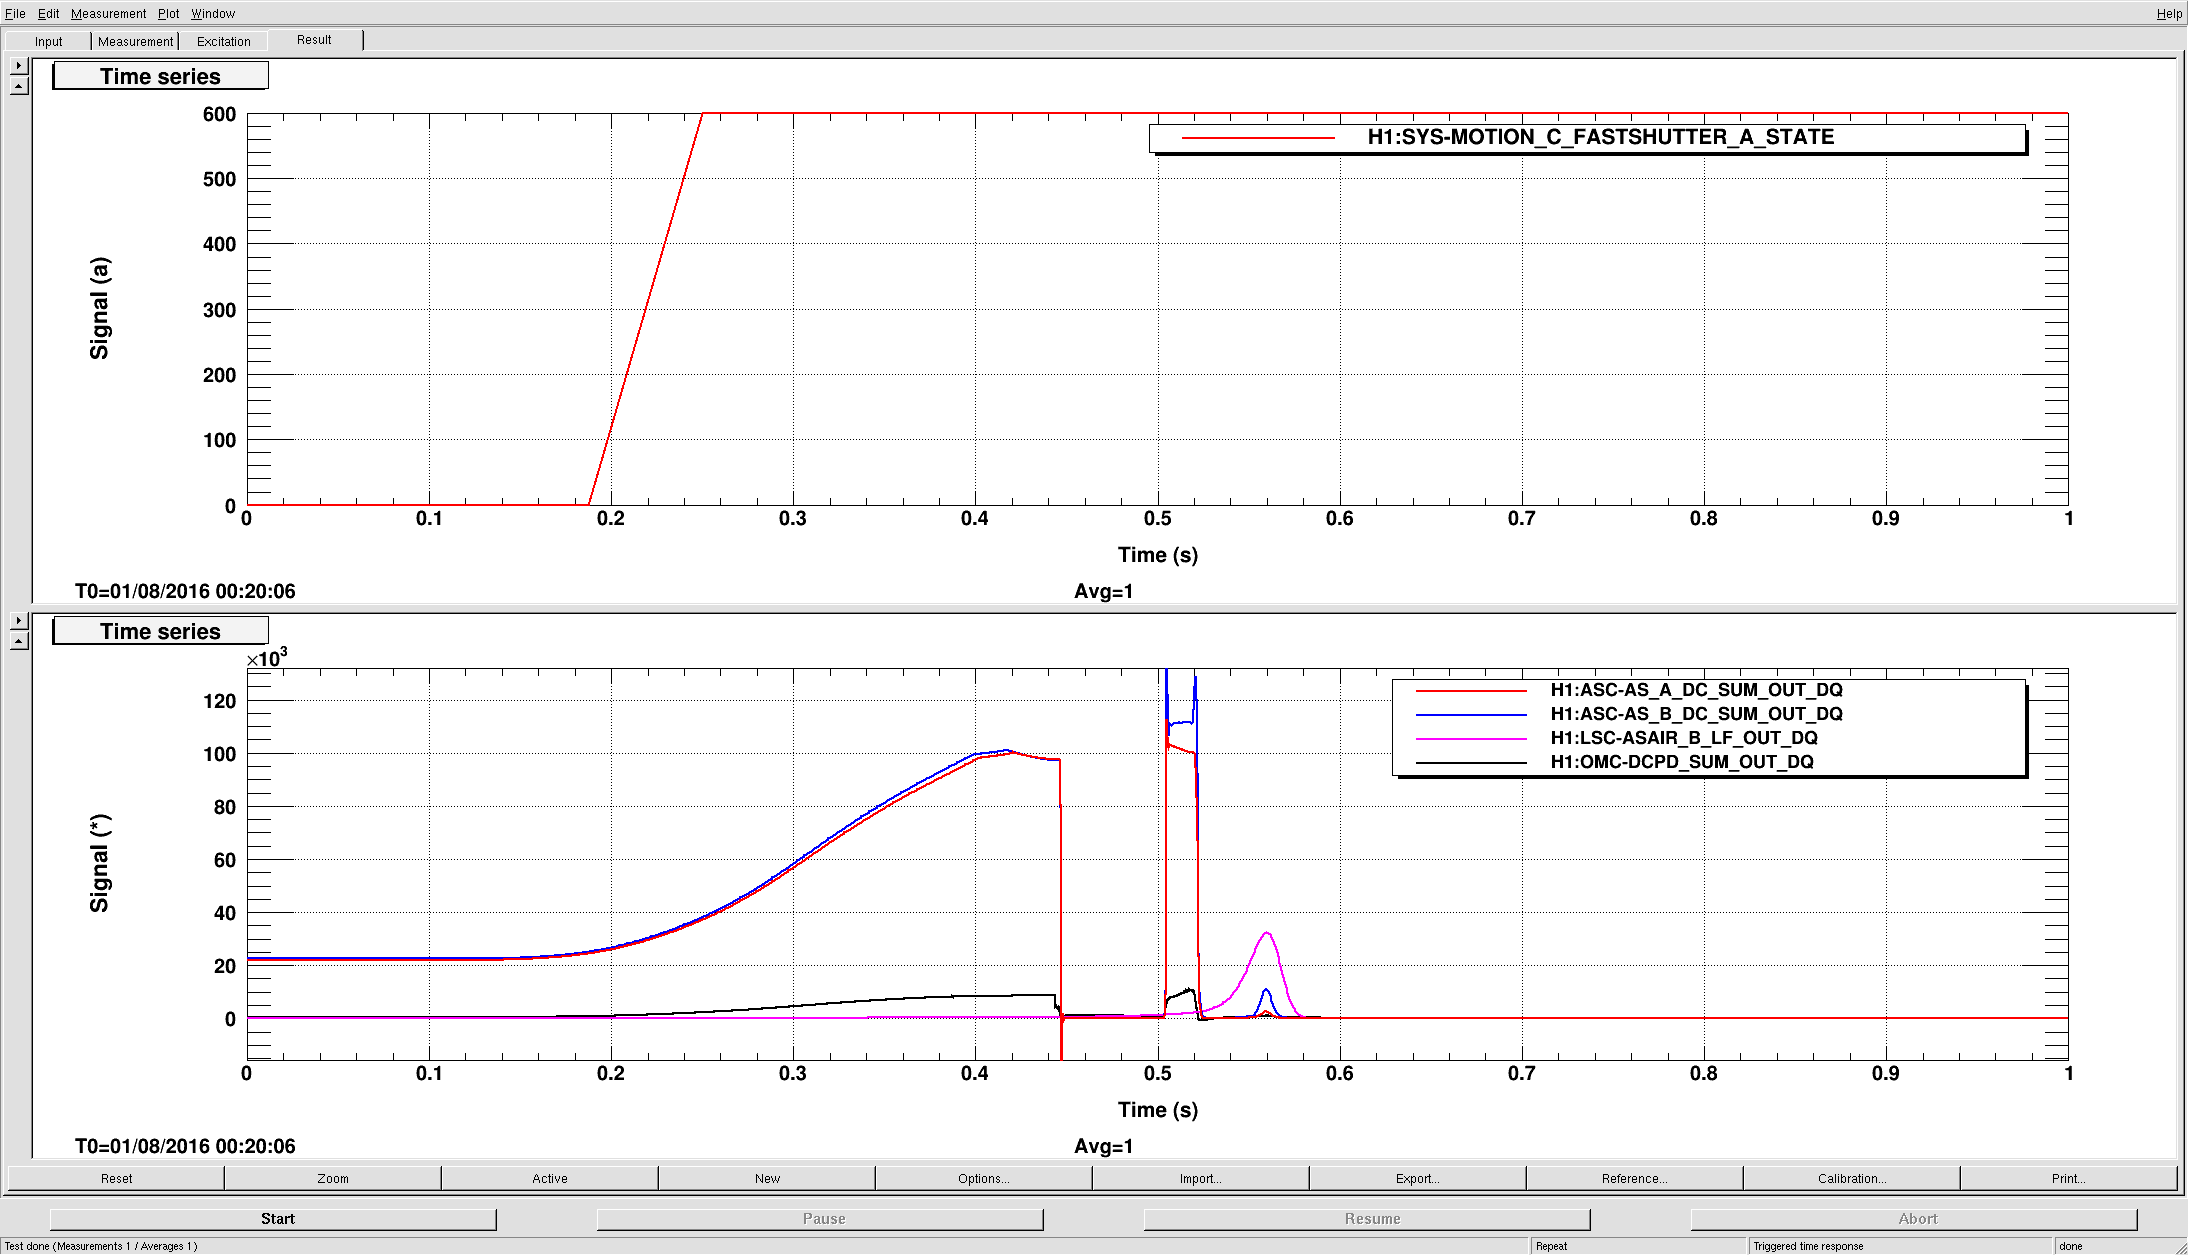
- We turned on the PZT HV and scanned the PZT2 voltage. We confirmed that the OMC DCPDA and DCPDB were observing the OMC flahses.
Optical path check
- Main path: The spot positions on OM1/2/3 were checked. They looked fine.
- Shutter path: The mechanical shutter path was checked. It is still nicely aligned.
- OM1 trans path: The beam alignment in the OM1 transmission was checked. They looked fine. We still need to check the AS AIR viewport path with the viewport emulator.
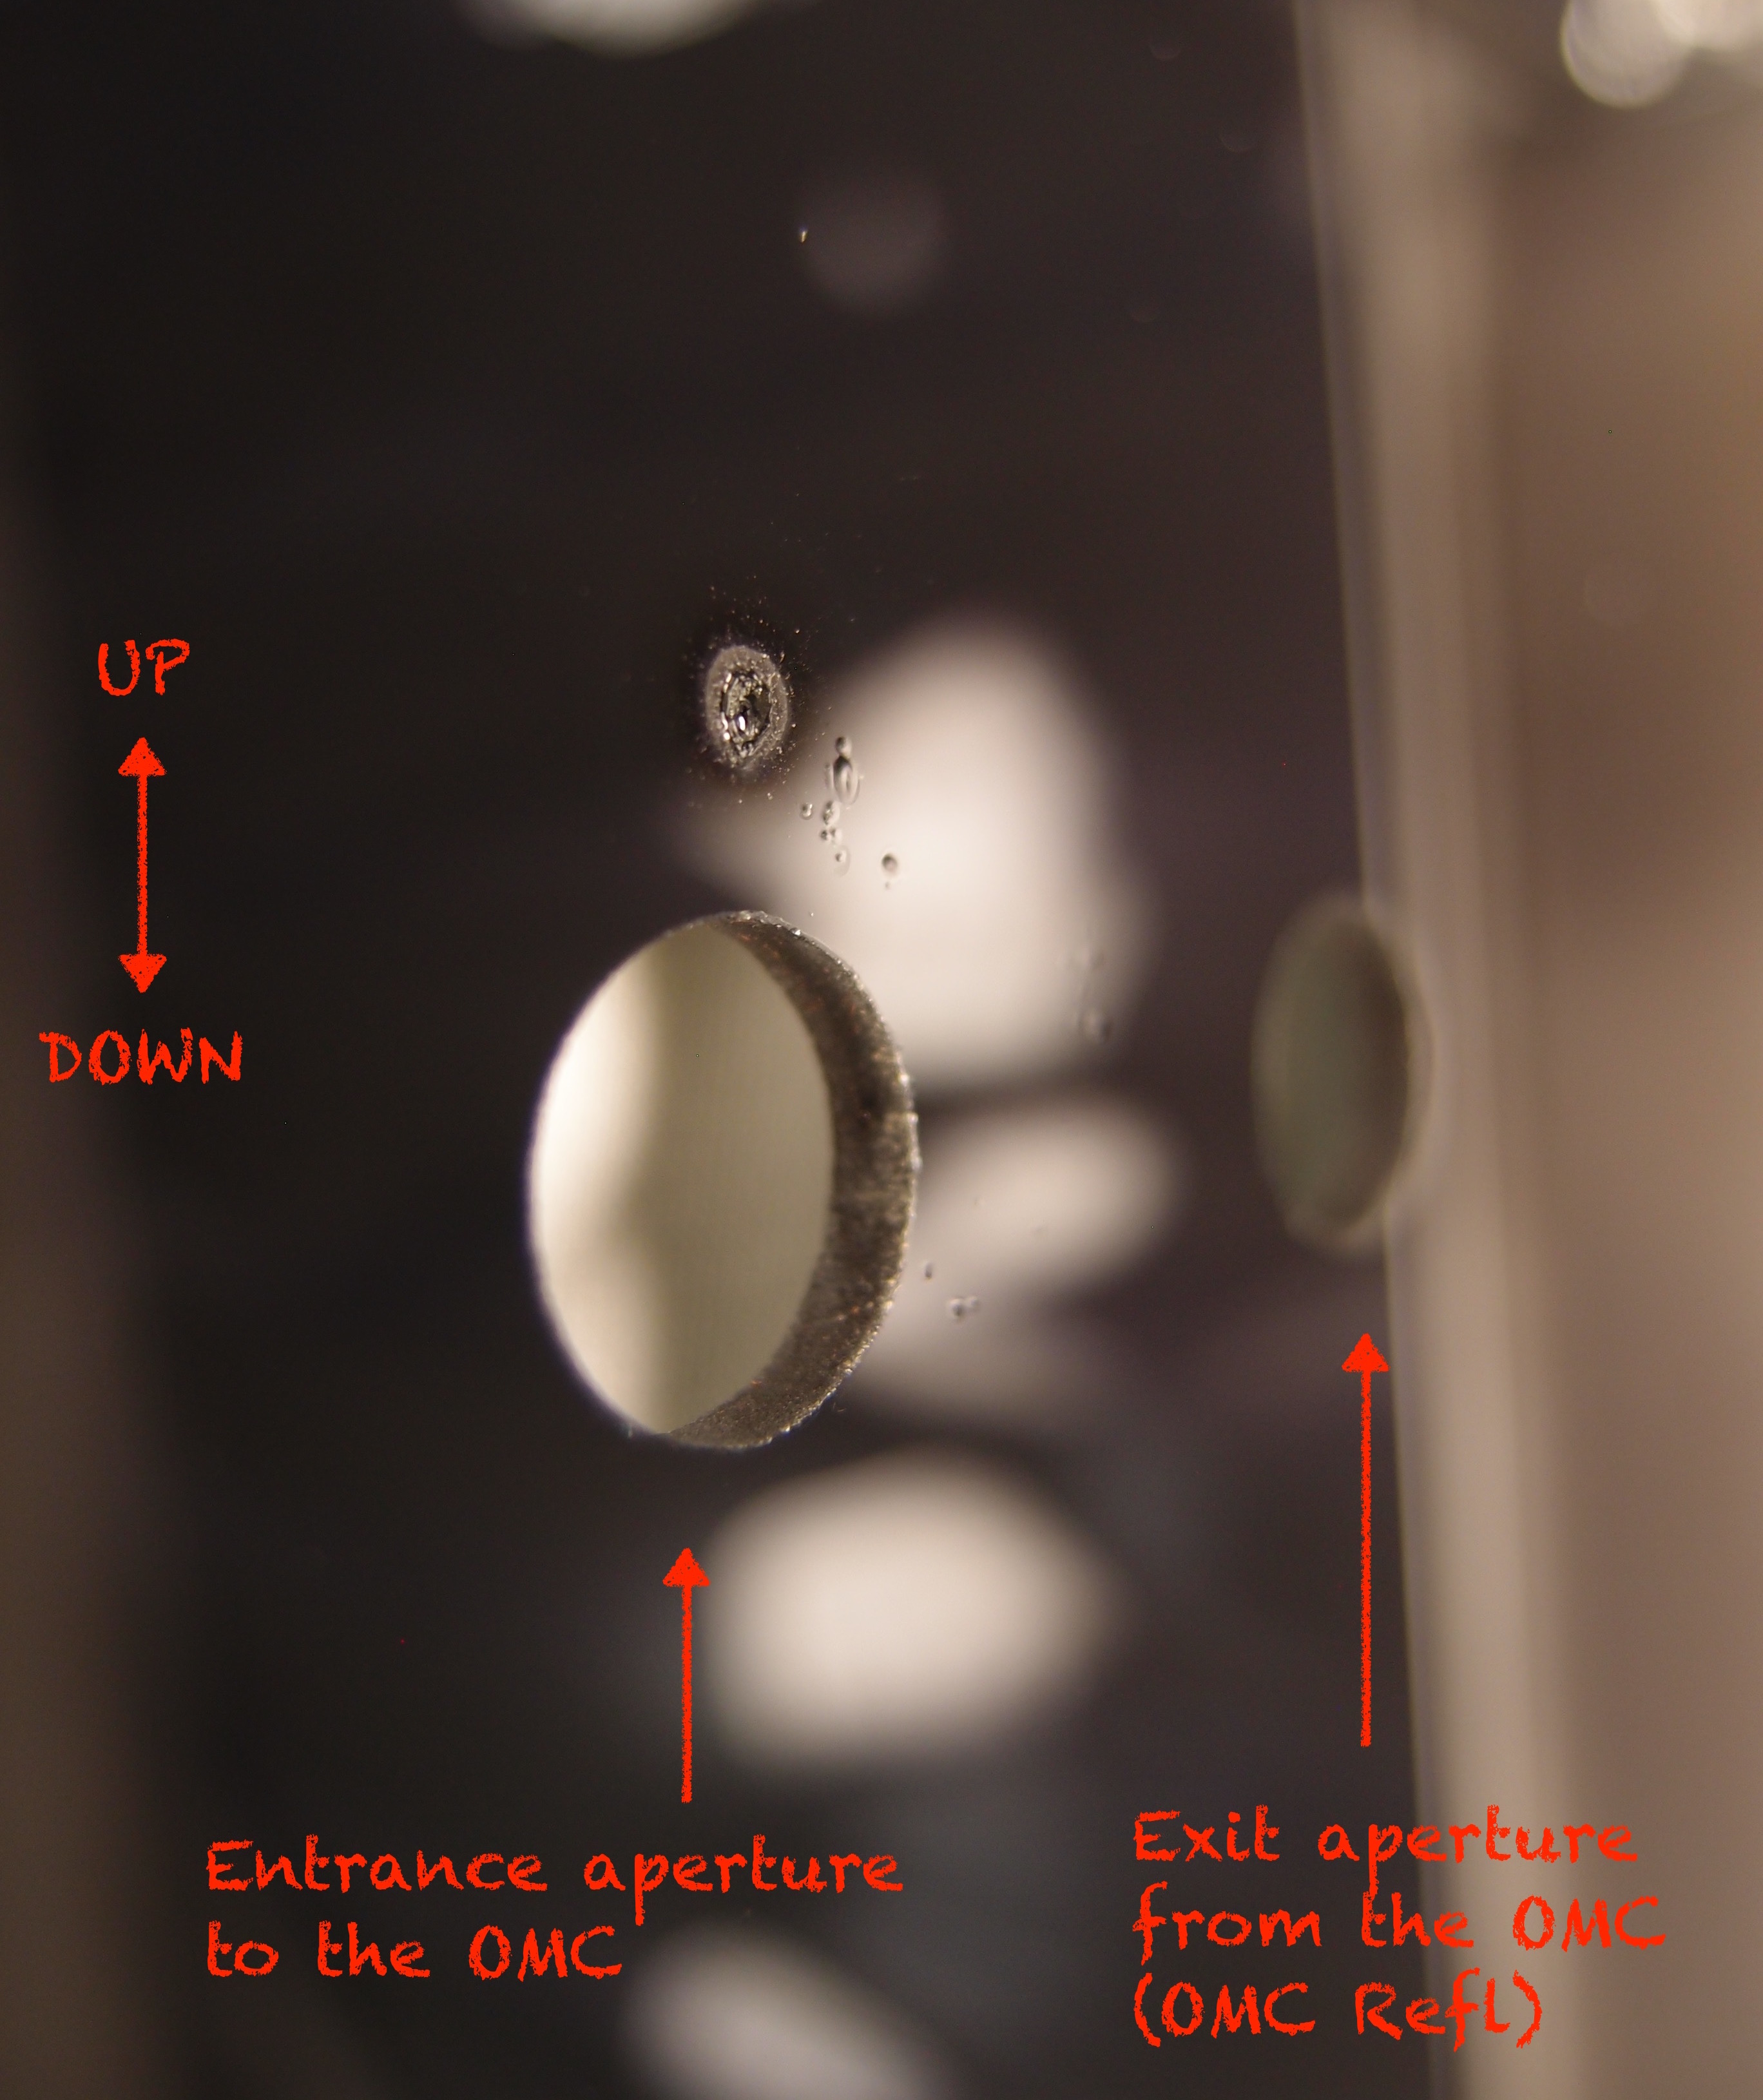
- OMCR path: The beam spots on the OMCR steering mirrors were checked. The beam was not on the center of the steering mirrors. The first steering mirror (so-called M8) in the OMCR path was moved. The reflection path for 90:10 BS and the beam diverter path was checked. They looked just fine. M10 and M11 were used to align the spots on the OMCR QPDs. We didn't use M9 this time. We'll check this path again once the viewport emulator is attached on the chamber tomorrow.
- WFS path / OMCT path: We will work on these paths tomorrow.
Next steps
- Restore OMC blackglass shroud if the OMCS TFs look OK.
- Restore OMCT steering mirror
- Place the viewport emulator
- Confirm spot locations on the viewport
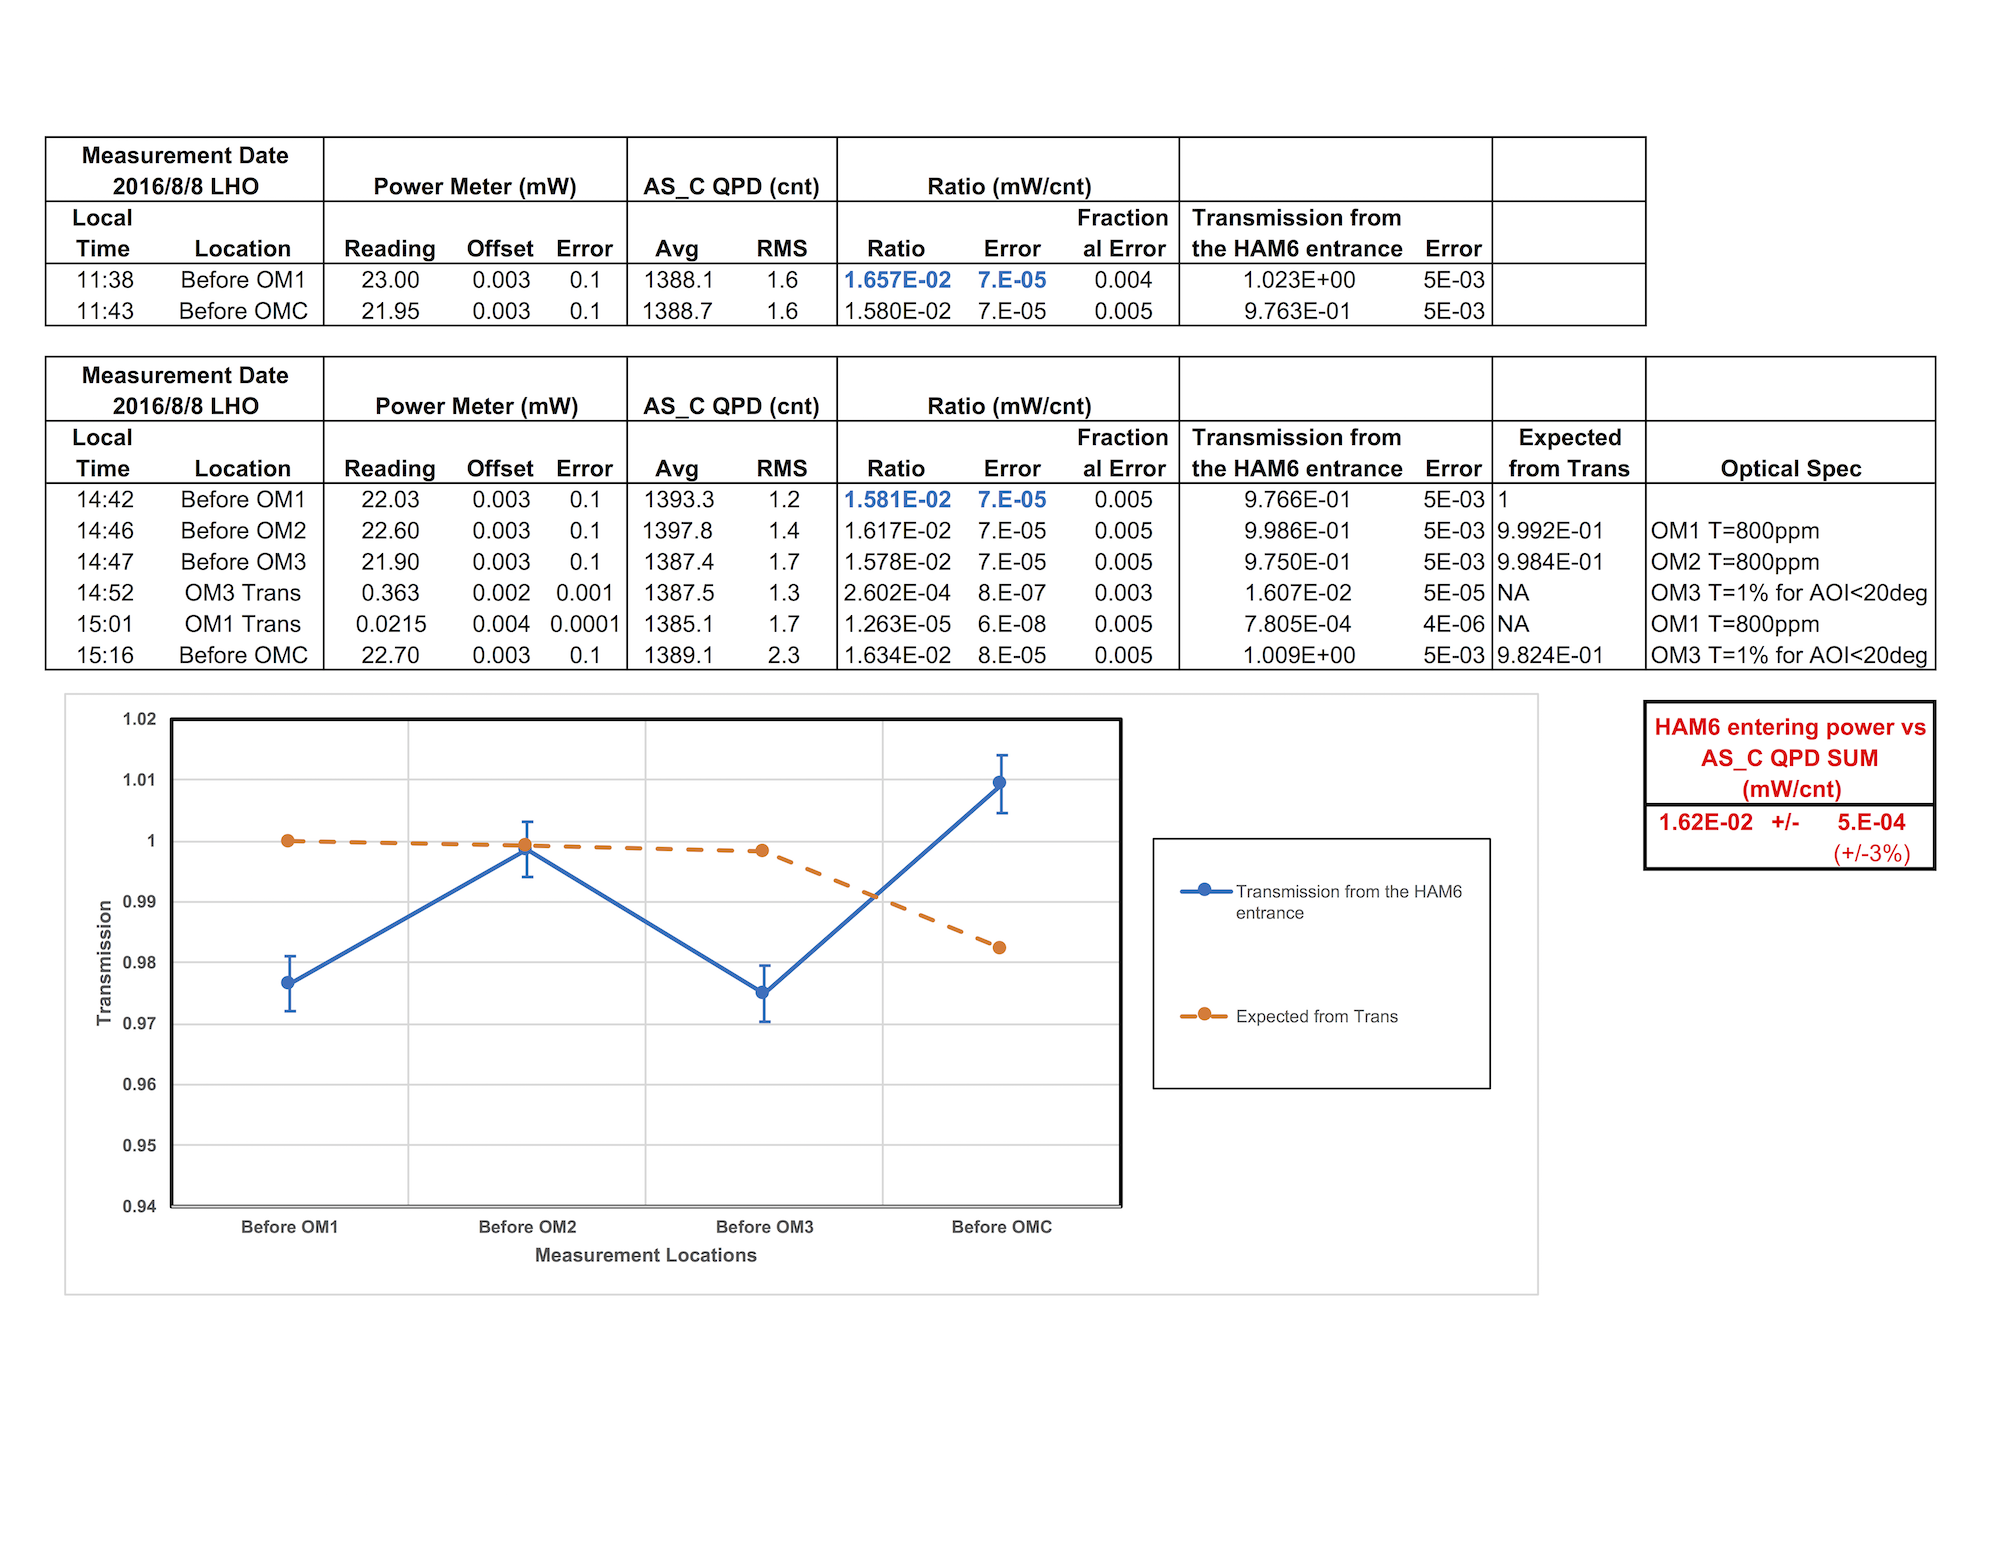
- We want to check the calibration between AS_C QPD SUM, the incident power on OM1, and the incident power on the OMC breadboard.
- Ground loop check
- Other SUS/SEI exit check