Summary:
High power beam path in HAM6 was carefully inspected using flashlights and so-called green lanterns. Some of the OMC shroud panels were removed and the OMC was pulled out of the chamber.
Some damages and contaminations were found.
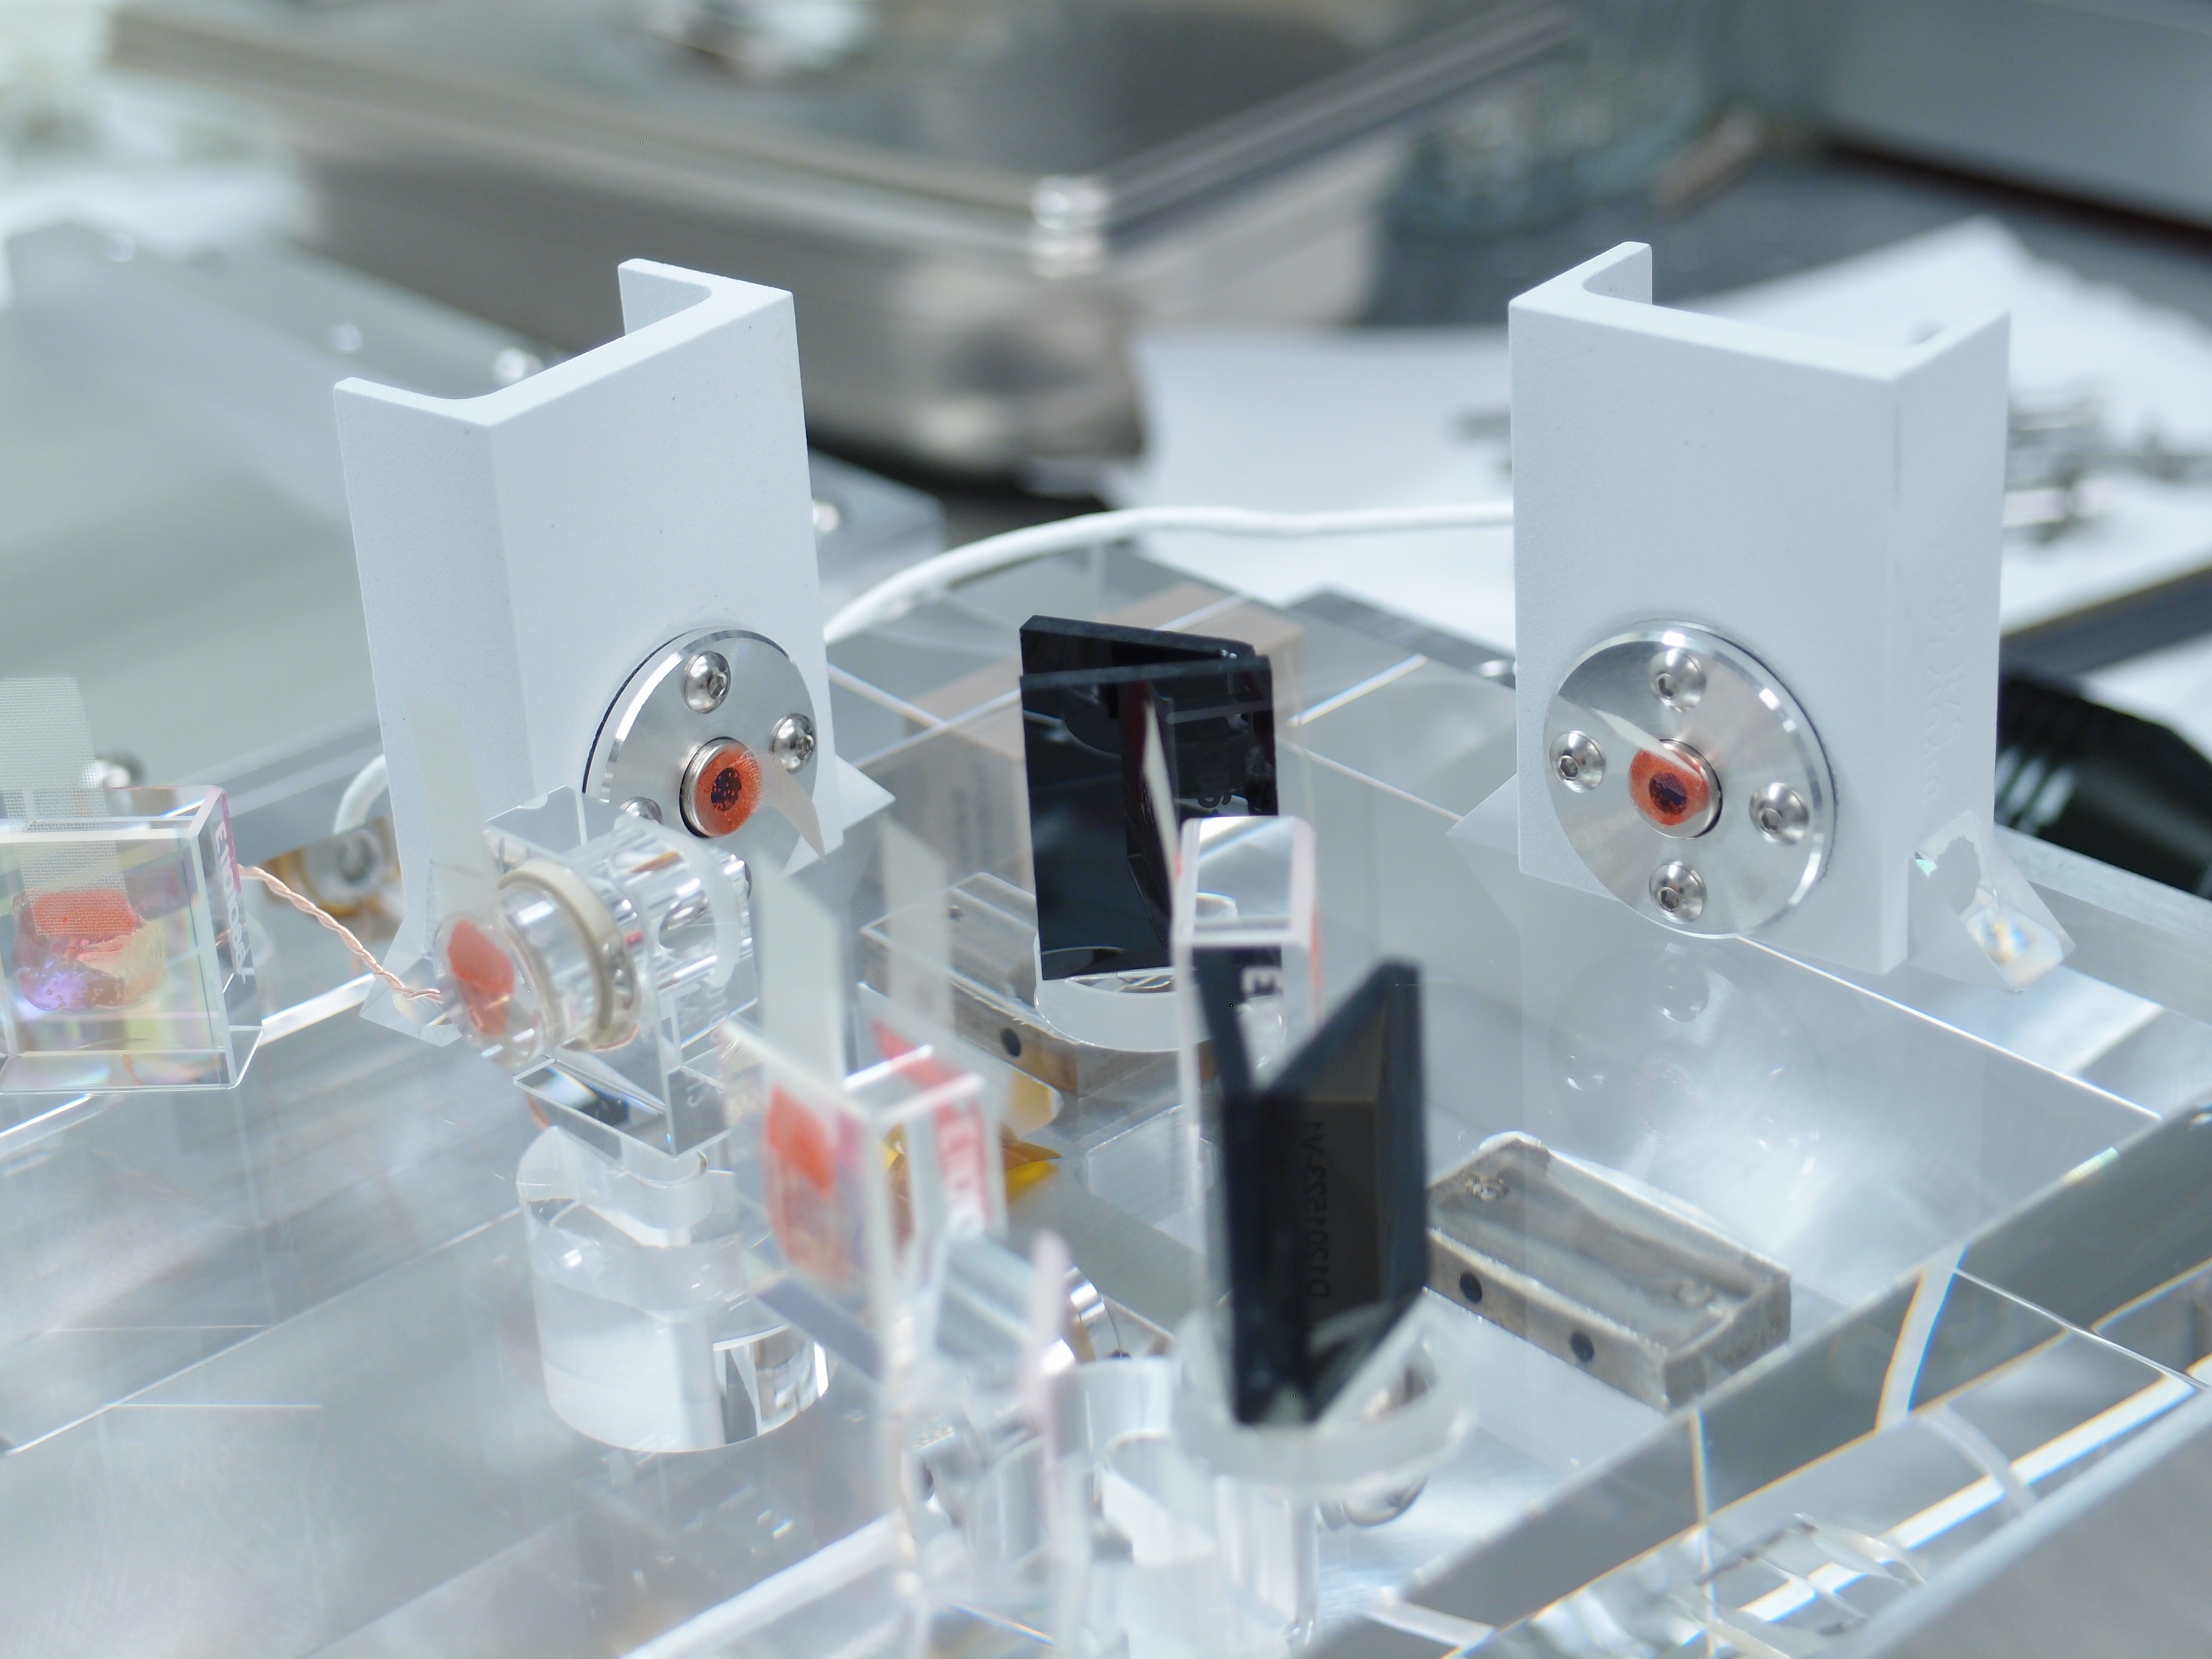
- One of the OMC cavity mirrors on PZT was found to have a large defect very close the center. From the picture it seems as if the defect is a ring or a disk, the size of which is comparable to that of the beam. Hopefully this is the main cause of our problem.
- OMC TRANS steering mirror had a big particulate at around the center. This might have made the OMC trans video look worse.
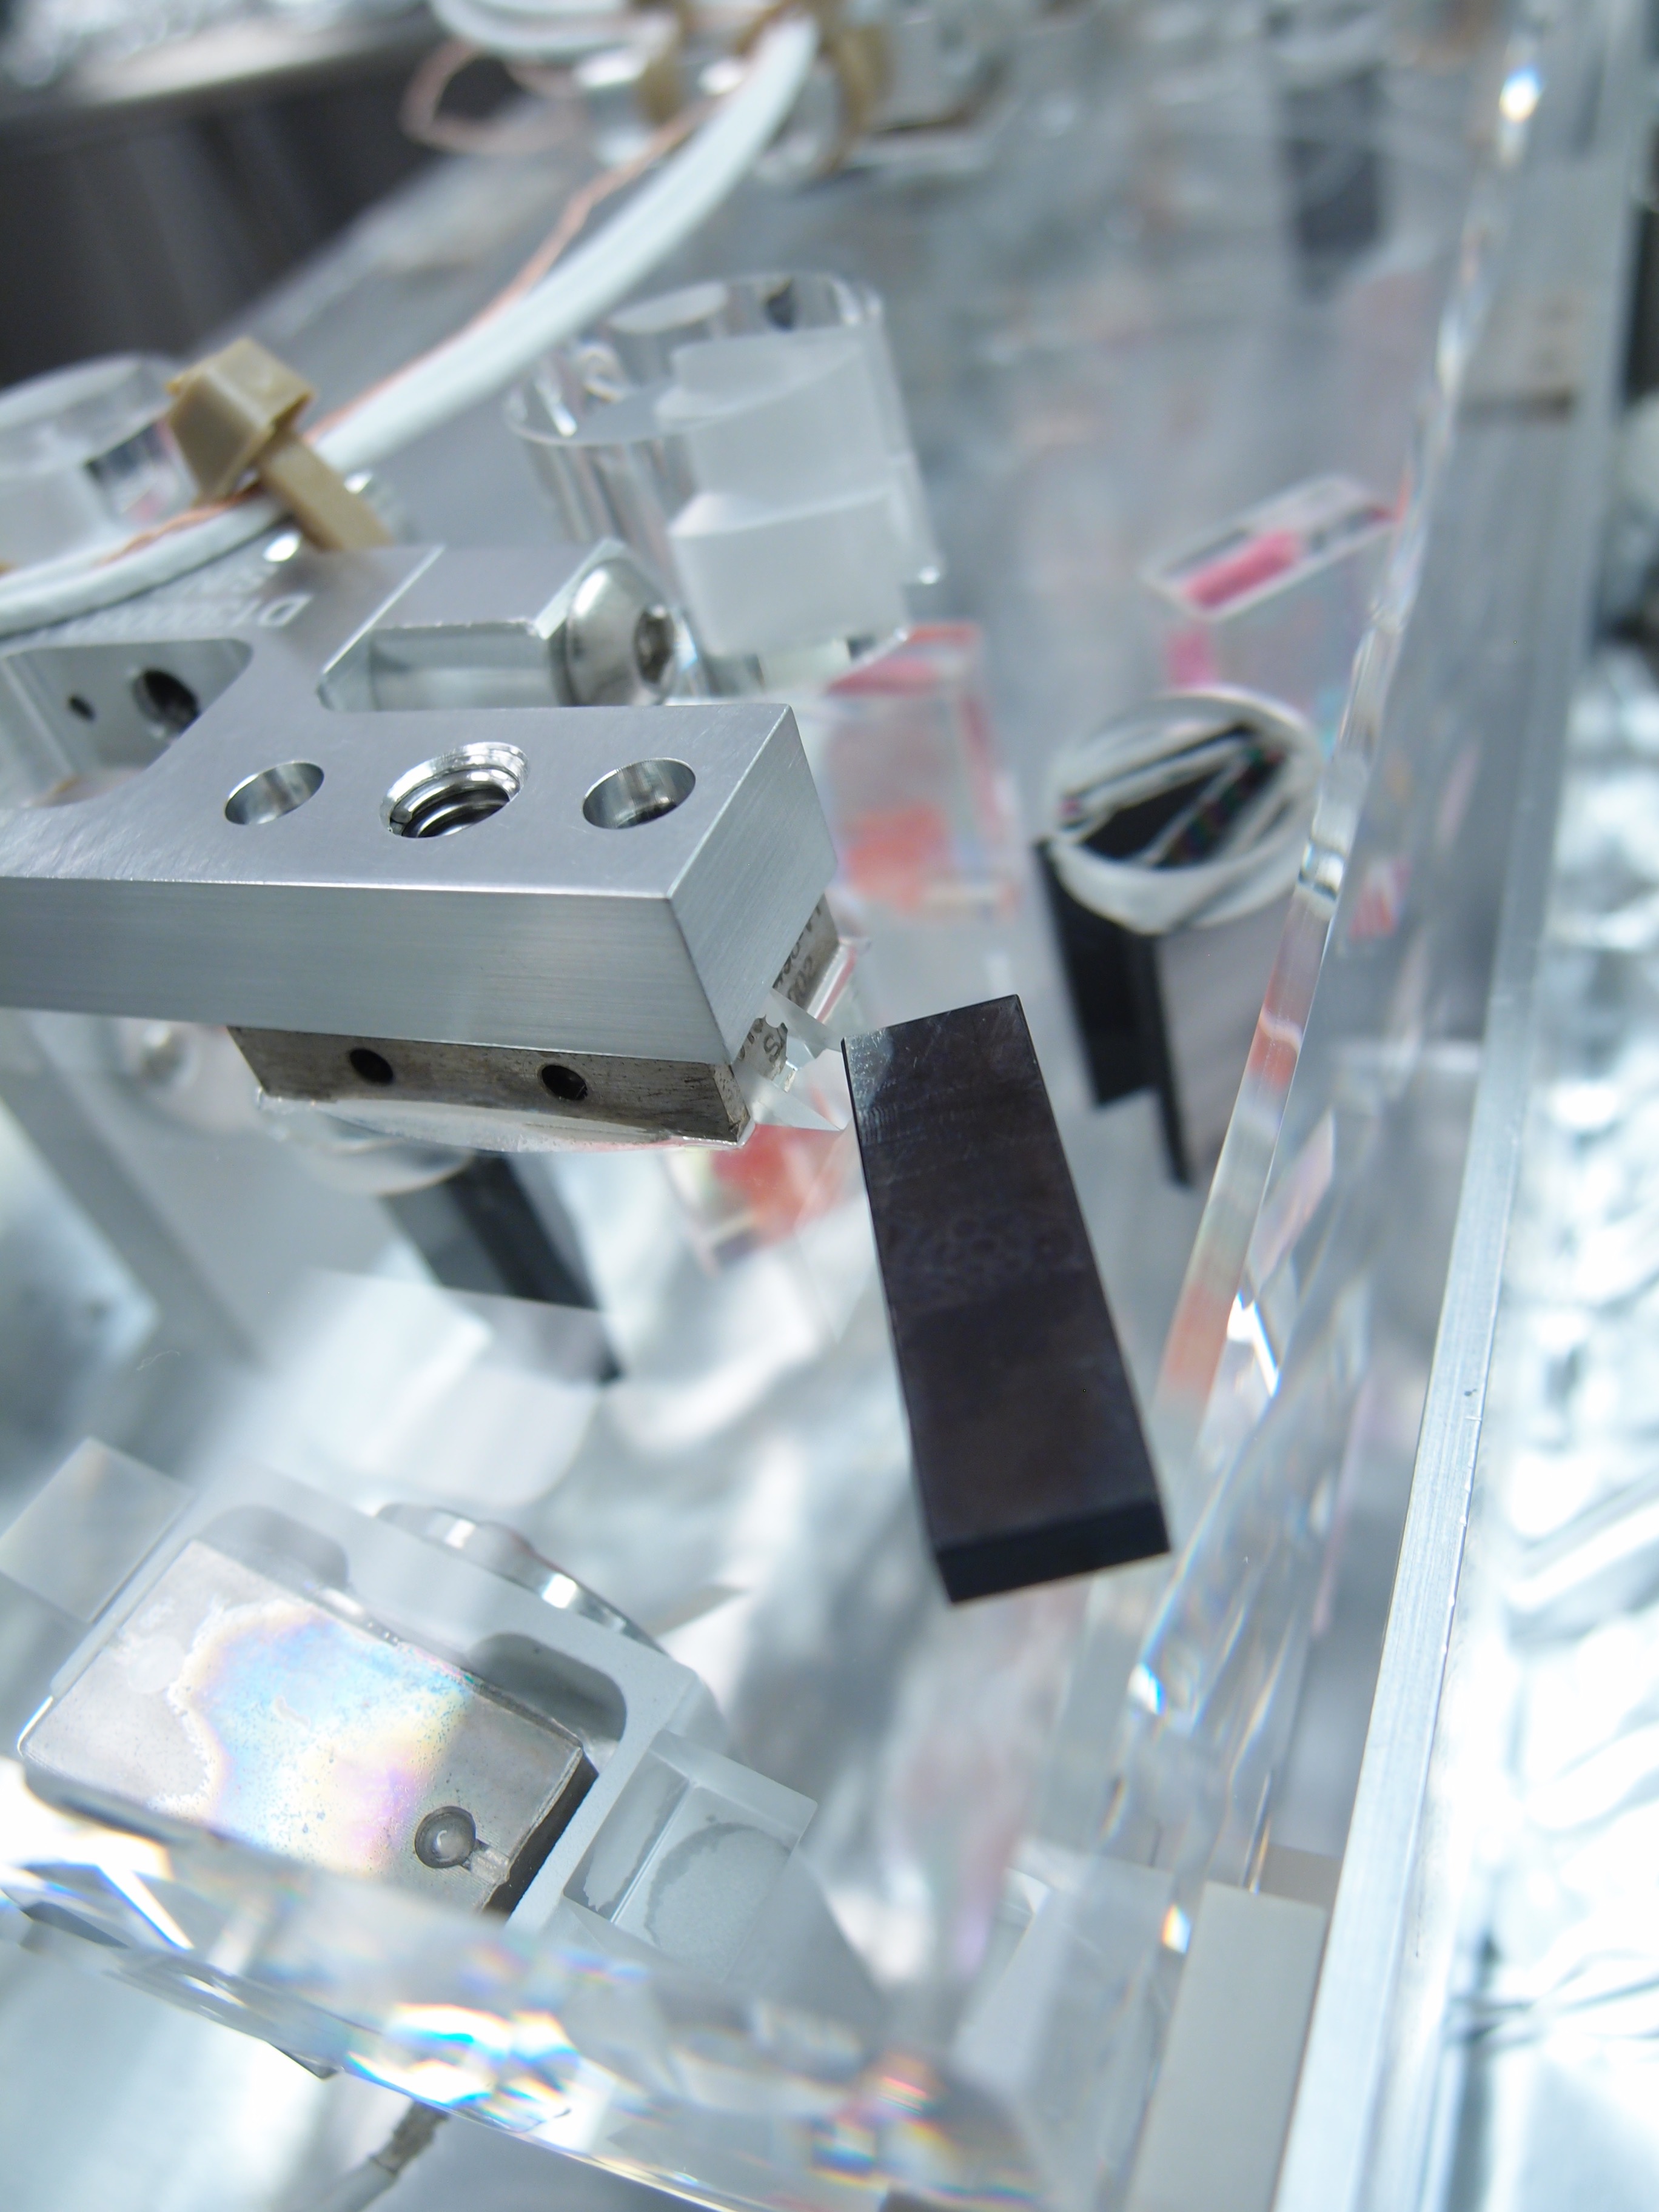
- A big crater in one of the black glass panels for the V-shaped beam dump receiving the beam diverter reflection of the OMC REFL. The other panel had the evaporated glass "coated" all over.
- Much smaller, but obvious, damage on another V-shaped beam dump that receives the reflection of 90:10 BS downstream of the beam diverter.
- A crater above the entrance beam hole for the OMC shroud. It seems as if some large power came out of SRM when OMs were totally misaligned in PIT.
HAM6 didn't look particularly clean, there were some particulates on OM mirrors for example but they were all far from the center.
Note that all of the above except 2. could have been prevented if the fast shutter was working.
No other problem was identified.
Corey will post some of the pictures.
Fixing things:
We will proceed to replace the OMC as planned.
OMC TRANS steering mirror was removed from the Siskiyou mirror holder, particulate was removed on the table using Top Gun, and First Contact was applied. Later the mirror will be installed back in the mirror holder. This way we don't need to worry about the alignment.
V-dump glasses were replaced on the spot.
We might replace the damaged shroud panel if we have a new one and if the cleaning can be done fast, otherwise we might just leave it there.
Other things to note:
We also visually inspected low-power beam path and found nothing suspicious.
AS for the OMC mirror damage, speculation of me and Koji is that we had a particulate contamination of some kind when the large power hit the OMC as the fast shutter was not working.

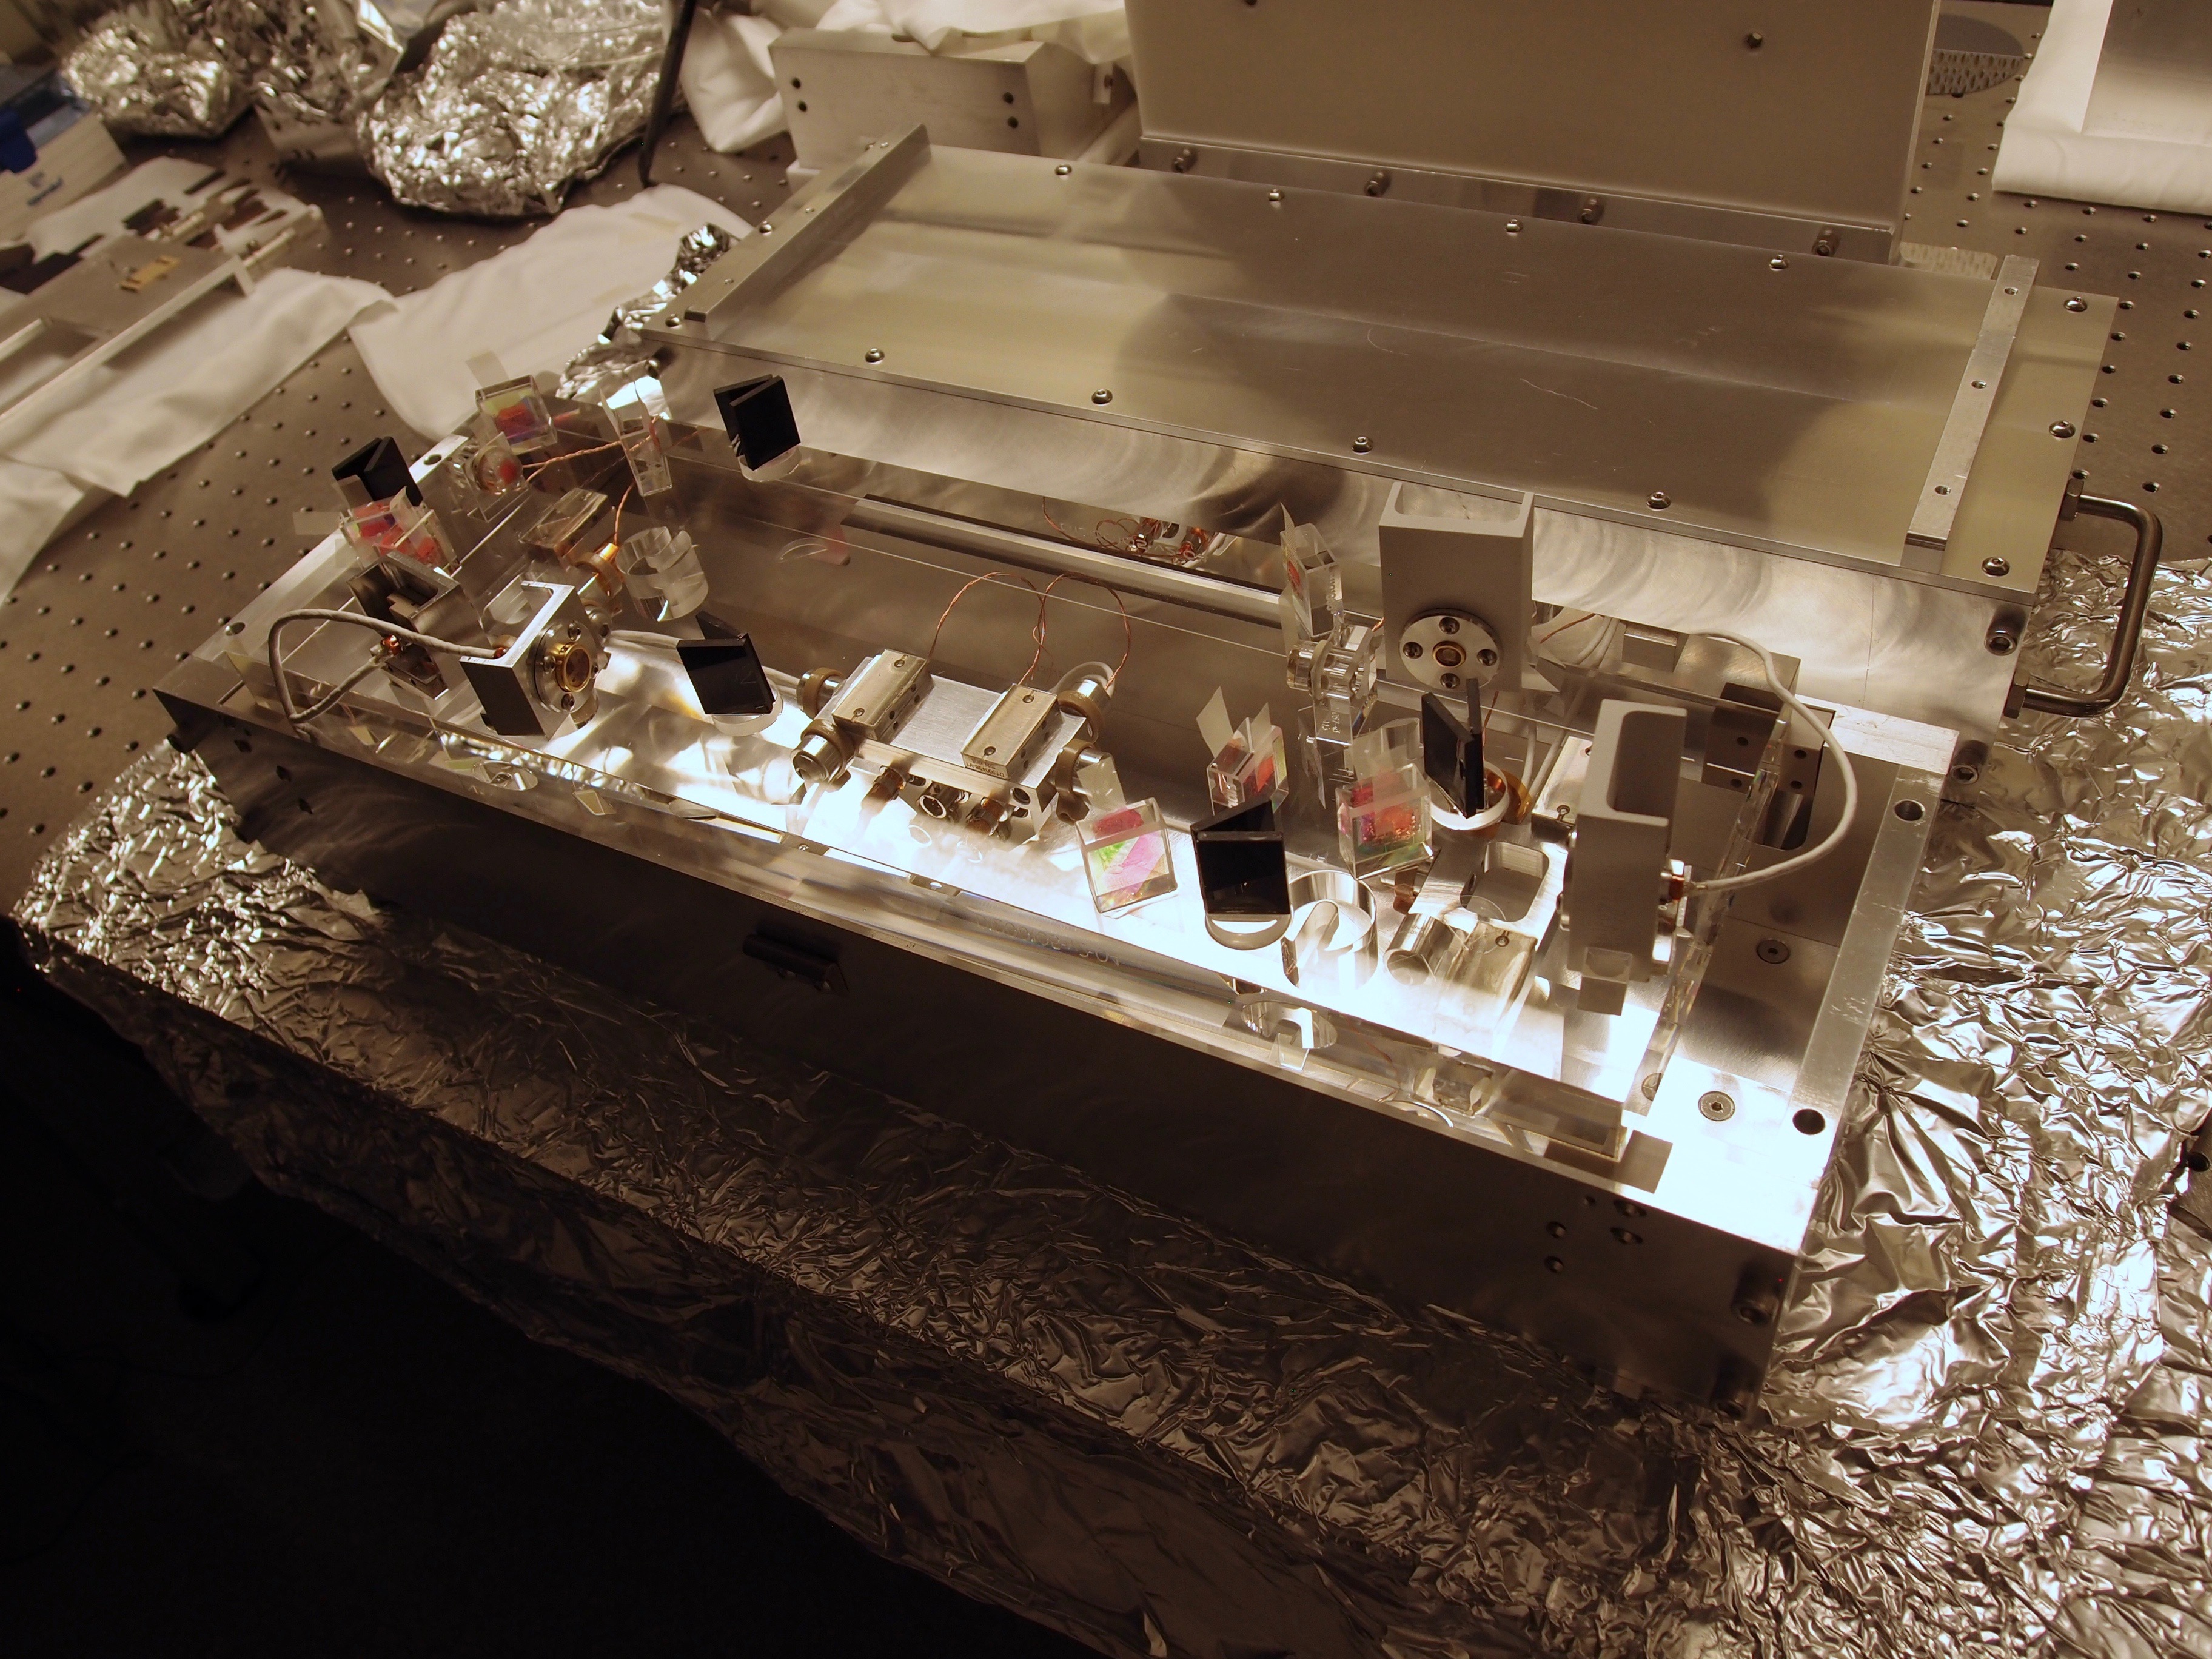
I suppose the better photos from the DSLR are coming. Here is just a low res shot.