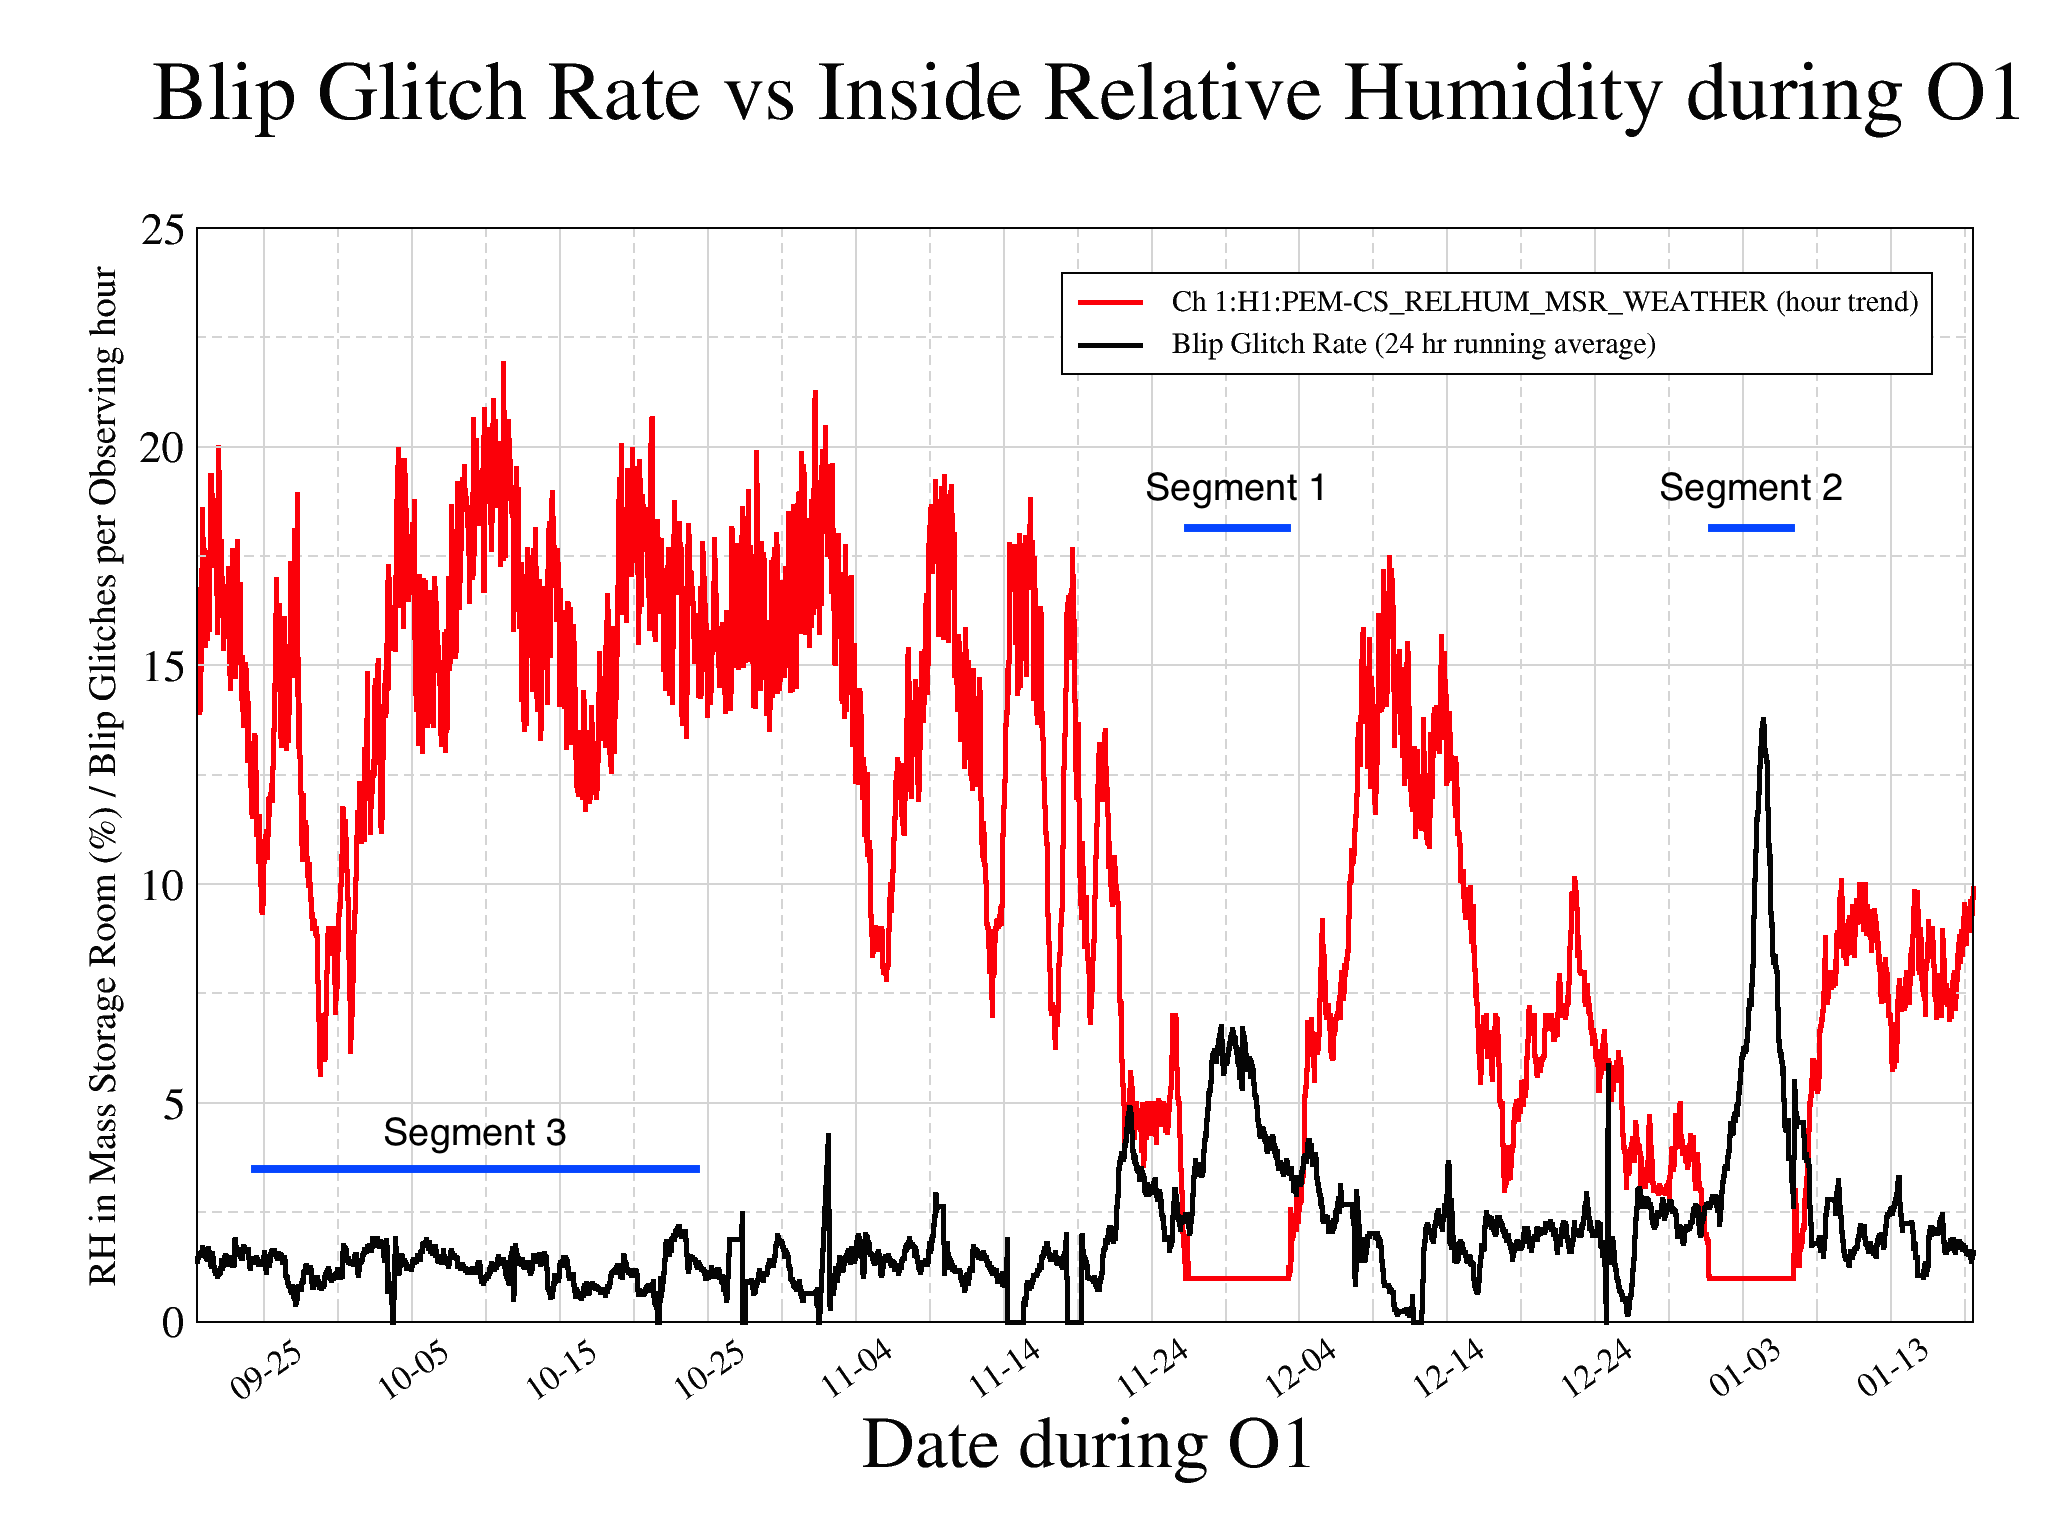
We have been studying the list of blip glitches that Miriam Cabero Müller generated for O1. We noticed that the rate of blip glitches increased dramatically during two time periods, see figure 1. We first checked if the glitch rate might be correlated with outside temperature, in case the blip glitches were produced by beam tube particulate events. The correlation with outside temperature was strong, but, for beam tube particulate, we expected it to be stronger with rate of temperature change than with temperature, and it was not. So we checked relative humidity and found that inside relative humidity was well correlated with outside temperature (and glitch rate), most likely because of the extra heating needed in cold spells. A plot of the blip glitch rate and RH inside the CS mass storage room is attached.
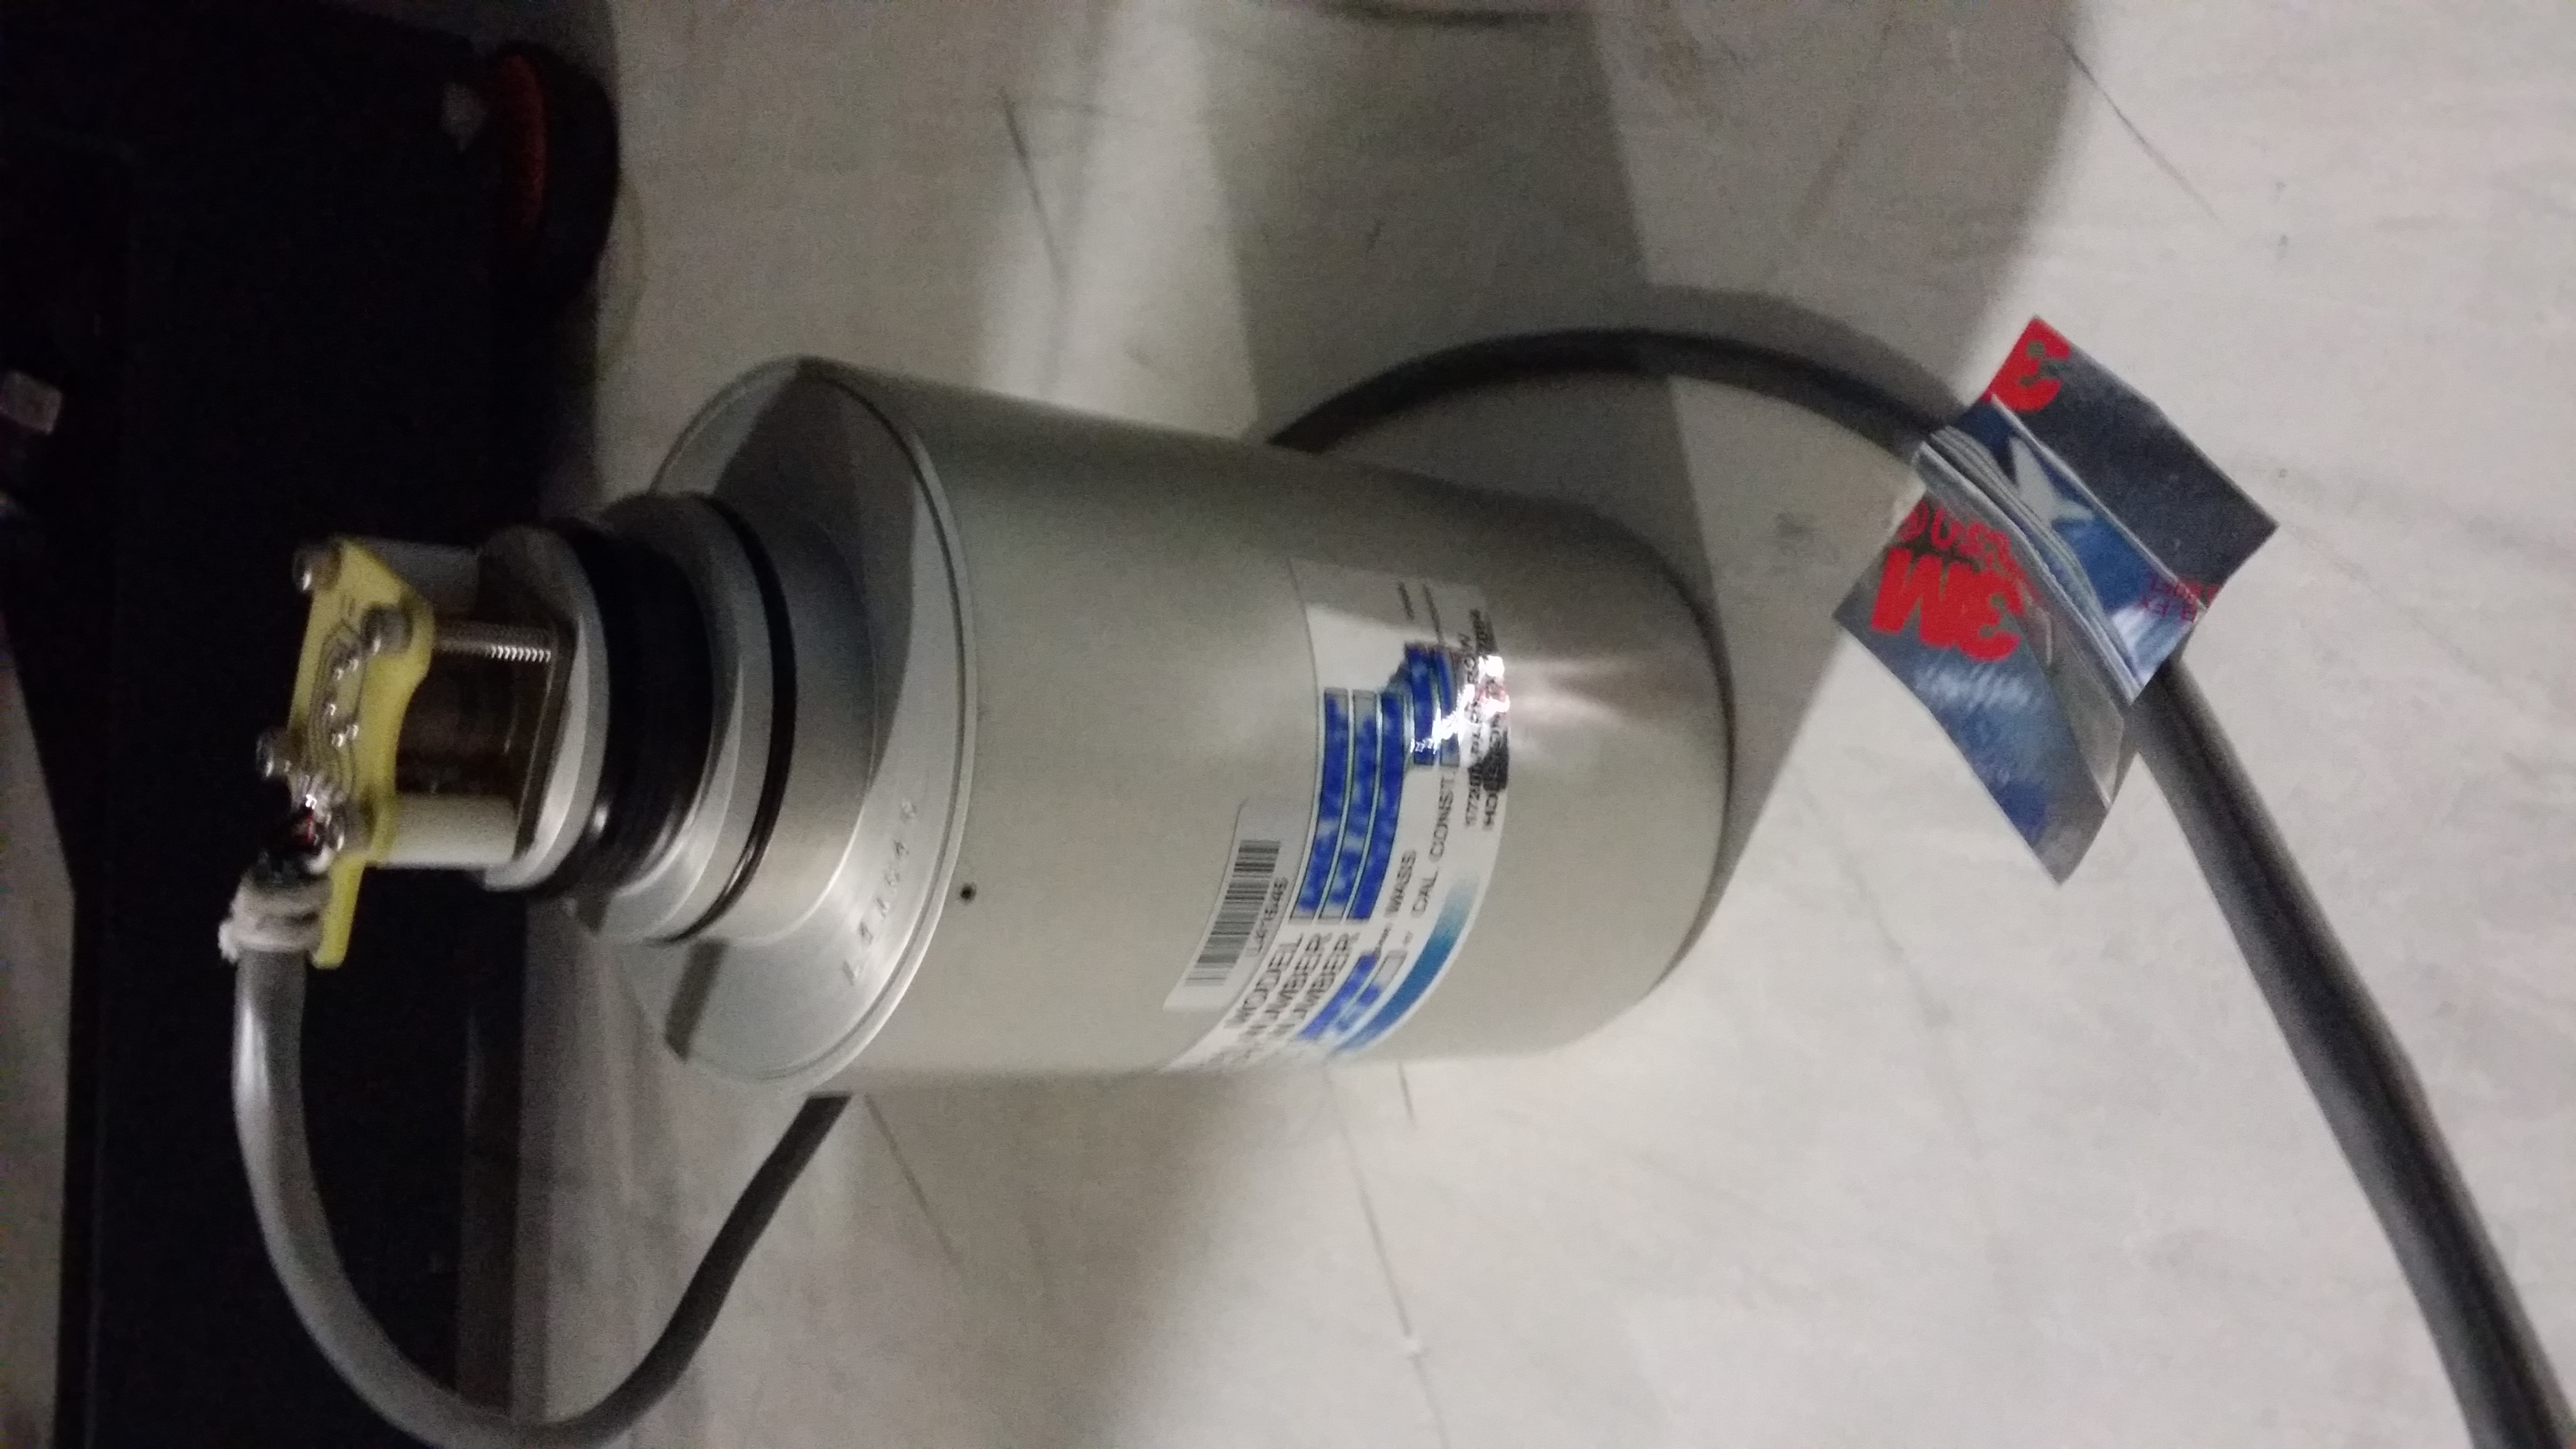
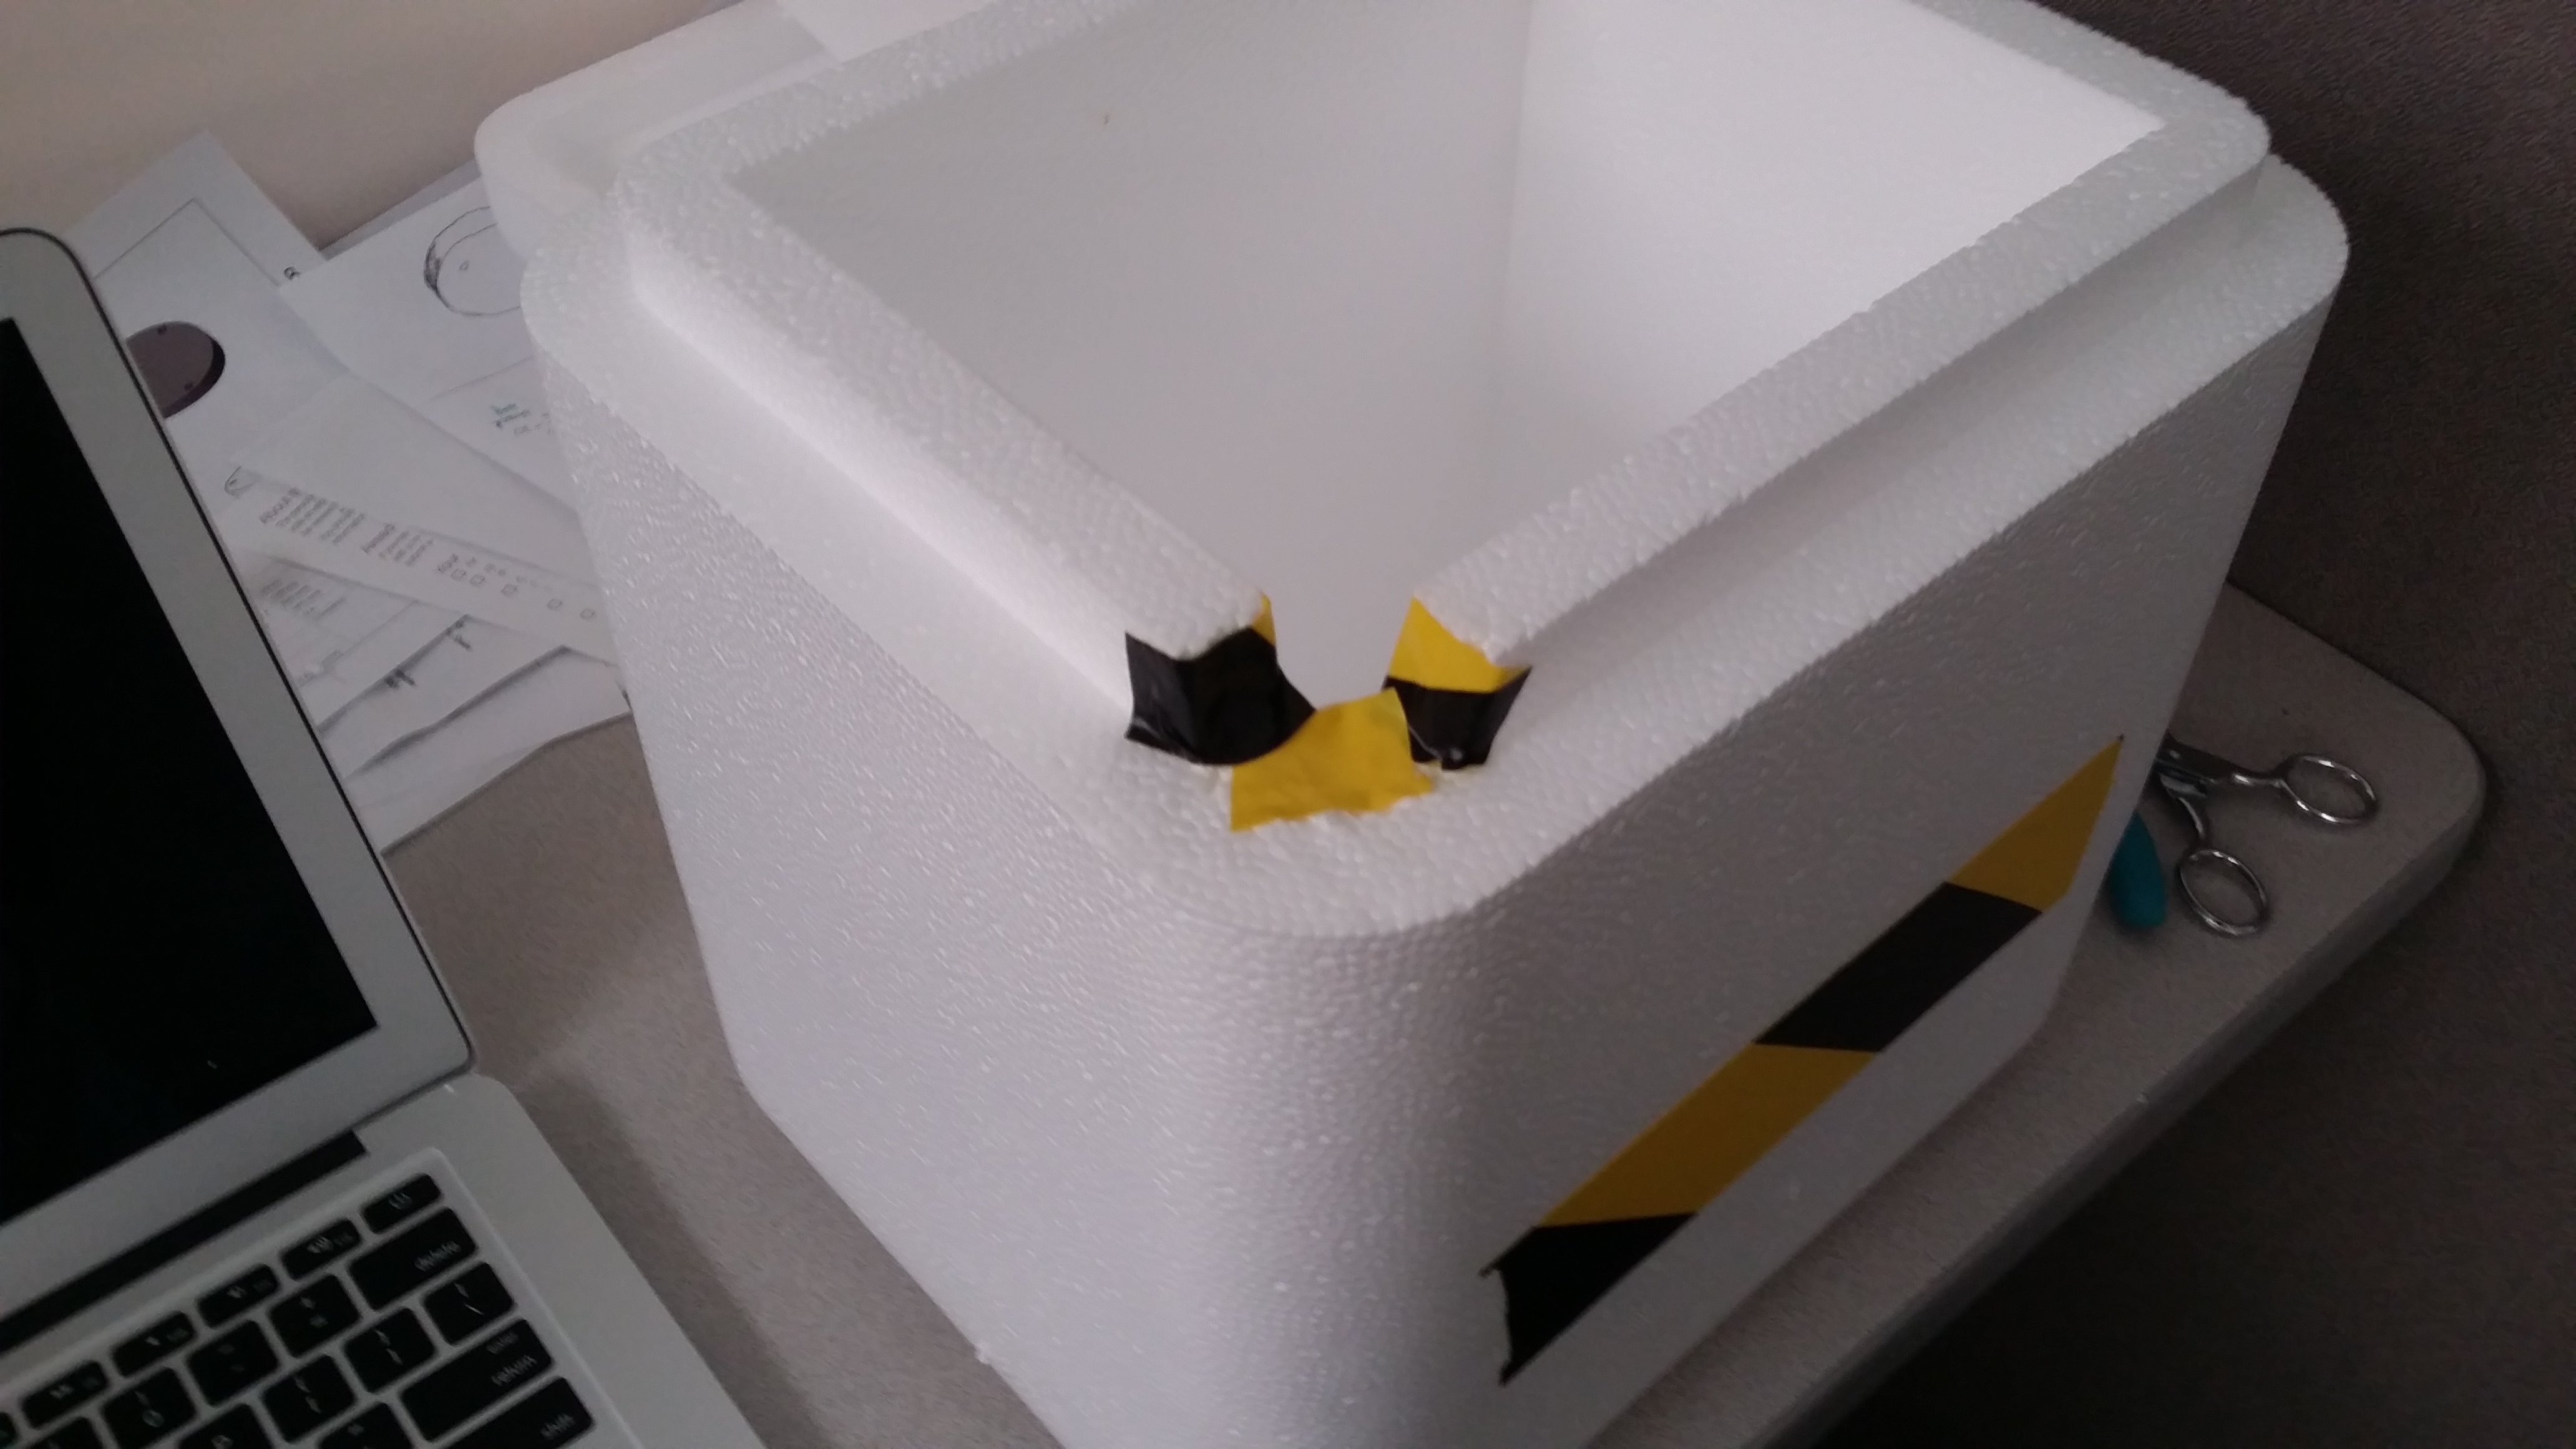
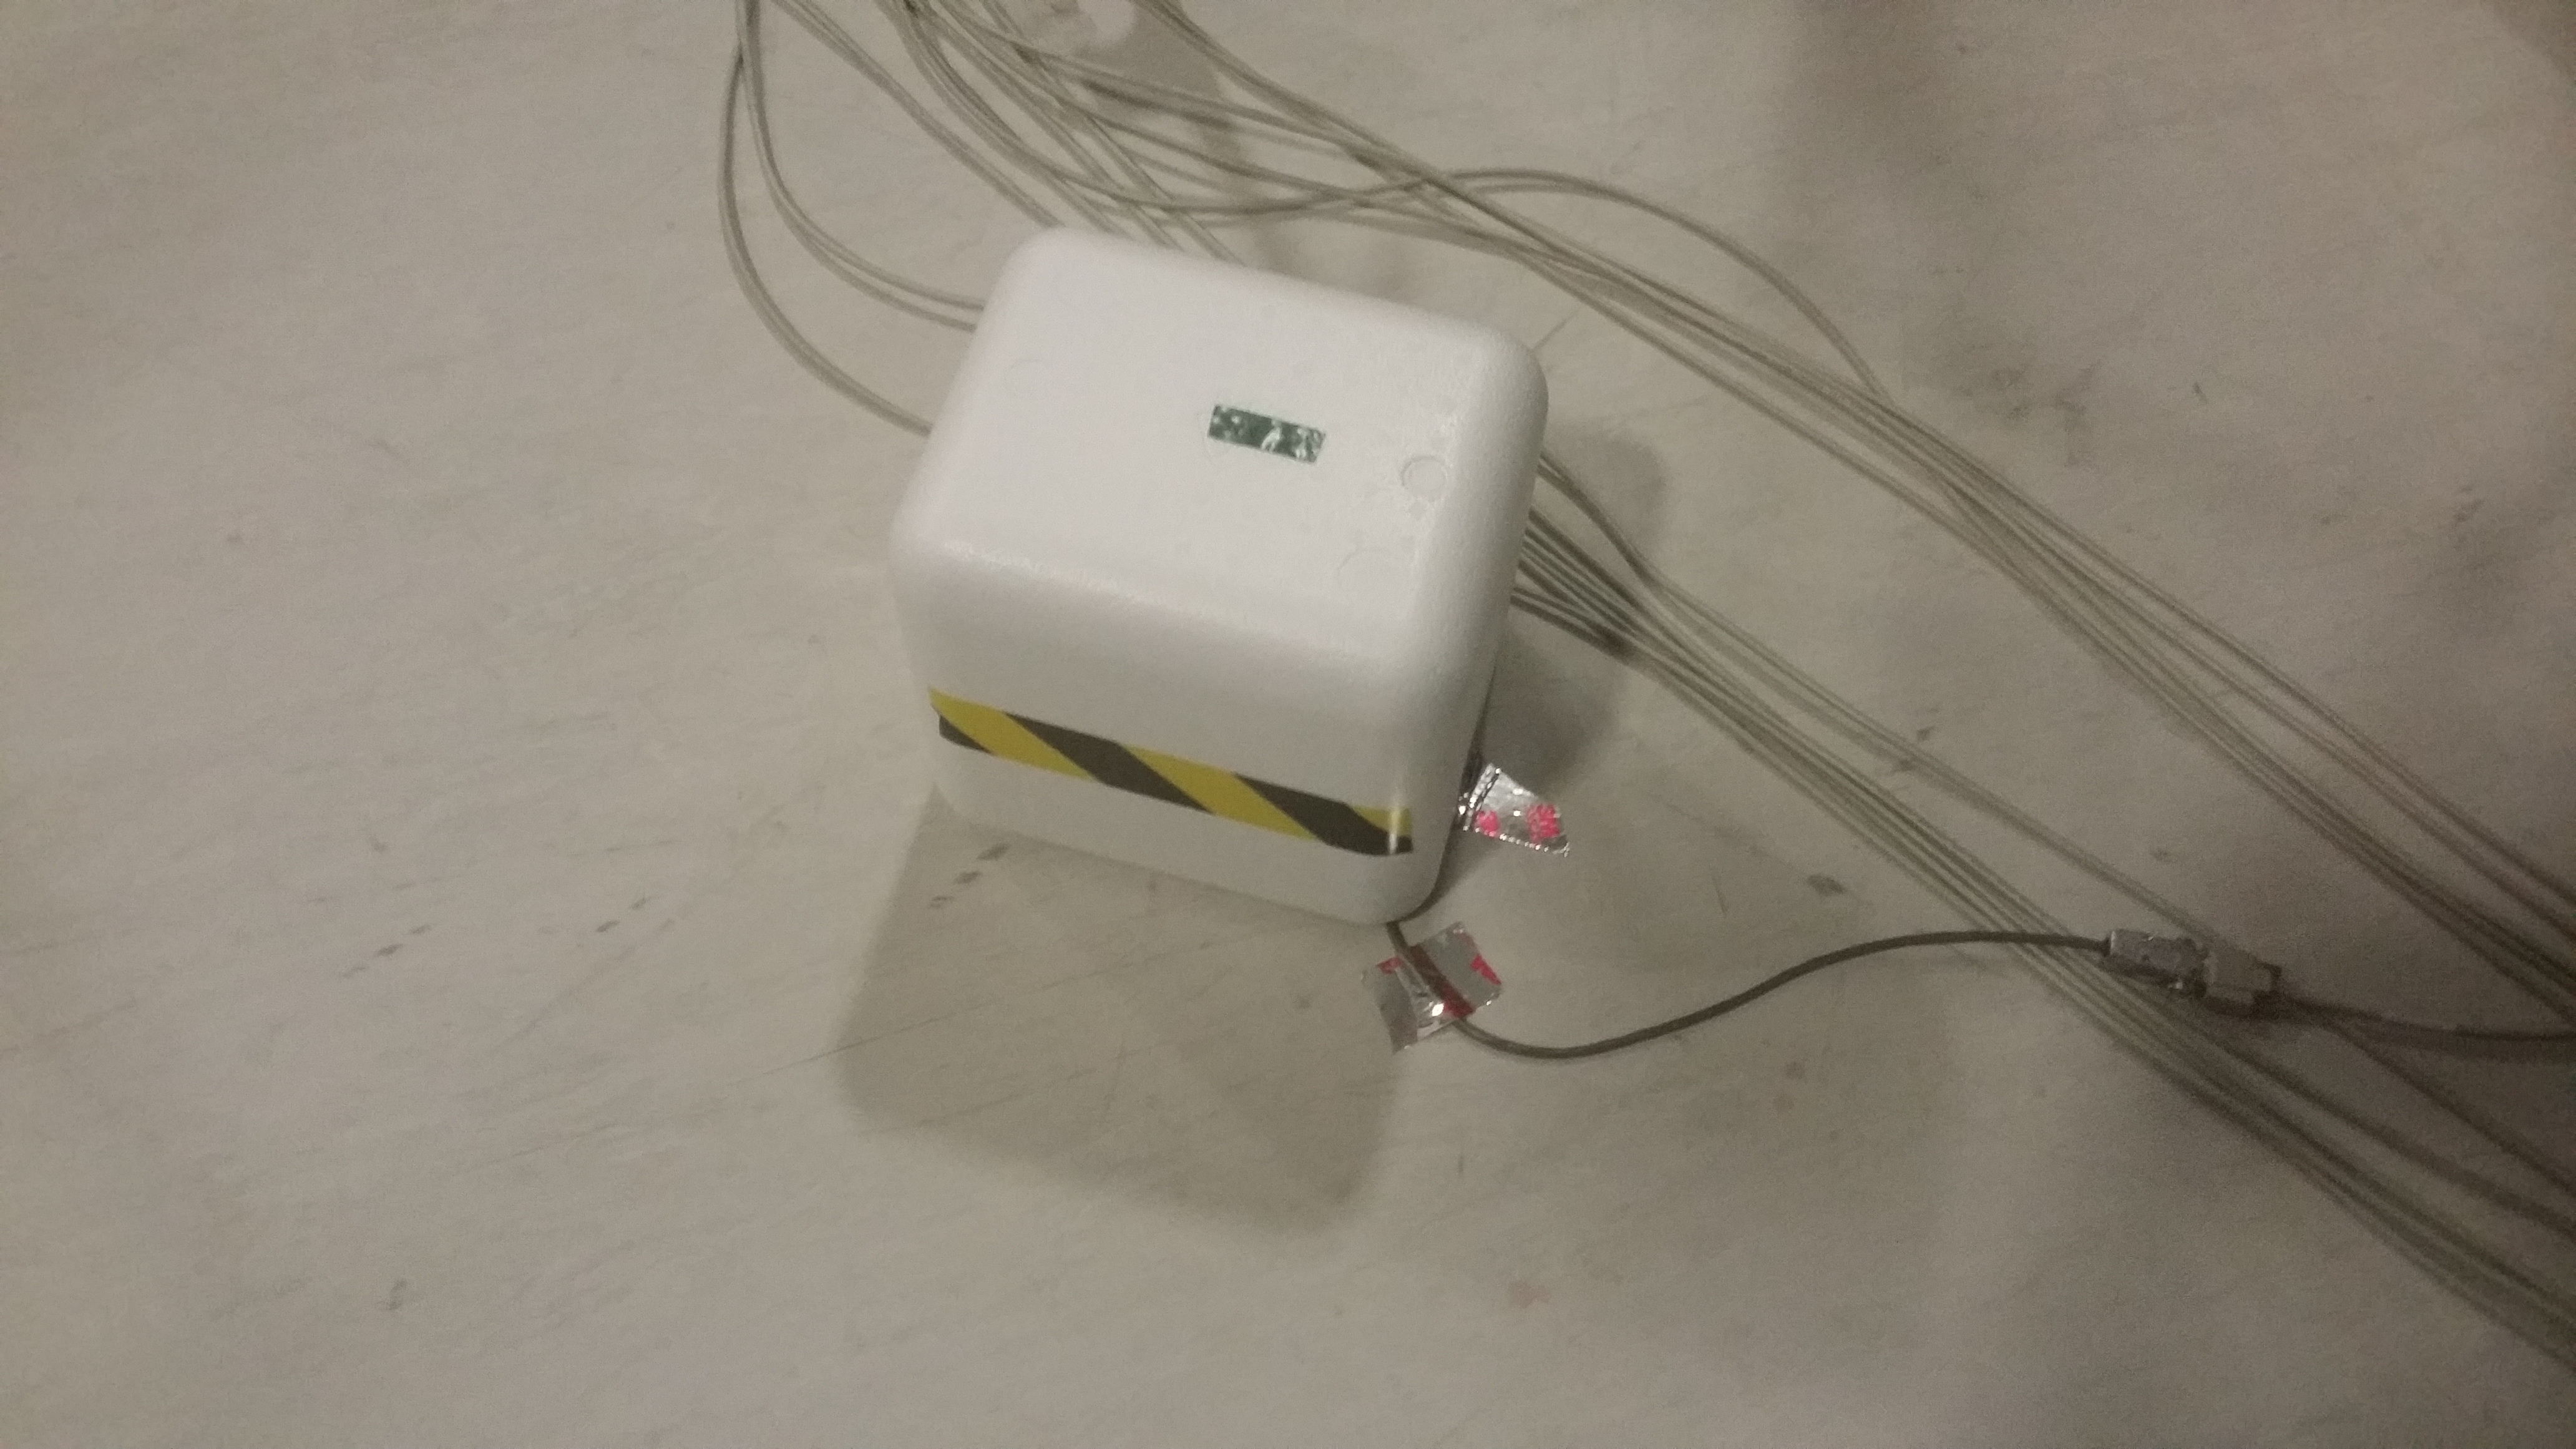
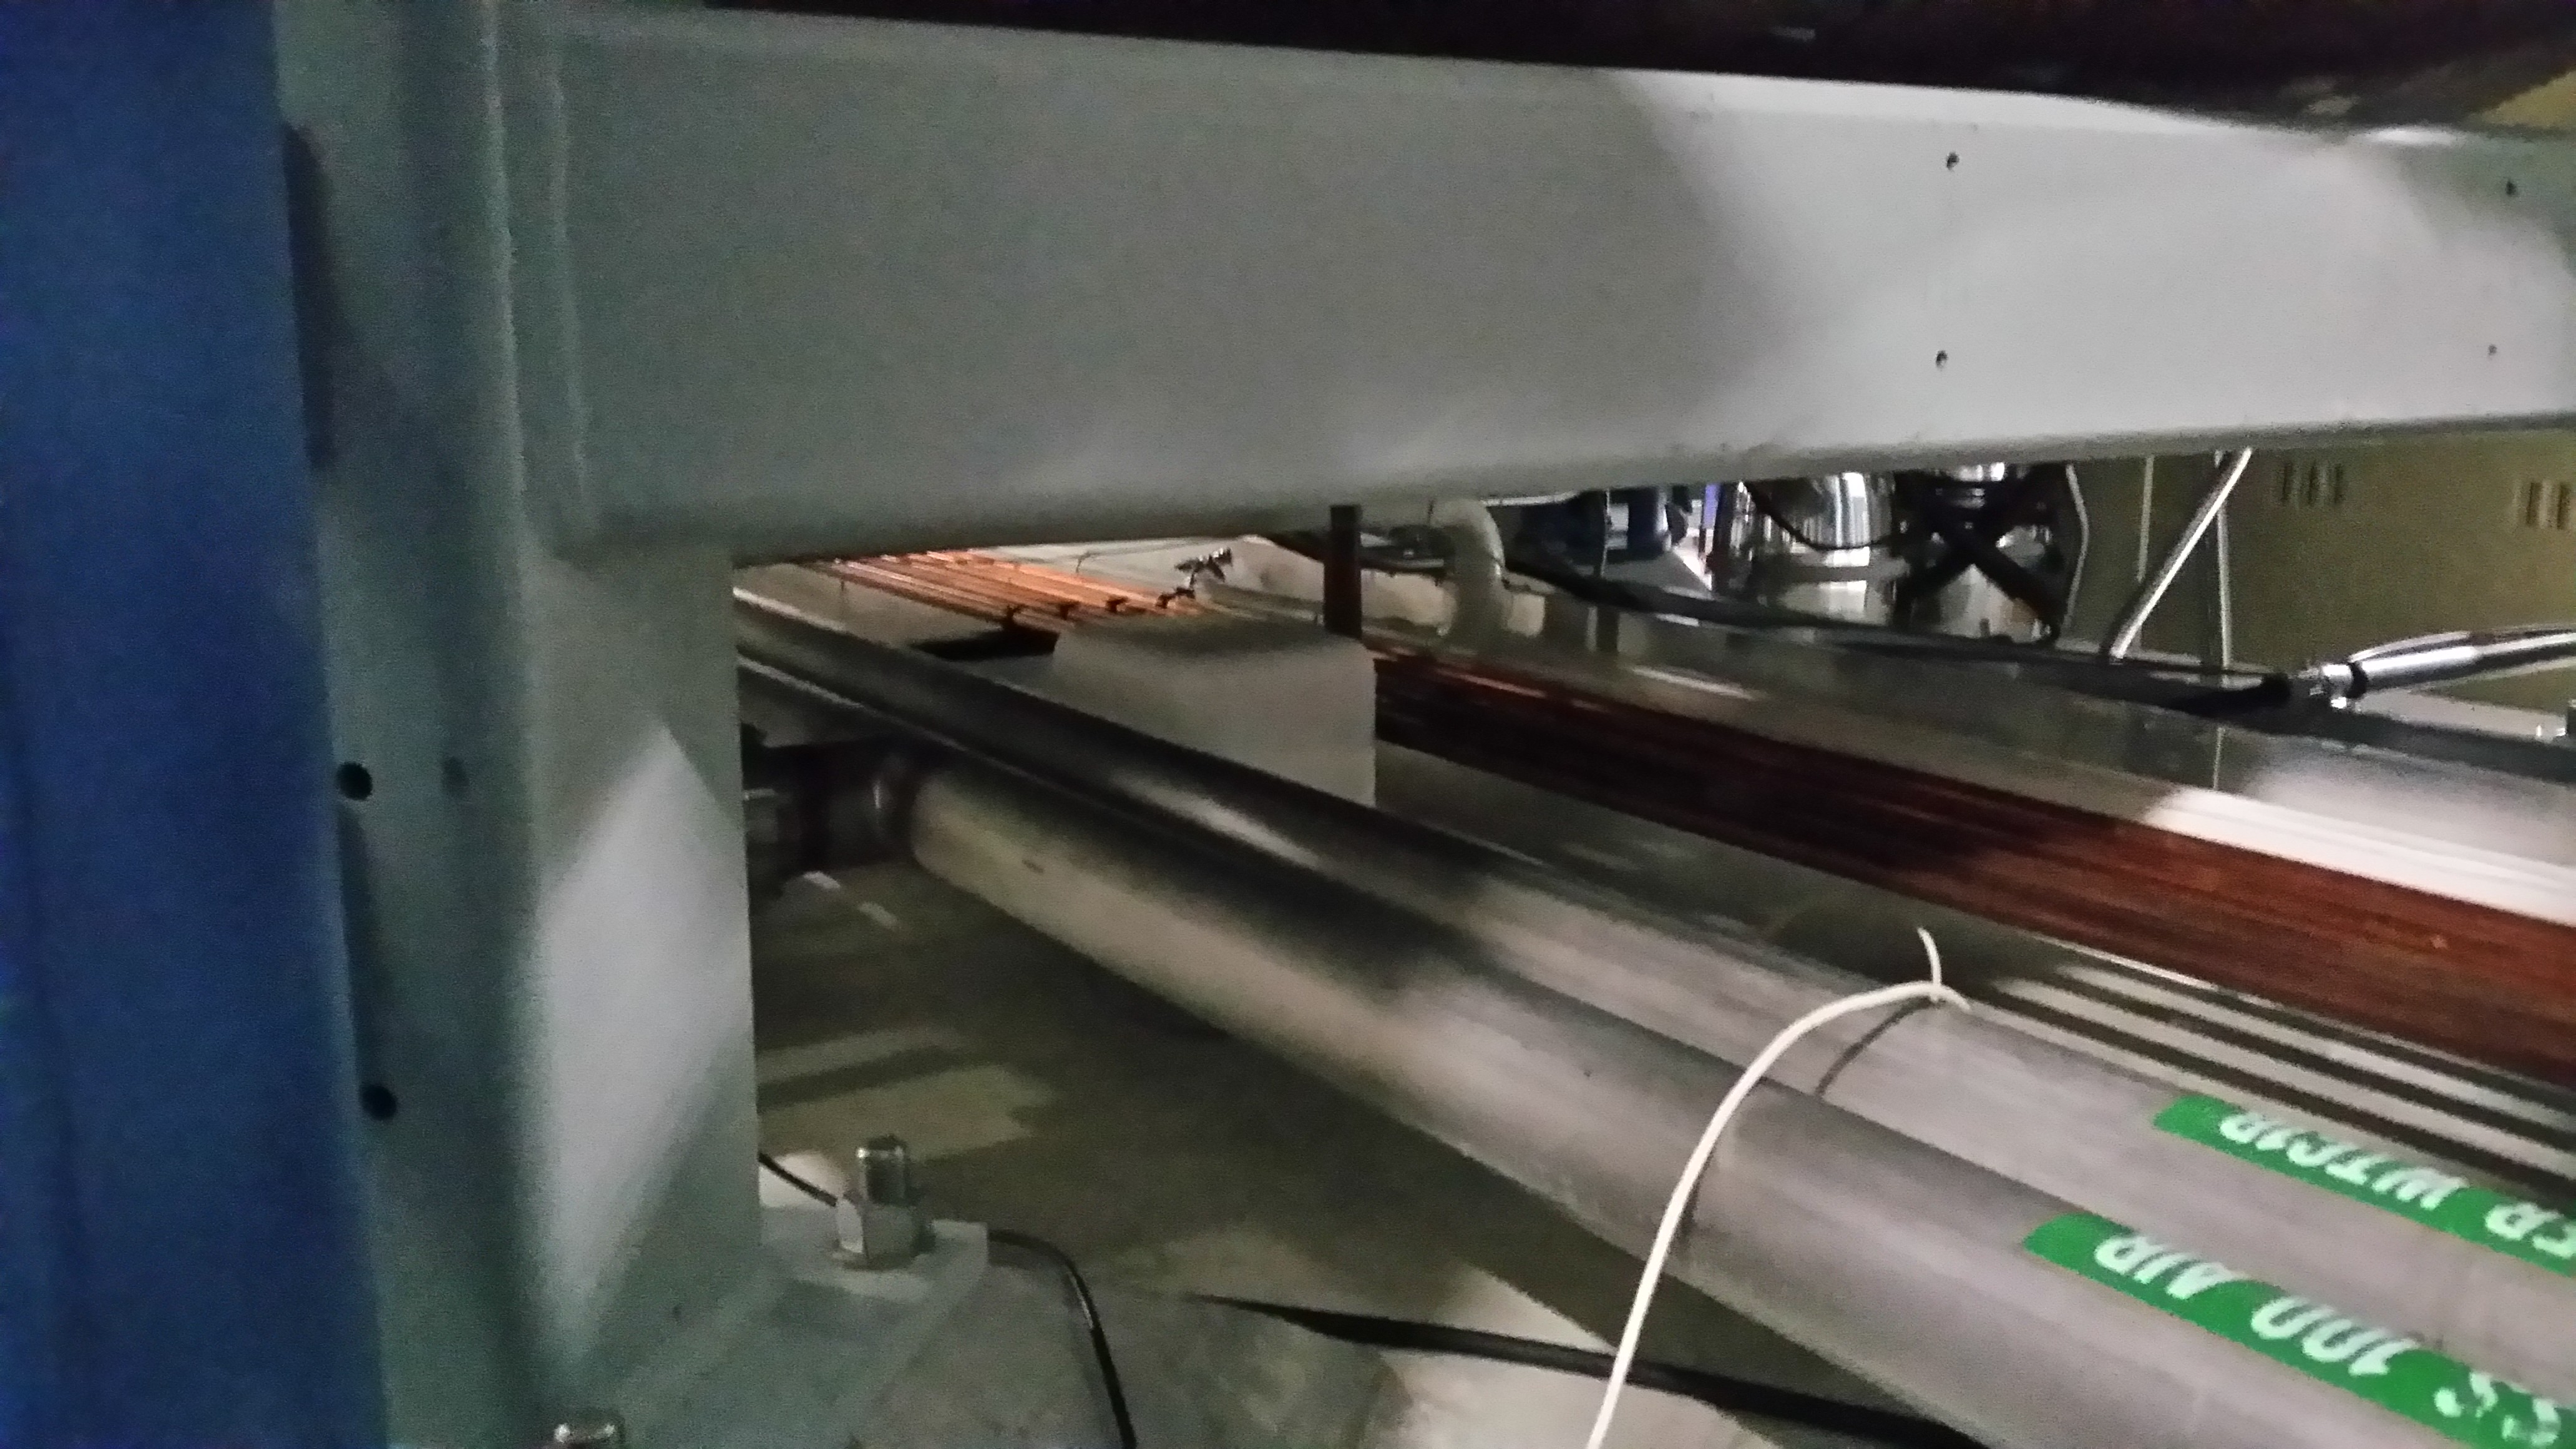
While the correlation with inside relative humidity is not better than with outside temperature, we plot inside relative humidity because we can better speculate on reasons for the correlation. Dry conditions may lead to the build up and discharge of static electricity on electronics cooling fans. Alternatively, there may be current leakage paths that are more likely to discharge in bursts when the pathways dry out. While this is, at best, speculation, we set up a magnetometer near the HV line for the EY ESD to monitor for possible small short fluctuations in current that are correlated with blip glitches. At the same time, we suggest that, as risk mitigation, we consider humidifying the experimental areas during cold snaps.
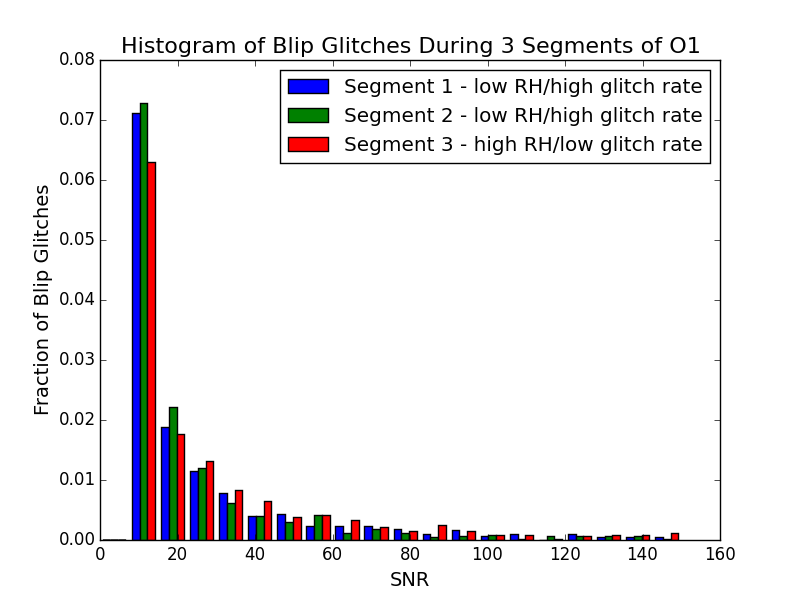
The low-humidity correlated blip glitches may represent a different population of glitches because they have statistically significantly smaller SNRs than the background blip glitches. We analyzed the distribution of SNR (as reported by pycbc) of the blip glitches during three time periods – segments 1, 2, and a relatively quiet period from October 5 – October 20 (segment 3). This gave approximately 600 blip glitches for each segment. Figure 2 is a histogram of these
To determine if these distributions are statistically different, we used the Mann-Whitney U test. Segments 2 and 3 matched, reporting a one-sided p-value of 0.18. The distribution in SNR for segment 3 - the low glitch rate times - did not match either segment 1 or 2, with p-values of 0.0015 and 2.0e-5, respectively. Thus we can conclude that the distributions of 1 and 2 are statistically significantly different from 3.
We are currently examining the diurnal variations in the rate of these blip glitches, and will post an alog about that soon.
Paul Schale, Robert Schofield, Jordan Palamos
We have been studying the list of blip glitches that Miriam Cabero Müller generated for O1. We noticed that the rate of blip glitches increased dramatically during two time periods, see figure 1. We first checked if the glitch rate might be correlated with outside temperature, in case the blip glitches were produced by beam tube particulate events. The correlation with outside temperature was strong, but, for beam tube particulate, we expected it to be stronger with rate of temperature change than with temperature, and it was not. So we checked relative humidity and found that inside relative humidity was well correlated with outside temperature (and glitch rate), most likely because of the extra heating needed in cold spells. A plot of the blip glitch rate and RH inside the CS mass storage room is attached.
While the correlation with inside relative humidity is not better than with outside temperature, we plot inside relative humidity because we can better speculate on reasons for the correlation. Dry conditions may lead to the build up and discharge of static electricity on electronics cooling fans. Alternatively, there may be current leakage paths that are more likely to discharge in bursts when the pathways dry out. While this is, at best, speculation, we set up a magnetometer near the HV line for the EY ESD to monitor for possible small short fluctuations in current that are correlated with blip glitches. At the same time, we suggest that, as risk mitigation, we consider humidifying the experimental areas during cold snaps.
The low-humidity correlated blip glitches may represent a different population of glitches because they have statistically significantly smaller SNRs than the background blip glitches. We analyzed the distribution of SNR (as reported by pycbc) of the blip glitches during three time periods – segments 1, 2, and a relatively quiet period from October 5 – October 20 (segment 3). This gave approximately 600 blip glitches for each segment. A histogram of these is attached.
To determine if these distributions are statistically different, we used the Mann-Whitney U test. Segments 2 and 3 matched, reporting a one-sided p-value of 0.18. The distribution in SNR for segment 3 - the low glitch rate times - did not match either segment 1 or 2, with p-values of 0.0015 and 2.0e-5, respectively. Thus we can conclude that the distributions of 1 and 2 are statistically significantly different from 3.
We are currently examining the diurnal variations in the rate of these blip glitches, and will post an alog about that soon.
Paul Schale, Robert Schofield, Jordan Pala


 . I agree that C00 must have the same sign error and therefore what we saw in the summary page is correct.