J. Kissel, J. Driggers, B. Weaver, E. Merilh. E. Hall, H. Radkins, D. Sigg
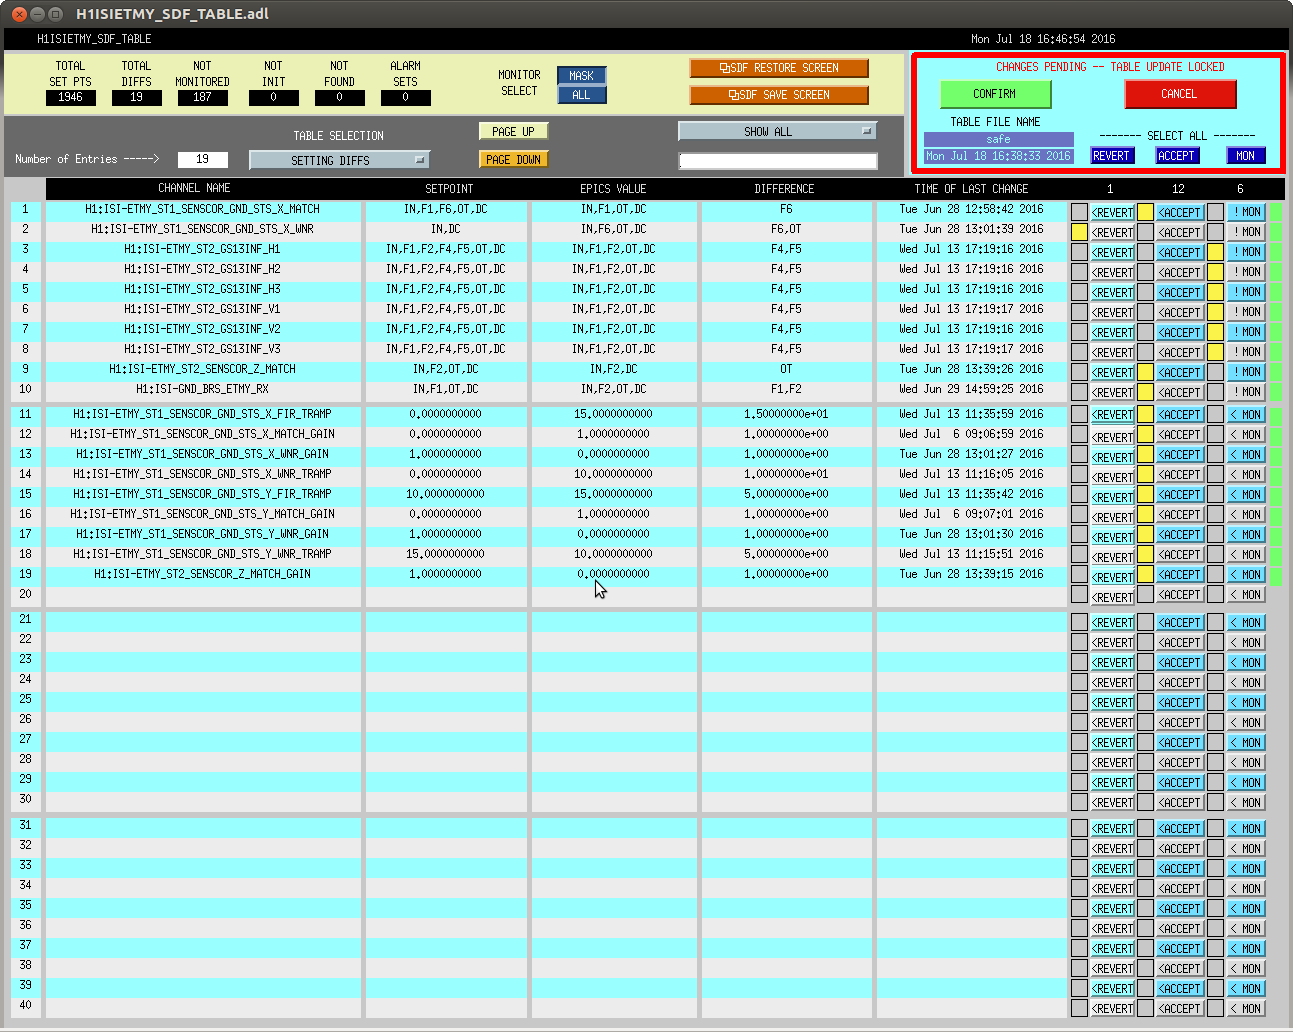
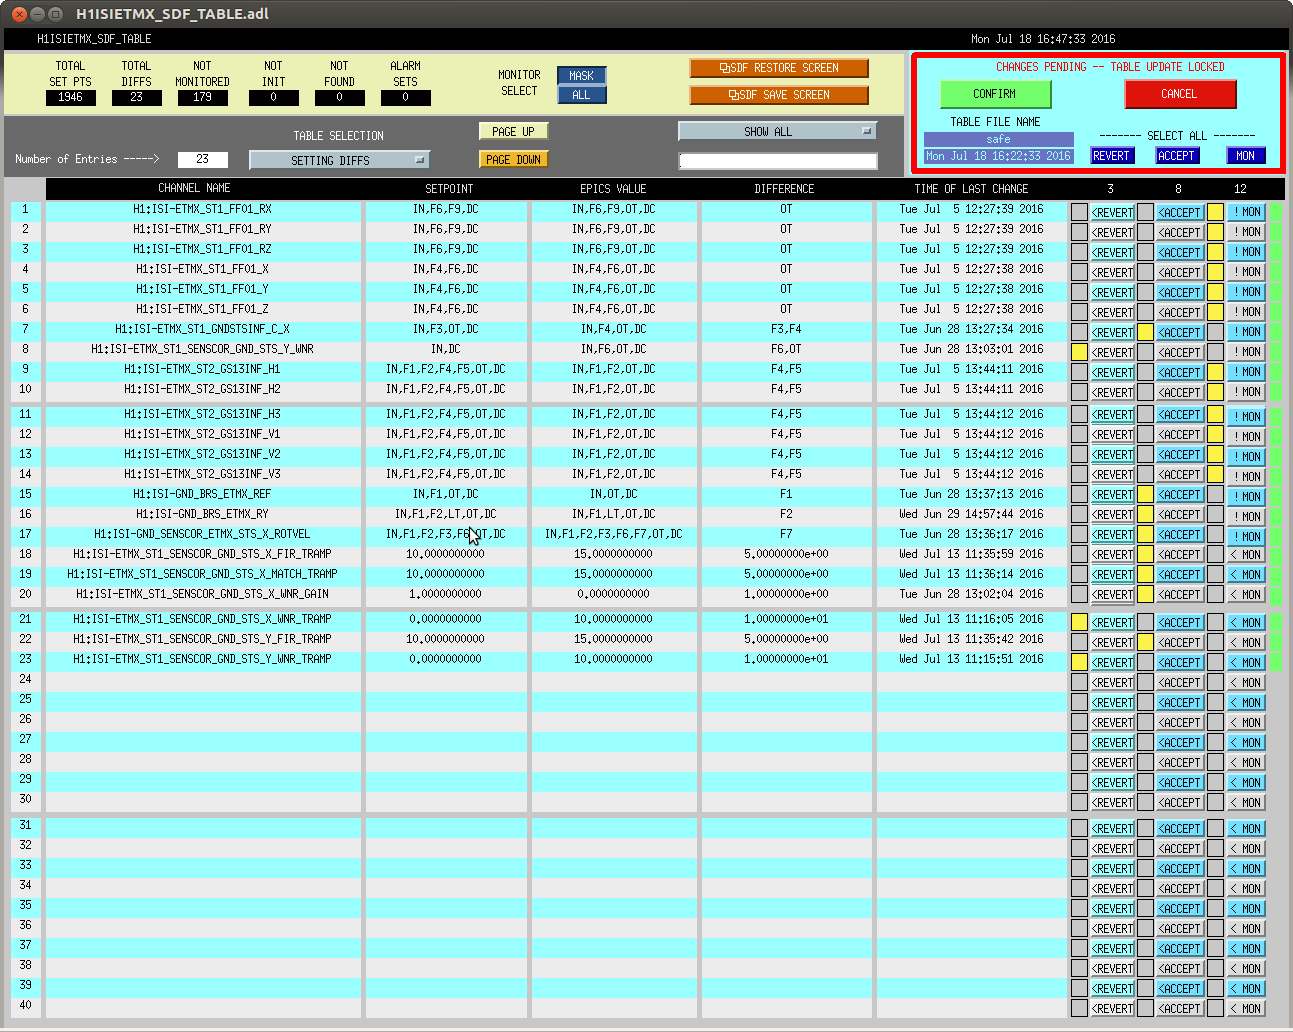
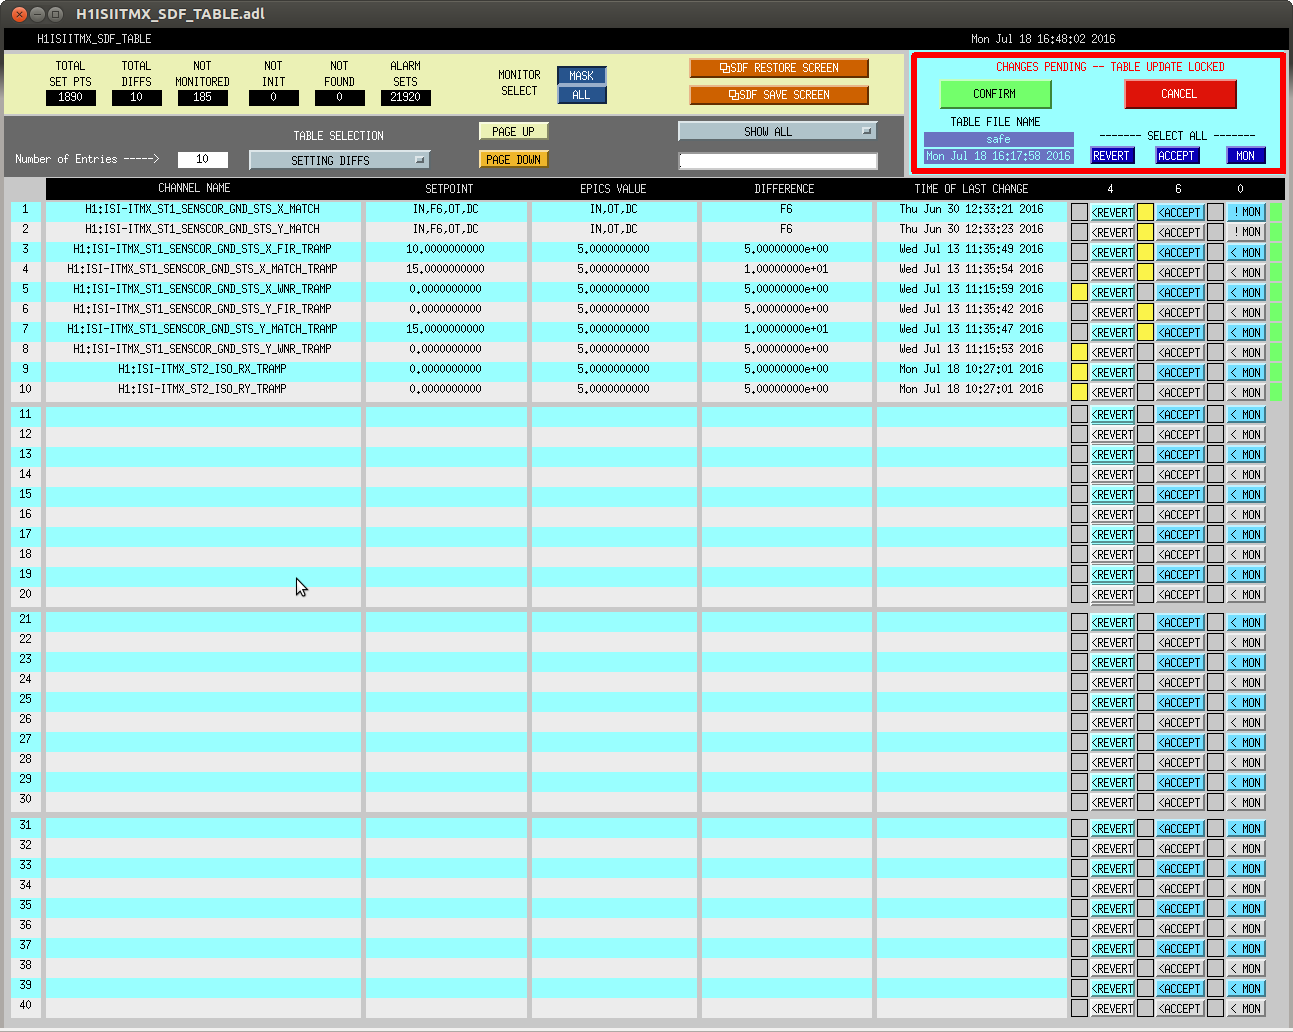
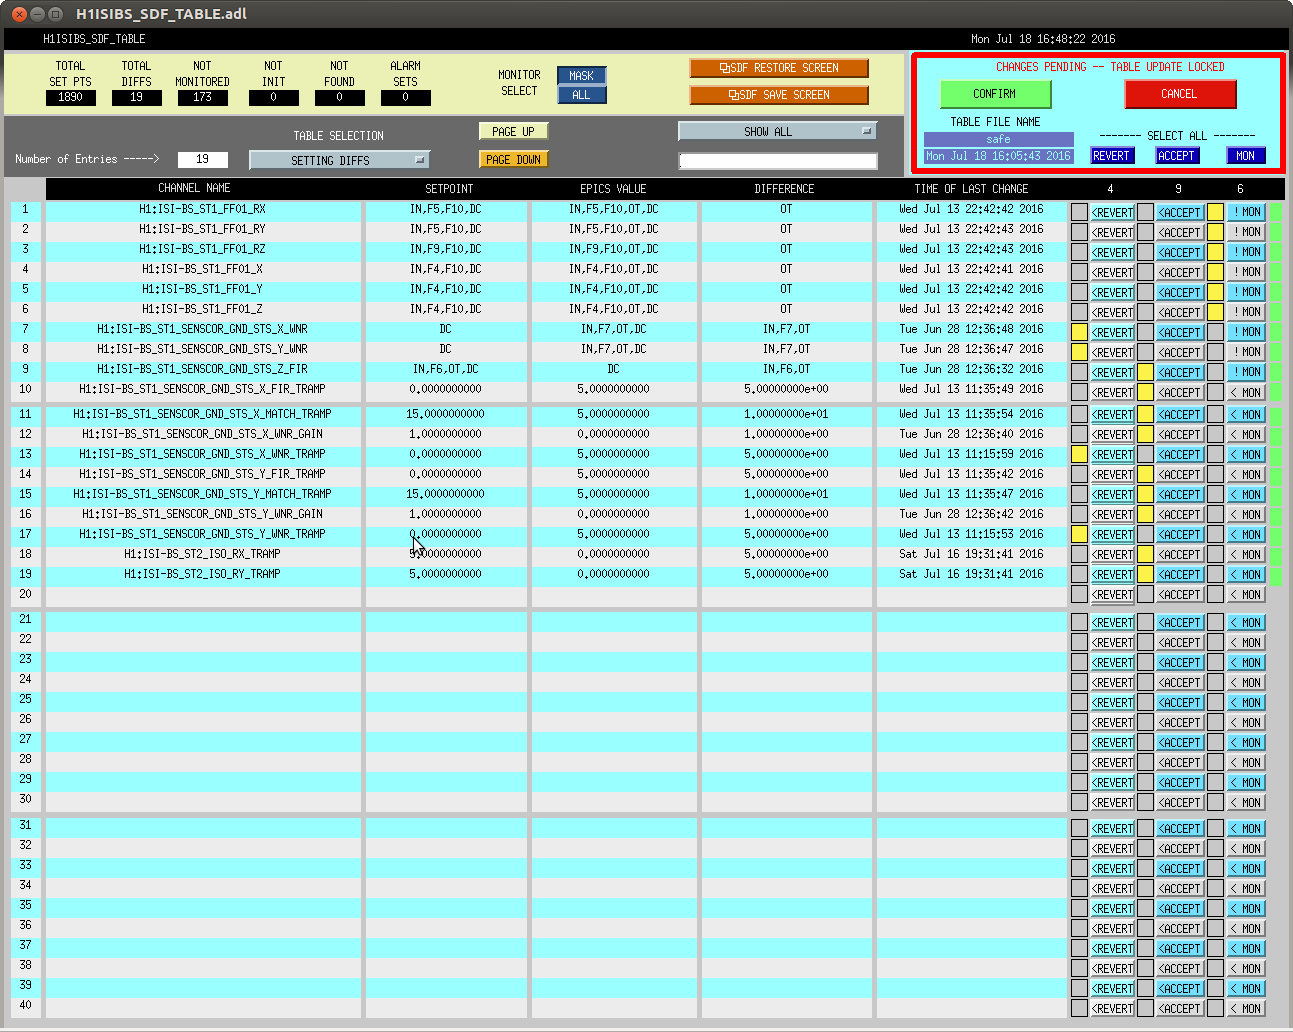
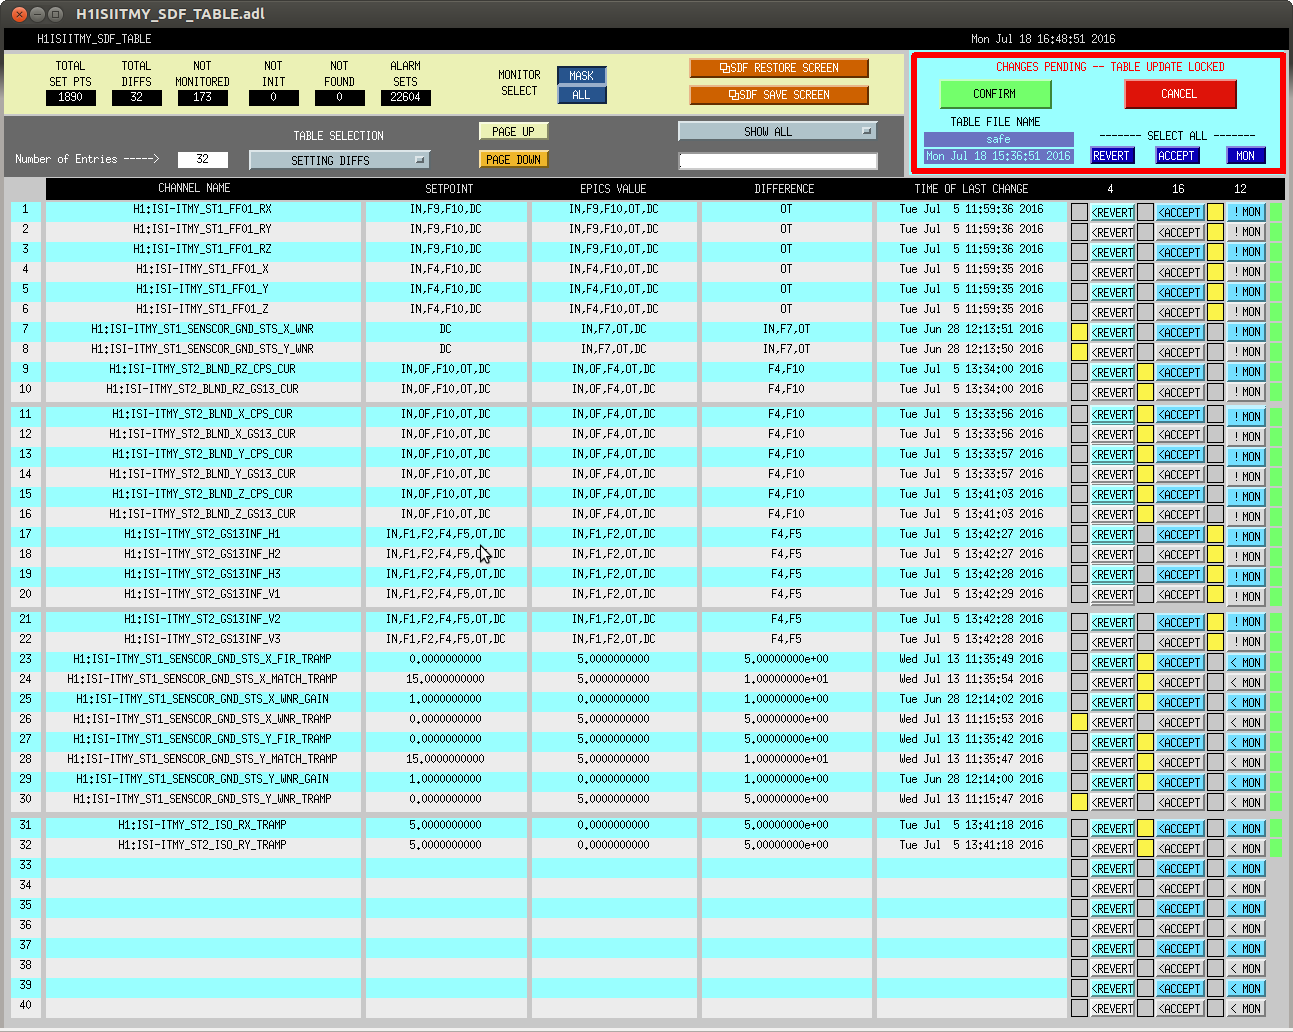
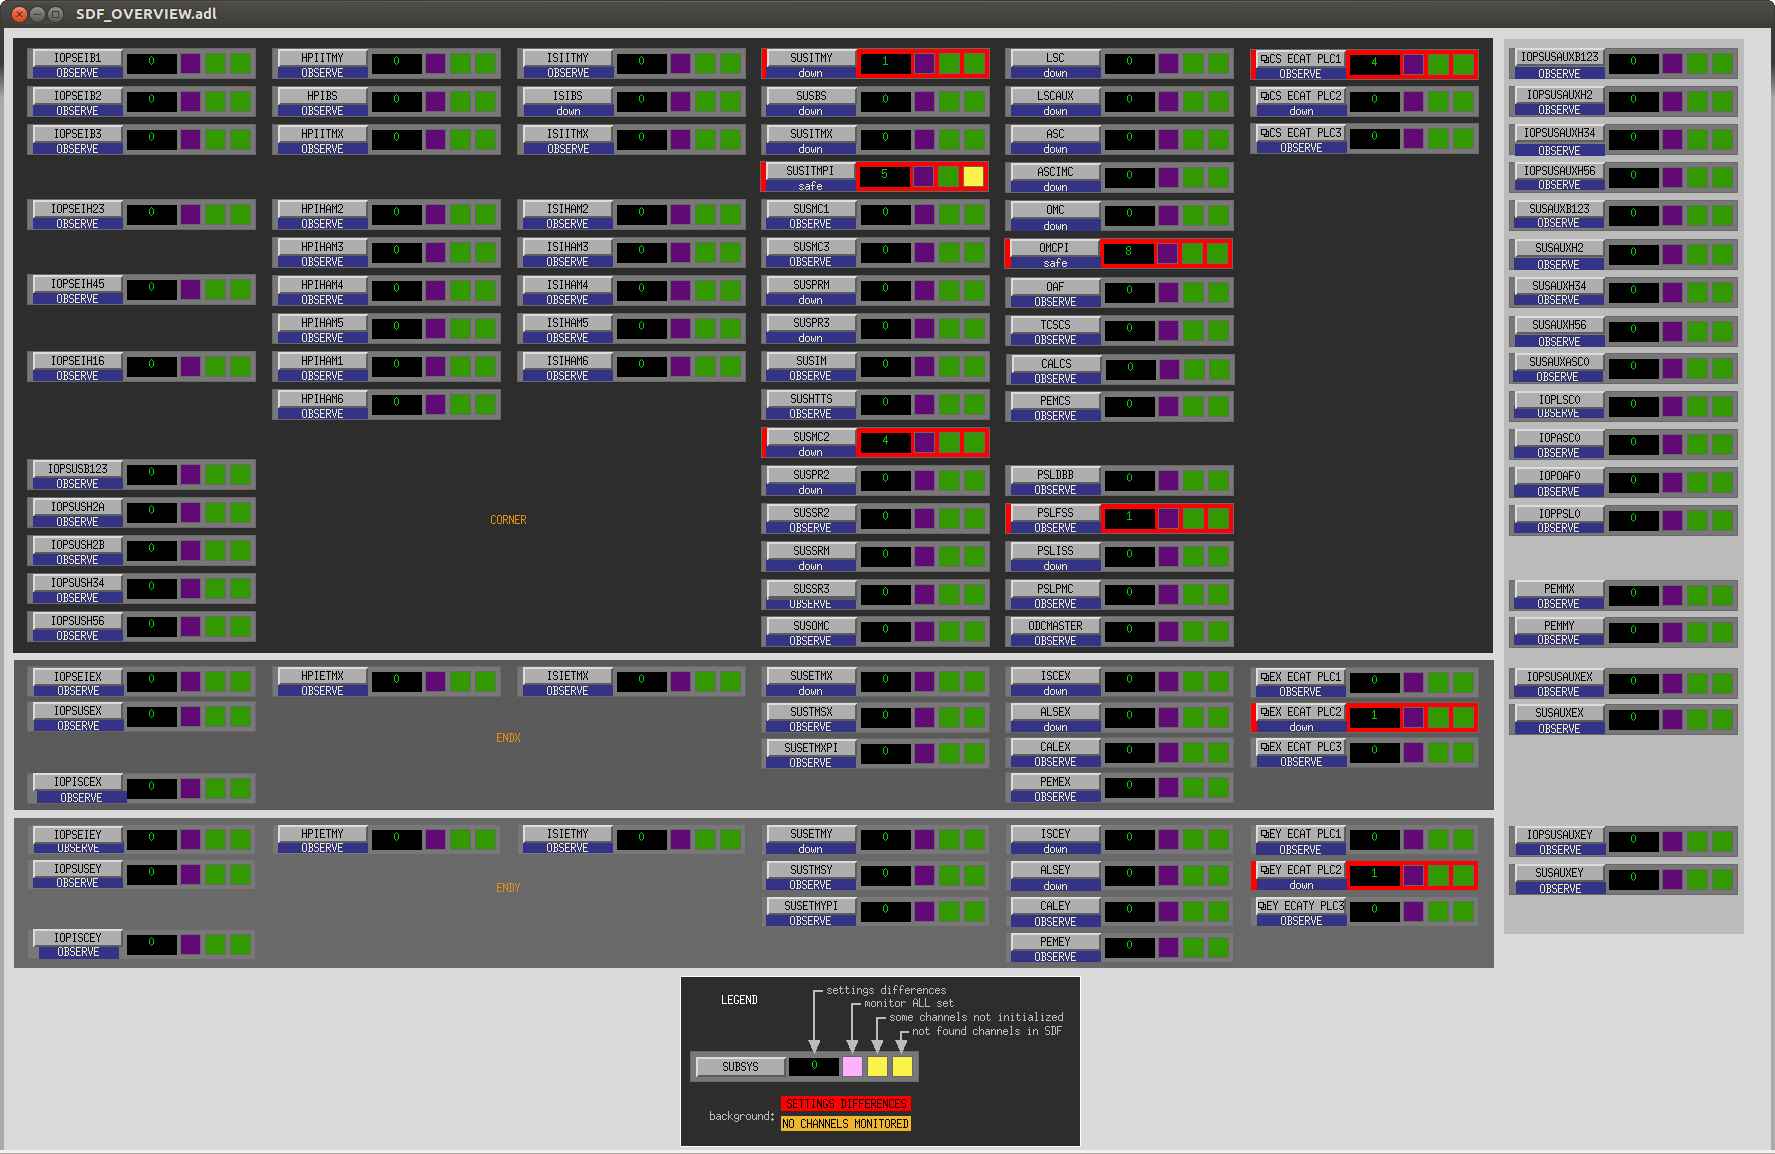
In prep for the timing system software update, which'll need all front-ends to be turned off and restarted tomorrow, we've reconciled the SDF system in the ISC_LOCK guardian's "DOWN" state (note that in this state, some front ends are using the "safe" some are using "down" and some are using "OBSERVE" snap files).
Notable things that we accepted:
- Bounce and Roll monitoring FMs (H1:OAF-BOUNCE_[ETMX, ETMY, ITMY, ITMX]) were found to have FM3 (a broad band-pass) in place instead of FM4 (a narrow band-pass). We reverted to have FM4 ON and FM3 OFF.
- PCAL Y 1083.7 Hz line has been off since June 28. We couldn't find an aLOG, but I recall we turned the 1 kHz line off to preserve range on the PCAL. We've accepted that it's off.
- The Beam Splitter M2 stage LOCK_P and LOCK_Y has bounce and roll mode notching filters for both the BS's bounce and roll modes at 17.7 & 25.7 Hz (FM5 "BounceRoll"), as well as for the QUADs at 9.63 and 13.4 Hz (FM7 "EvanBR"). We found that FM7 was OFF since Jun 28th, and we think we want it ON, so that MICH isn't affected by the ITM bounce and roll modes when actuated in Pitch and Yaw.
- We found the IMC Master WFS gain at 0.09 instead of 0.1, and has been so since July 13th. Seems silly, so we reverted to the gain of 0.1.
- The newish Daniel-style integrators for POP X WFS DC centering servo were found with there bleed-off engaged (via H1:ASC-POP_X_PZT_PIT/YAW_BLEEDEN), as desired since Jun 28. We accepted the bleed off ads engaged it.
- The INP1 Yaw offset was previously -800, and is now 0.0. We accepted the 0.0, because this offset was used to PRC gain spelunking, and is now no longer in favor.
After we went through one round of clearing out, accepting, and reverting, we got mid-way through the lock acquisition sequence and lost lock back to the DOWN state again. For any further channels and changes that occurred, (especially on the suspensions), I UN-monitored those channels.