J. Kissel, S. Dwyer, S. Ballmer
We continue to have trouble with the FSS oscillating after a lock loss, in that it'll often either take several minutes to relax, or it requires manual intervention such as briefly reducing the common gain of the FSS loop. As such, Sheila took a look at the IMC PDH loop to look for problems and instabilities there. I looked over her shoulder at her results, and saw some areas for improvement in the loop design. The current loop design has an UGF at 66 [kHz], with a phase margin of 68 [deg]. However the gain margin around ~200 [kHz] is pretty dismal because of what looks to be some icky features in the physical plant. These features have been shown to be directly influenced by the FSS common gain (see second attachment in LHO aLOG 28183).
I figure, given that we've got oodles of phase margin, what harm could be done by just adding a simple 200 [kHz] pole in loop, and reducing the gain by ~2 [dB]? As such I took Sheila's data, which lives here
/opt/rtcds/userapps/release/isc/common/scripts/netgpib/netgpibdata/TFAG4395A_12-07-2016_163422.txt
(also attached) and added these modifications offline as a design study.
In the attached plots, I compare the as-measured IMC PDH Open Loop Gain, G, Loop Suppression, (1/1+G), and the Closed Loop Gain, (G/1+G), against one modified as described above (blue is as measured, and green is the modified design study).
The results are encouraging: a still-substantial UGF of 47 [kHz], and a very-healthy phase margin of 58 [deg]. However, as can bee seen in the loop suppression and the closed loop gain, there is far less gain-peaking and/or a much great gain margin and we would no longer have to worry about the icky features in the plant that are so sensitive to the FSS common gain.
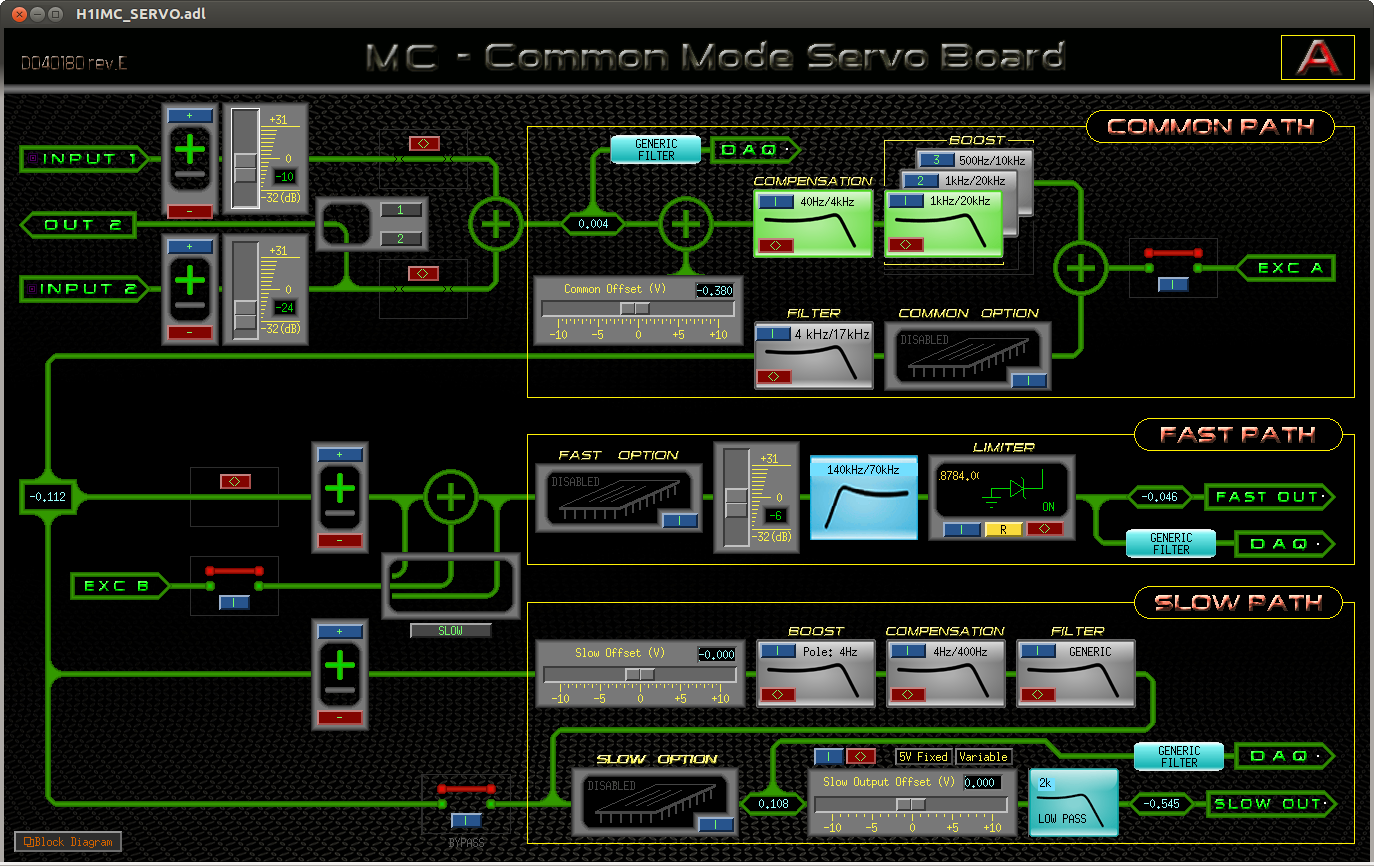
Where to stick such an analog filter? It's of course dubious to claim that the MEDM screen for such a system is representative of the analog electronics, but assuming it is, one can see that there is the possibility of a switchable daughter board in the FAST path that gets shipped off to the PSL AOM for the FSS. Because it's switchable, we can toss whatever simple filter in there that we like, and then compare and contrast the performance for ~1 week to see if it improves the stability problems we've been having.
What impact would this have on the full IFO's CARM loop? I'll remind you of Evan's loop analysis of the whole frequency stabilization spaghetti monster in LHO aLOG 22188. There he suggests that the CARM UGF is around 17 kHz, so as long as the Closed Loop Gain around there is the same, then this change in the IMC PDH loop should have little impact [[I just made this sentence up based on just a few words from Sheila who asked me to look at the CLG. I'm not confident of its truth. Experts should chime in here]]. Indeed the third .pdf attachment shows that G/(1+G) of the IMC PDH loop, regardless of modification remains unity out to 100 [kHz].