Summary:
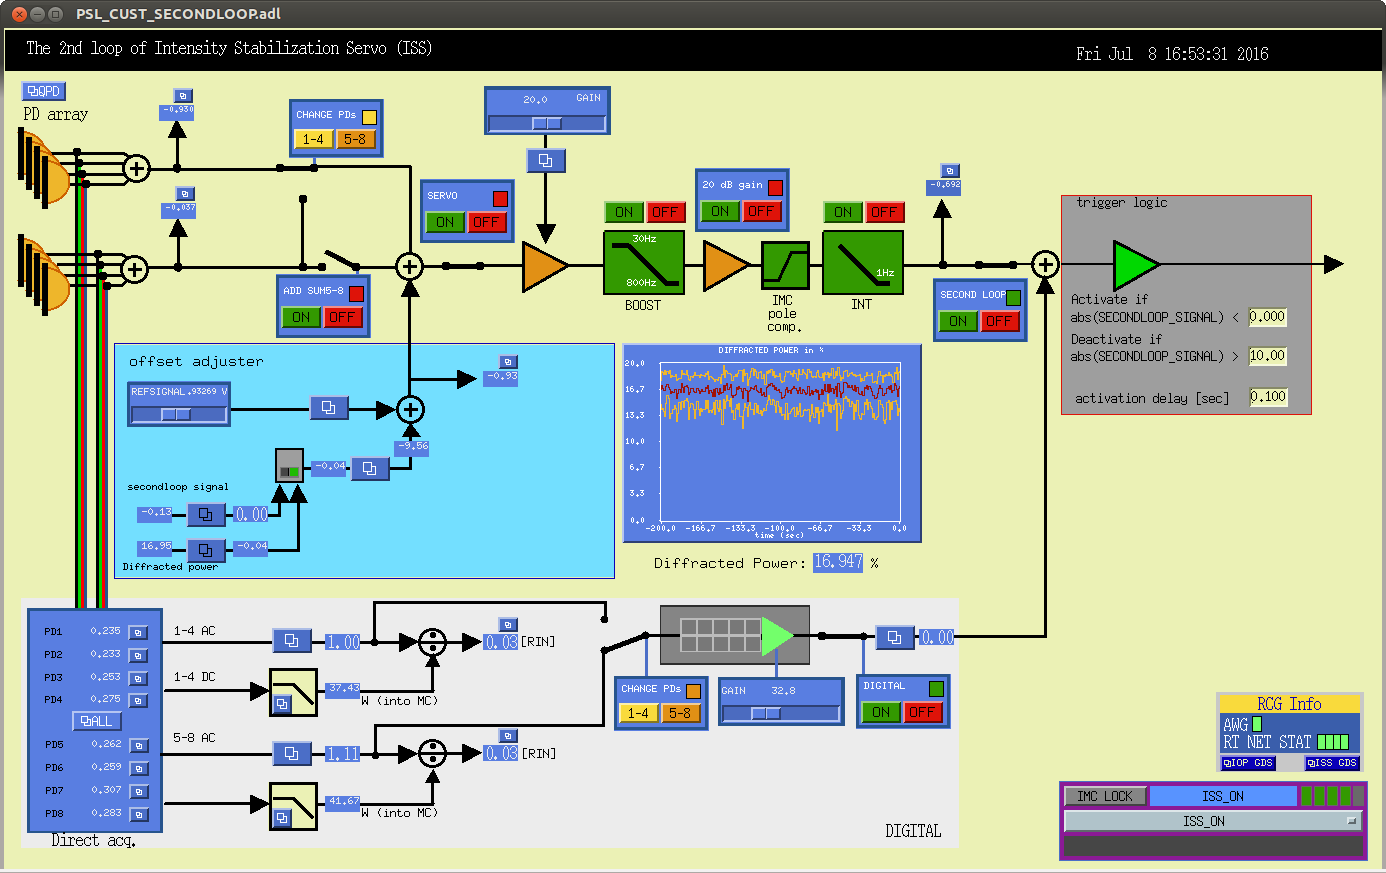
As reported before (28236), ISS 2nd loop MEDM screen appears as if it sometimes doesn't agree with reality. Turns out that it never truly agreed with reality. For example, in the first attachment, both SERVO ON/OFF indicator and additional 20 dB gain indicator are red while these are ON.
I was bothered enough to investigate and found that the MEDM screen has numerous nonsense logic and that the guardians are not written MEDM-friendly. I made a quick dirty fix for MEDM as well as guardians.
What was wrong:
Before going into details, you need to know that ALL of PSL 2nd loop I/O that are binary in nature is done via 16 bit DAC (don't ask me why). The output of DAC is sent to optical coupler via a resistor (see e.g. D1300439). To make anything ON, you want some large positive voltage to drive the LED in the coupler. To make anything OFF, you want to send sufficiently small (e.g. zero-ish) voltage or negative voltage.
As you can easily guess, one of the problems is the lack of convention. People sometimes send +32000 and other times +32700 to make the same thing ON. Sometimes -32000 and other times 0 to turn it OFF.
On top of that, there are many bugs in MEDM screen such that color indicators check some nonsense bits that never change, value set on pressing button but changed to a different number on releasing the button, that kind of things.
What was done:
I changed most everything in MEDM as well as IMC_LOCK and lsclibrary such that:
-
OFF is 0 so MEDM switch graphics using "if zero" and "if not zero" works correctly,
-
ON is 32000 for the sake of consistency but the color indicators check if the value is positive (instead of looking at some specific bit).
It seems as if it's working for now.
Madness example:
Just as an example. Manually pressing CHANGE PDs button could have made you believe that you selected PD1-4 when PD5-8 (3rd loop) was selected in reality.
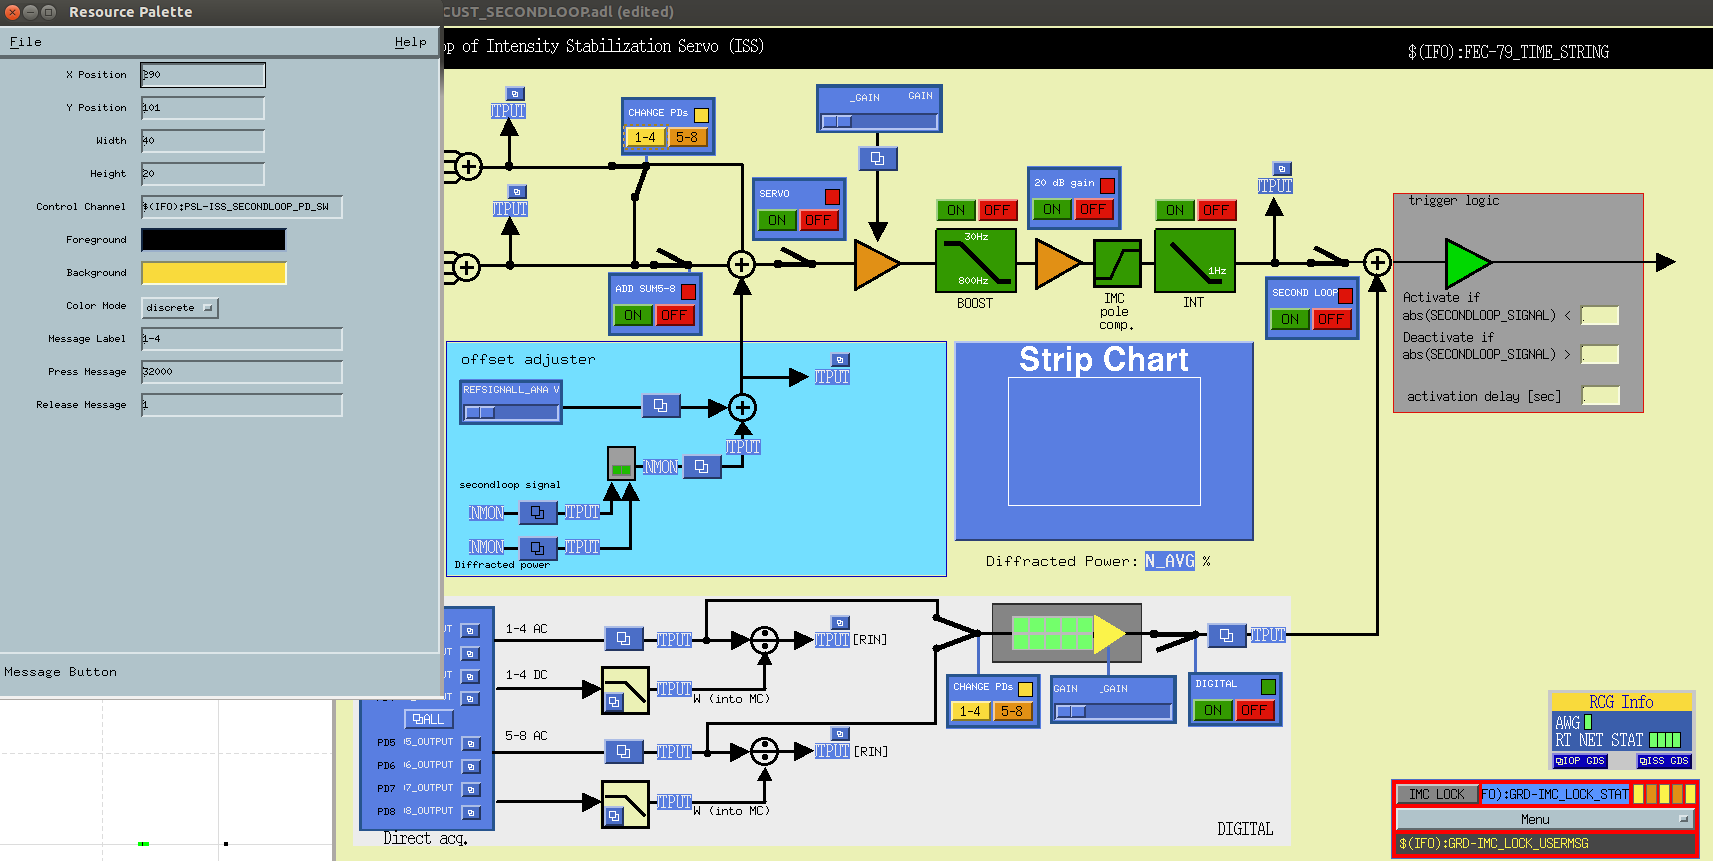
In the second attachment, you can see that the CHANGE PDs "1-4" button sent 32000 (40V-ish differential) when pressed, but then 1 (less than 1 mV) when released.
PD1-4 is selected with large positive voltage (or ON or HIGH or whatever), otherwise PD5-8 is selected.
When you manually pressed and released "1-4", the DAC output momentarilly went +40V differential, but immediately went down to some tiny voltage, so PD5-8 was selected in the end.
But the switch graphics was implemented assuming that non-zero output means PD1-4. Since the DAC output was 1 after pressing the "1-4" button, the graphics showed that PD1-4 was connected instead of 5-8. The PD indicator color box didn't help either as it checked the bit 2 of the DAC output, and it only turned to orange (CH5-8) only when DAC output was 32700.
The story was different for guardian as it used +32000 and -32000 for PD1-4 and PD5-8, respectively. When guardian did something, it looked as if PD1-4 was selected no matter what.