Evan, Sheila, Stefan
For now we decided that we need to go back to a SRC alignment scheme similar to the O1 one - while not great it kept the machine running with the existing hardware. And we know that was at least reliable enough to do other work.
We started with SRC1_Y. The combination
ezca['ASC-INMATRIX_Y_6_3']=-1.5 # AS_A36I to SRC1_Y
ezca['ASC-INMATRIX_Y_6_7']=1 # AS_B36I to SRC1_Y
gave a reasonable error signal with about zero offset, and we could close the loop - with a gain of -30 for now.
As in the past pitch is a bit more tricky. AS_B36I has a nice signal but also quite the offset. We lost lock before finding a good value for this, and had an episode of lock losses most likely due to bad initial alignment. (below).
On the next round the following gains seemed to work for now:
#set input matrix
ezca['ASC-INMATRIX_P_6_3']=0 # off for now
ezca['ASC-INMATRIX_P_6_7']=1 # good enough for now
ezca['ASC-INMATRIX_Y_6_3']=-1.5
ezca['ASC-INMATRIX_Y_6_7']=1
ezca['ASC-INMATRIX_P_6_1']=0
ezca['ASC-INMATRIX_P_6_5']=0
ezca['ASC-INMATRIX_Y_6_1']=0
ezca['ASC-INMATRIX_Y_6_5']=0
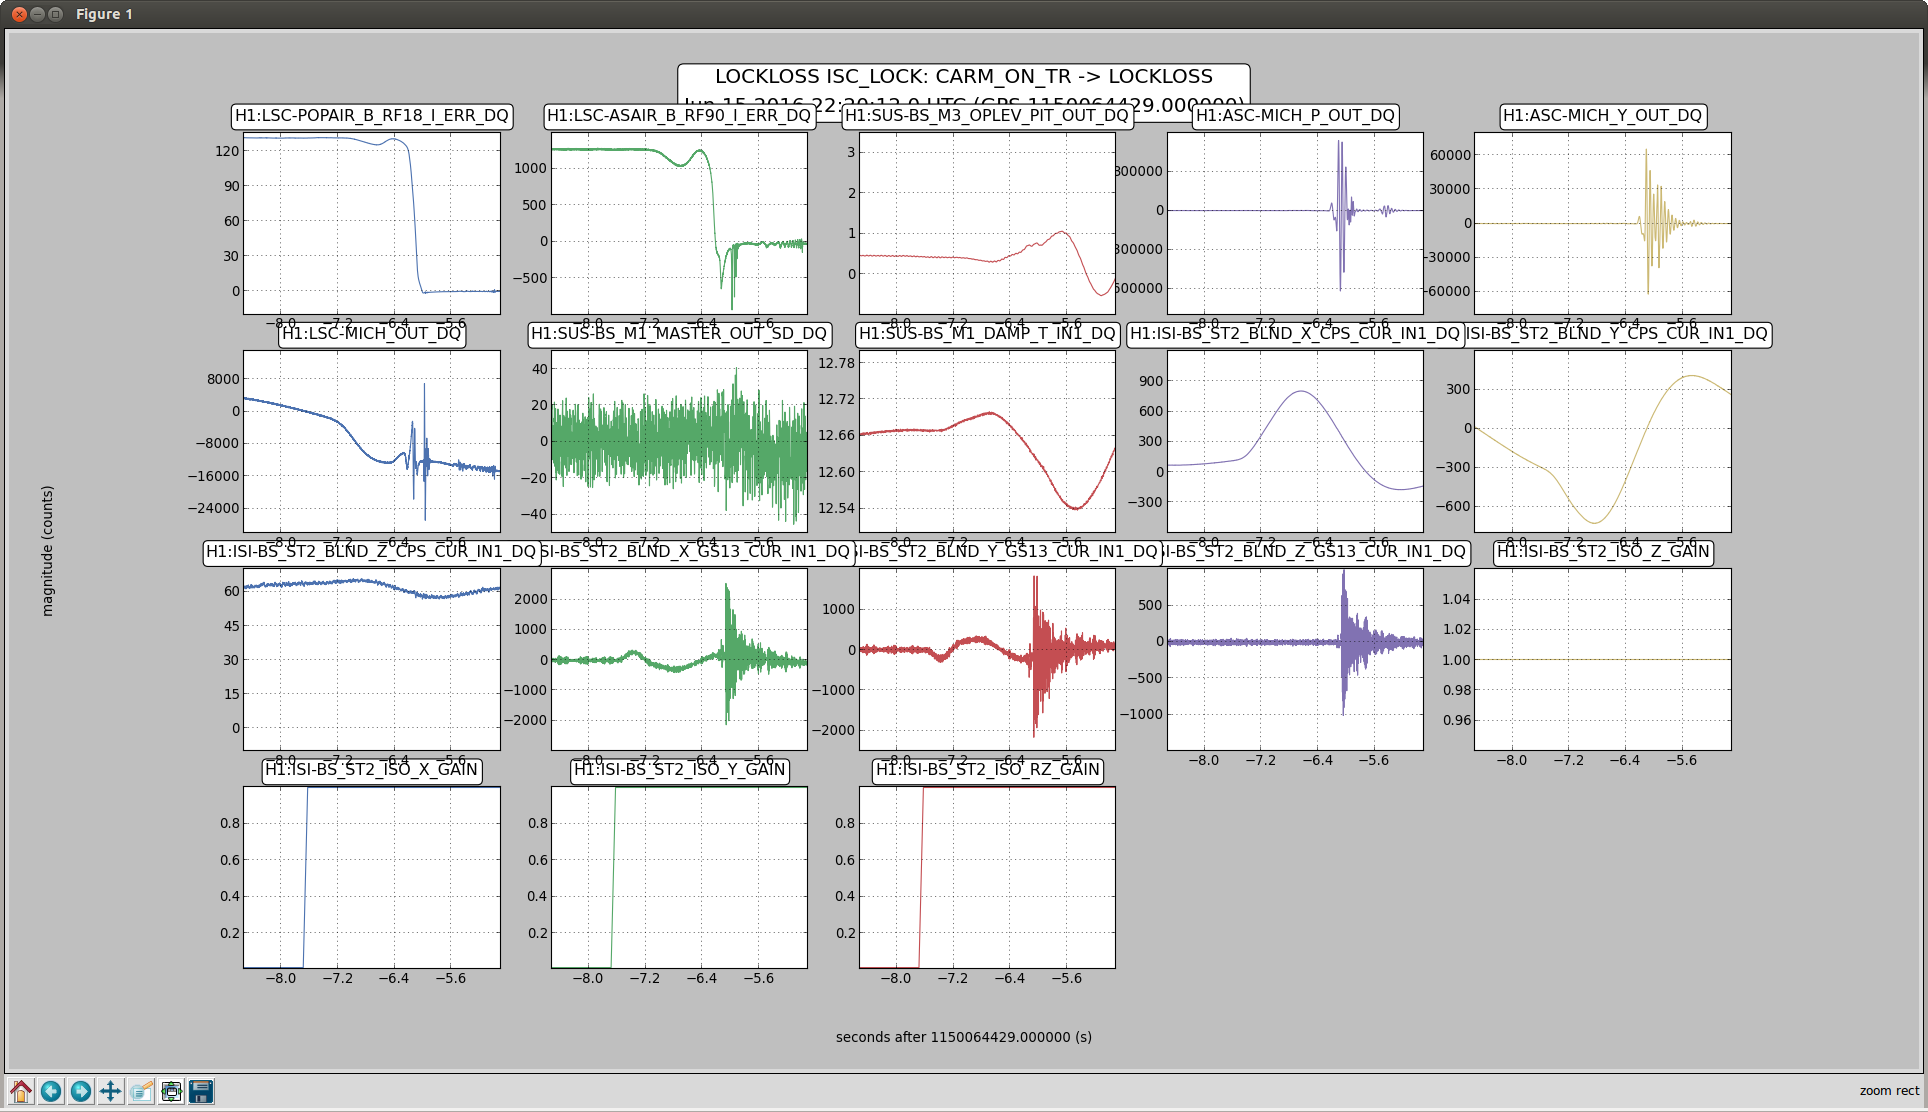
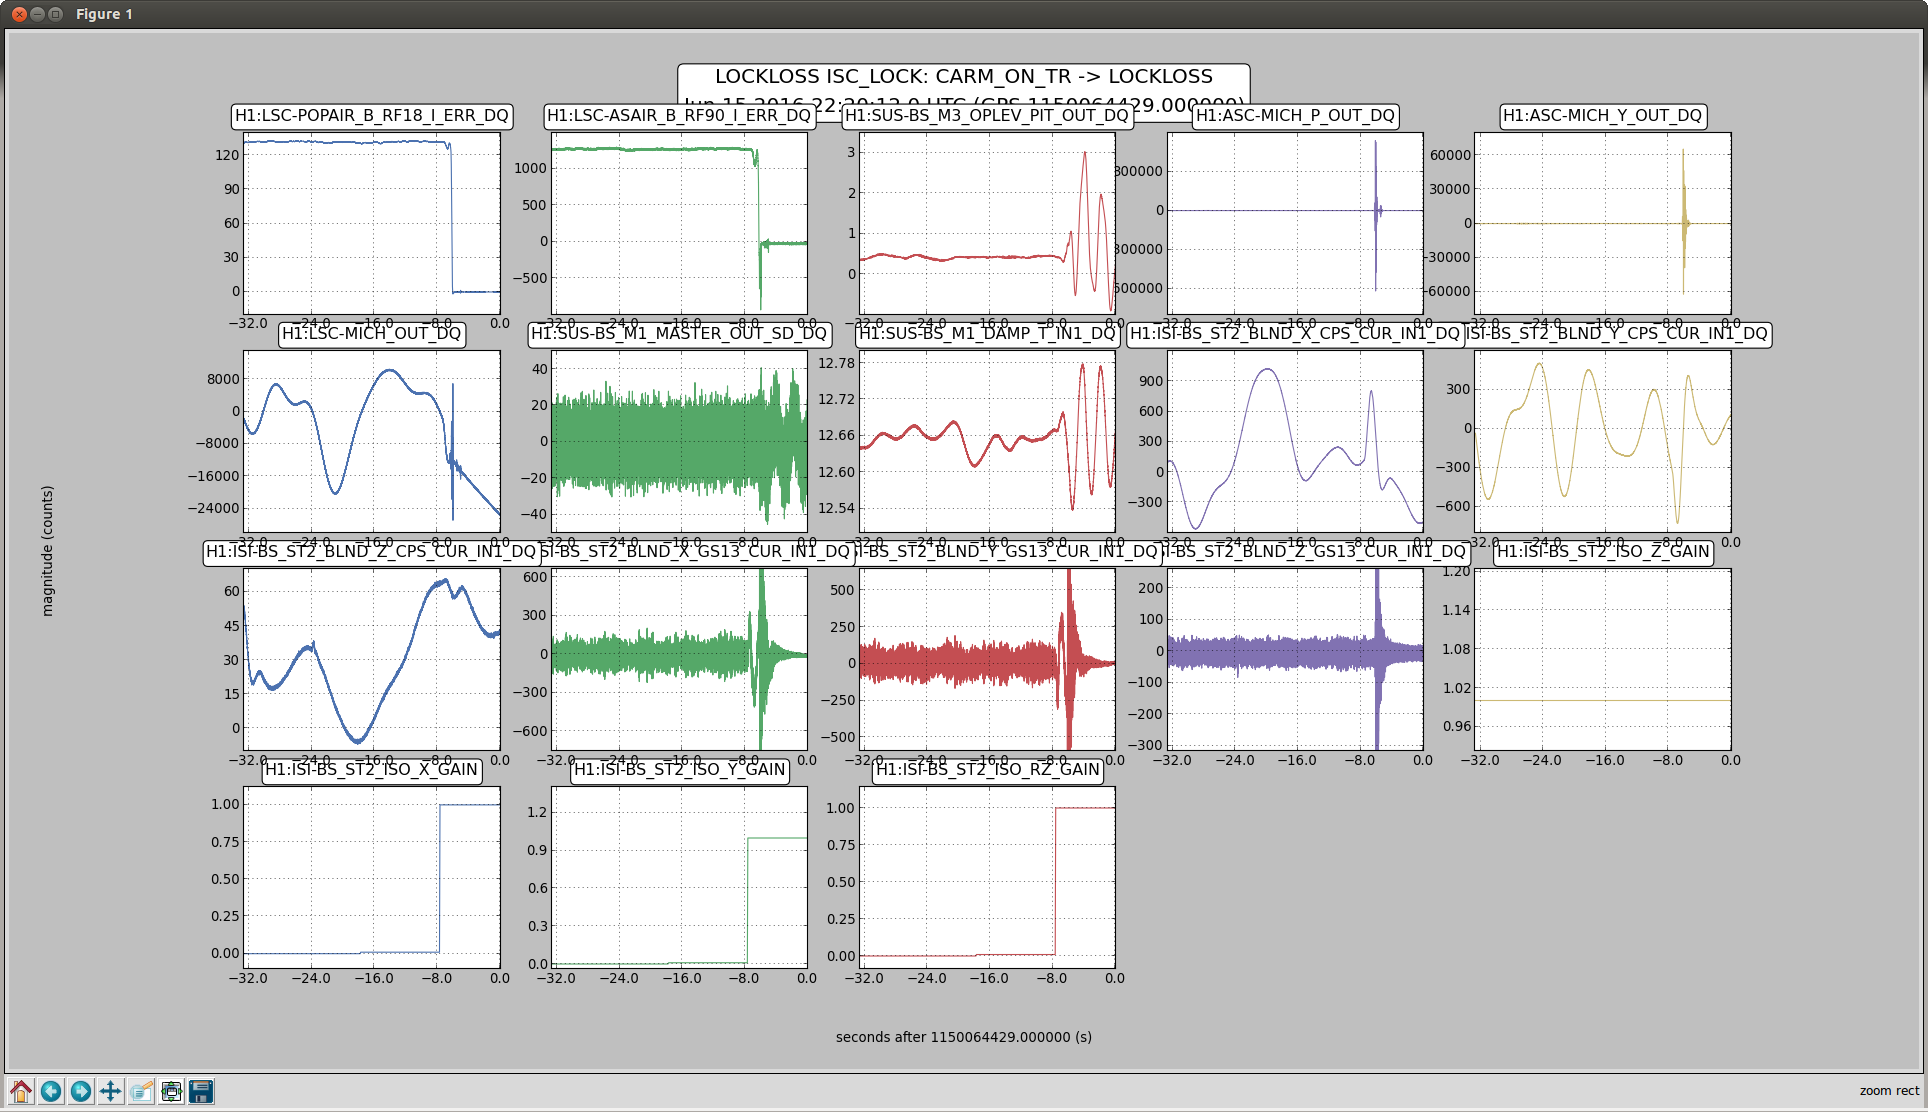
As mentioned, in the meantime we had a number of most likely initial alignment related locklosses. They first occured in the CARM ASC engagement, and later even DRMI phase..
I did a full initial alignment, and also noticed that the QPD offsets on the red X TR photodiode offset was unreasonably high. I re-zeroed this offset.
With that the IFO saw a two Watts, DC readout for 2+h.
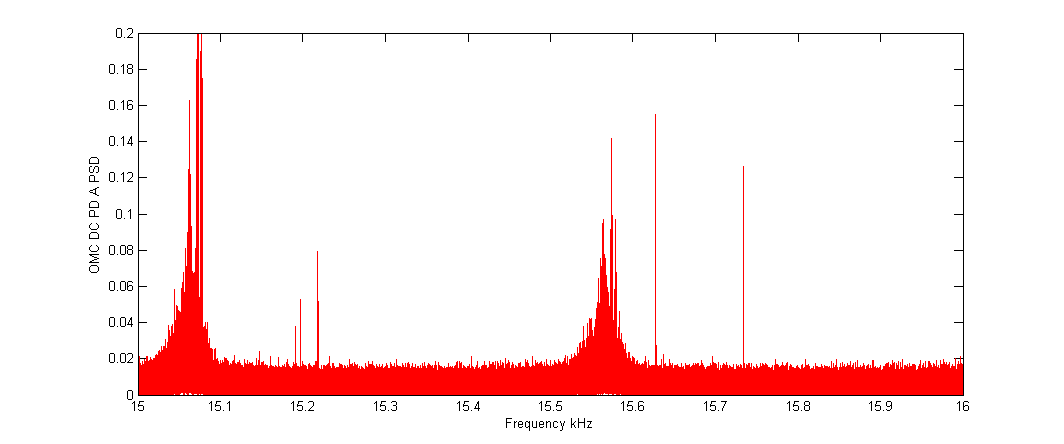
Next on the menu was more violin damping. I focused on EX, which currently has 3 moned intermingling; 505.587Hz, 505.707Hz and 505.710Hz.
505.587Hz: Damps with H1:SUS-ETMX_L2_DAMP_MODE1, FM1, FM4, gain=100.
The other two are simply too close to each other (beat signal of 5min!) - we need to damp with the same filter.. I focused on 505.710Hz., which is the big peak.
I deleted the narrow bandstop filters, and significantly widened the band-pass filter FM1, and tried with
505.710Hz H1:SUS-ETMX_L2_DAMP_MODE6, FM1, FM4, gain=200.
which seems to work.
The next mode (which actually grew while I paid attention to the other 3) is 507.194Hz, together with 507.159Hz.
507.159Hz seems to damp with H1:SUS-ETMX_L2_DAMP_MODE6 FM1 FM3 FM4, gain=50 (later gain=10). But currently 507.194Hz still bleeds through this filter, which makes it hard to damp.
I left 507.194Hz in H1:SUS-ETMX_L2_DAMP_MODE7 FM1, FM4 gain=50, which seems to provide a wee bit of damping.
After that, ITMY also needs more attention.
I leave the interferometer running at 2Watts - I would recommend focusing on getting the violins under control - they prevent other work.


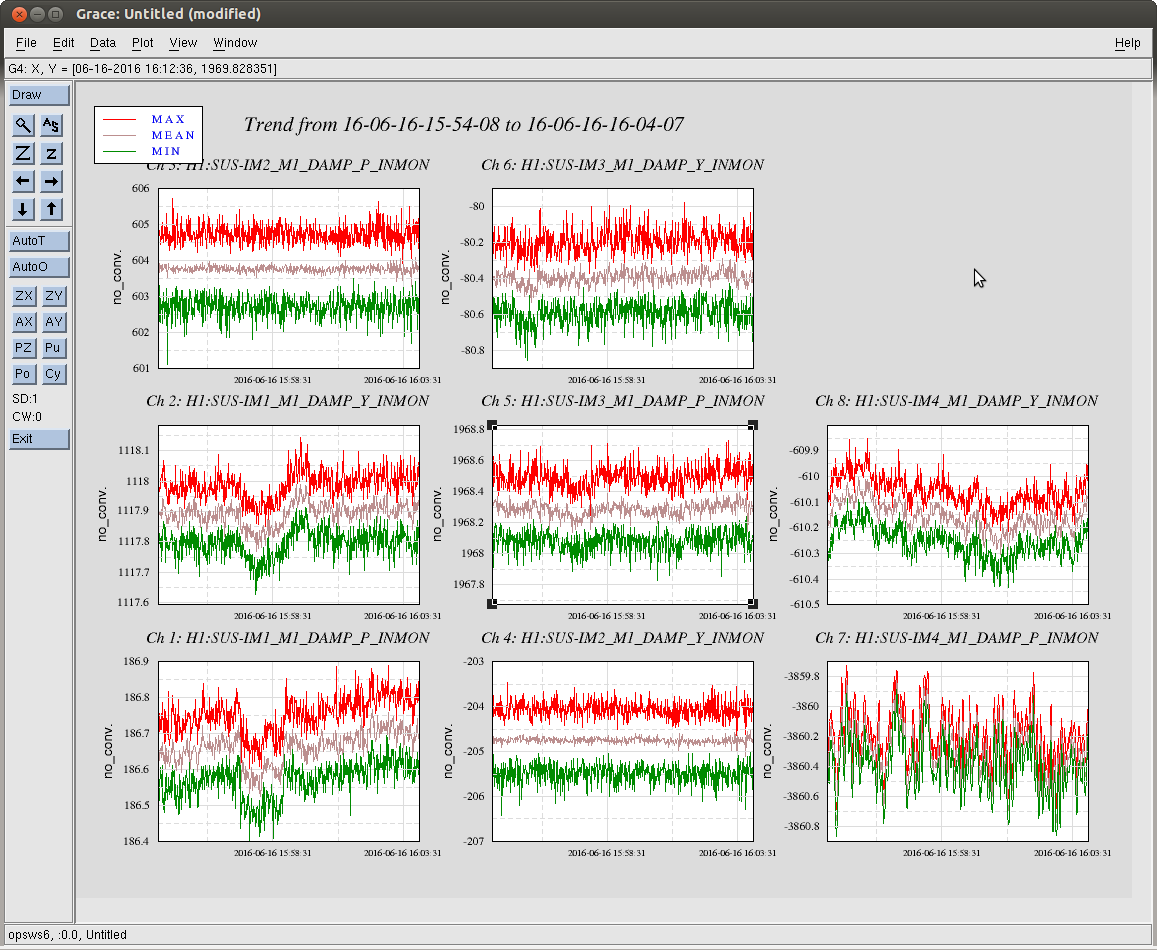

Seems like these things have been drifting over a long long time, see attached. Note that IMC WFS PIT and YAW signals are physically YAW and PIT on IOT2L, but PIT and YAW in chamber.
In the attached trend for 180 days, you can see that the WFS DC pointing was pretty well centered in YAW (PIT on table) and about 0.25 in PIT (YAW on table) until about 10-days after O1 concluded. There have been 5 distinct jumps since then and each step made the YAW (PIT on the table) centering worse.
It could be the loose periscope mirror on MC REFL periscope in HAM2 (alog 15650) but it's hard to say for sure.
Anyway, this means that the beam could be off on the MC length diode. If that's the case this should be fixed on the table, not by MC WFS picomotors.