Richard, Filiberto, Ed, Betsy
Following on from Andy's probing alog 27841 regarding funny looking OSEM spectra, today we looked into a few fishy signals. Based on spectra he took from before and after the early June power outage which show signal changes, he and Jenne identified the following set of problematic OSEM signals. I've annotated the list with status as to what we found or fixed today:
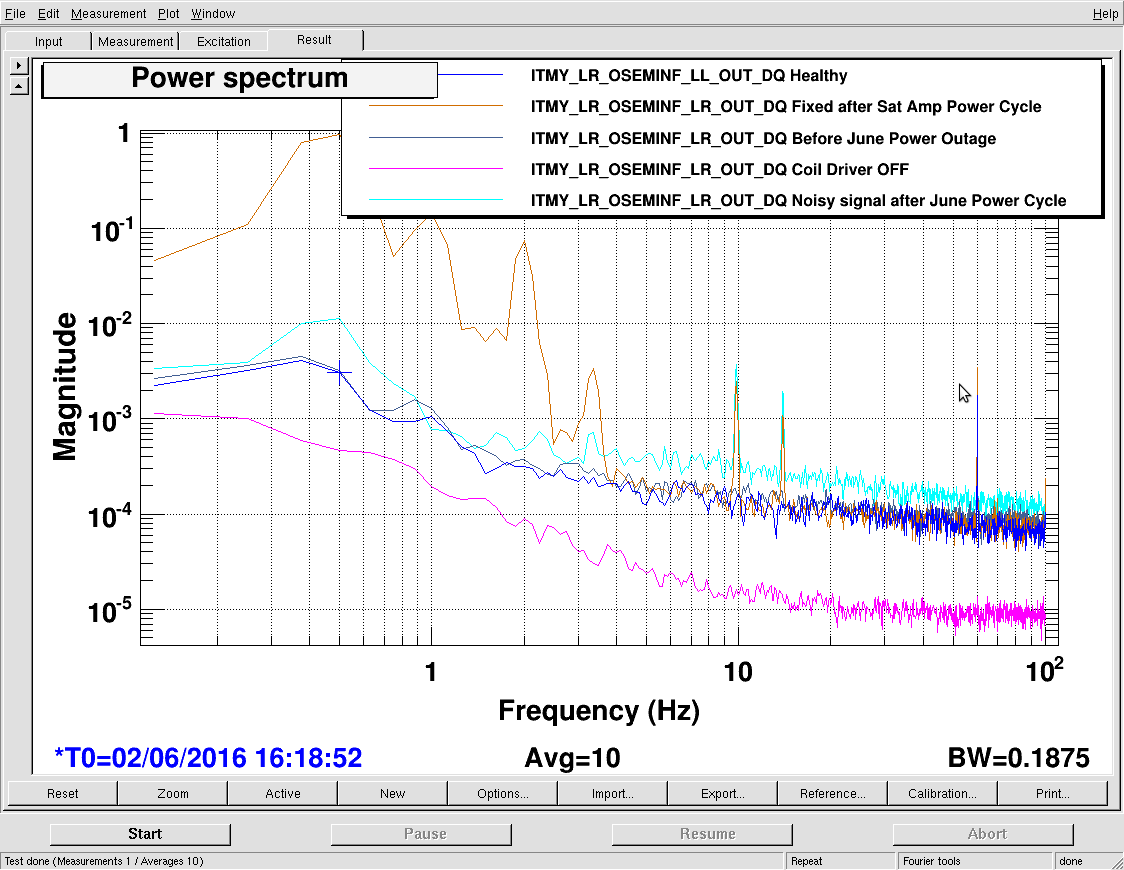
ITMY L2 LR - Fixed after power cycling the Satallite Amp box (see alog below)
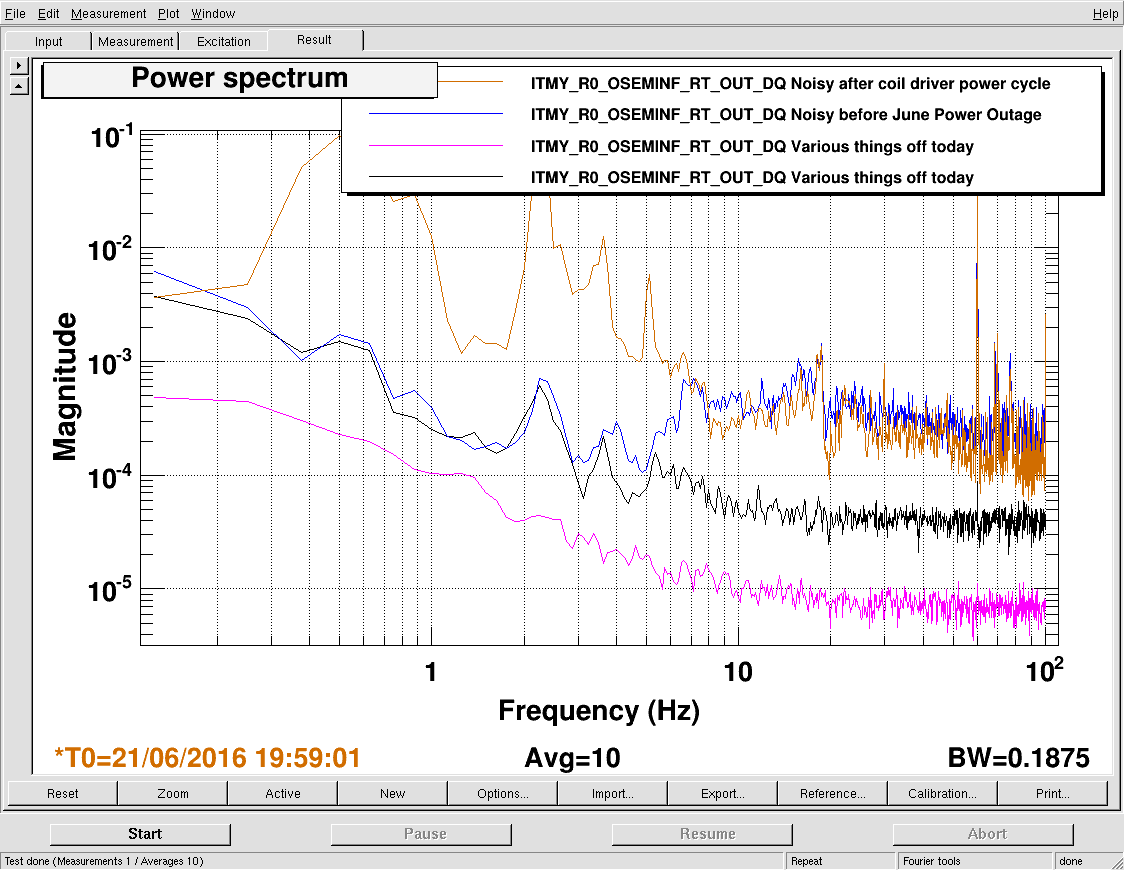
ITMY R0 RT - Signal looks funny before power outage, old problem, TBC...
MC1 M3 UL - Signal looks funny before power outage, old problem, TBC...
PRM M2 UR - Fixed after power cycling the Satallite Amp box (see alog below)
PR2 M1 T2 - TBC...
PR2 M3 UL - Giant nominal YAW Bias which has been on this SUS for over a year - very little signal on OSEM - mechanical fix when vent
PR2 M3 LL - Giant nominal YAW Bias which has been on this SUS for over a year - very little signal on OSEM - mechanical fix when vent
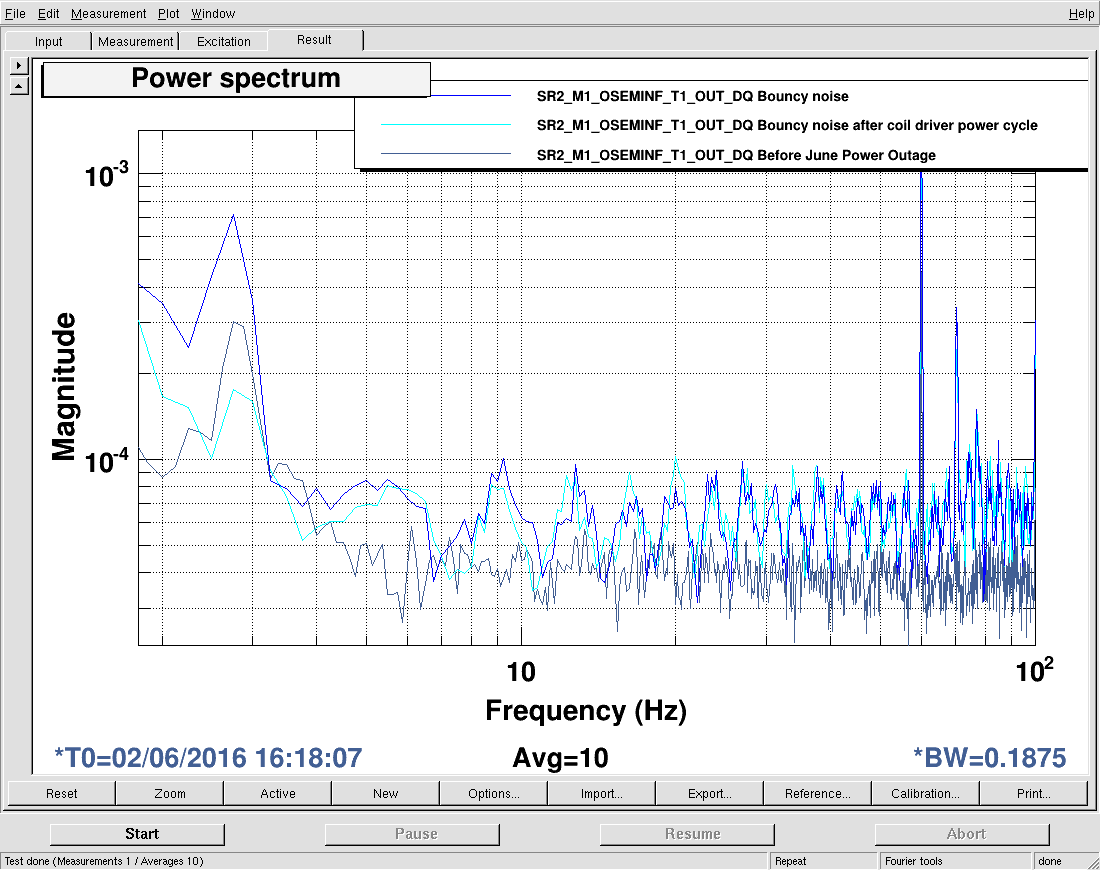
SR2 M1 LF - Funny comb feature, TBC...
SR2 M1 T1 - Funny comb feature, TBC...
SR2 M1 T3 - Funny comb feature, TBC...
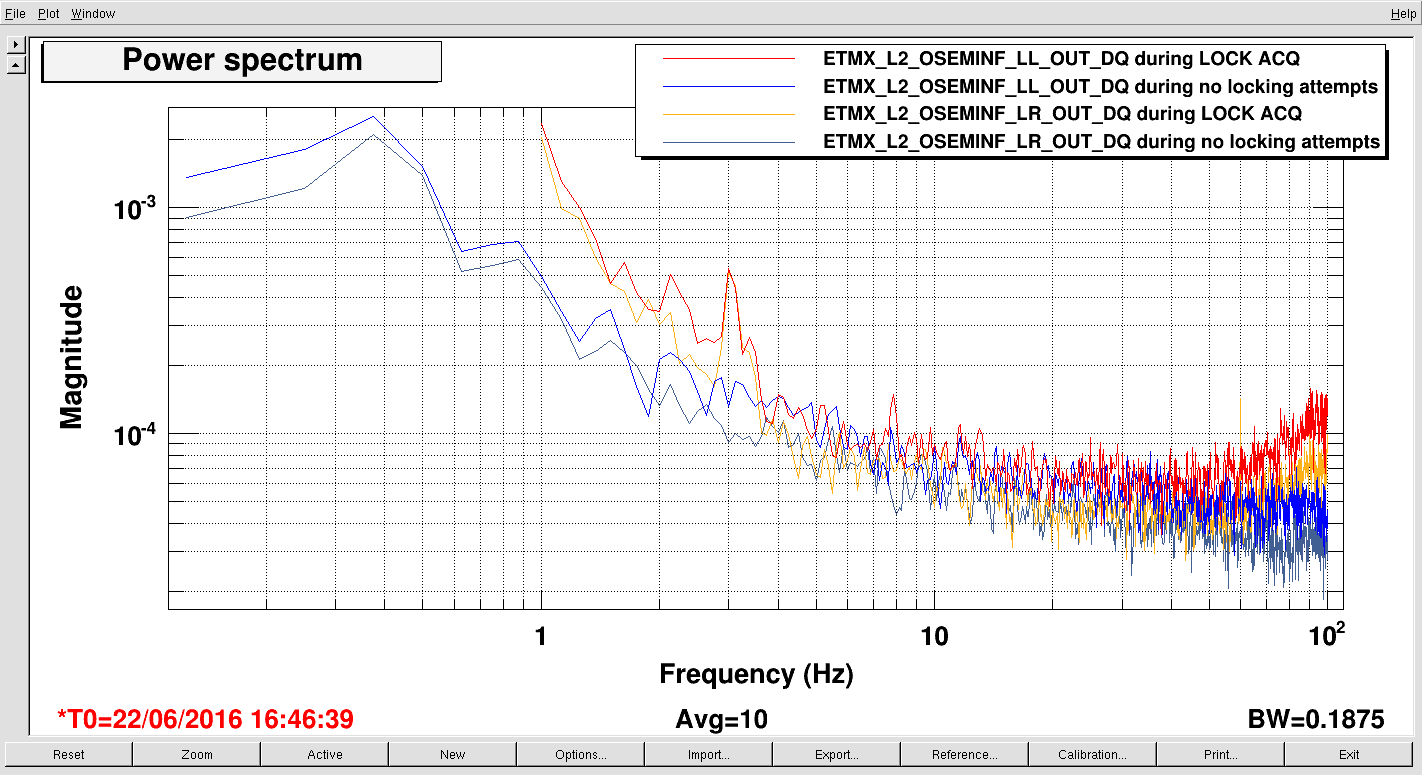
ETMX L2 LL - 50Hz turn up noise, TBC... Turn up is due to LOCK ACQ PUSHING, turn up not present during nominal SUS damping, no LOCK ACQ, see below plot
ETMX L2 LR - 50Hz turn up noise, TBC... Turn up is due to LOCK ACQ PUSHING, turn up not present during nominal SUS damping, no LOCK ACQ, see below plot
ETMX L2 UR - 50Hz turn up noise, TBC... Turn up is due to LOCK ACQ PUSHING, turn up not present during nominal SUS damping, no LOCK ACQ, see below plot
ETMY L2 UR - 50Hz turn up noise, TBC... Turn up is due to LOCK ACQ PUSHING, turn up not present during nominal SUS damping, no LOCK ACQ, see below plot
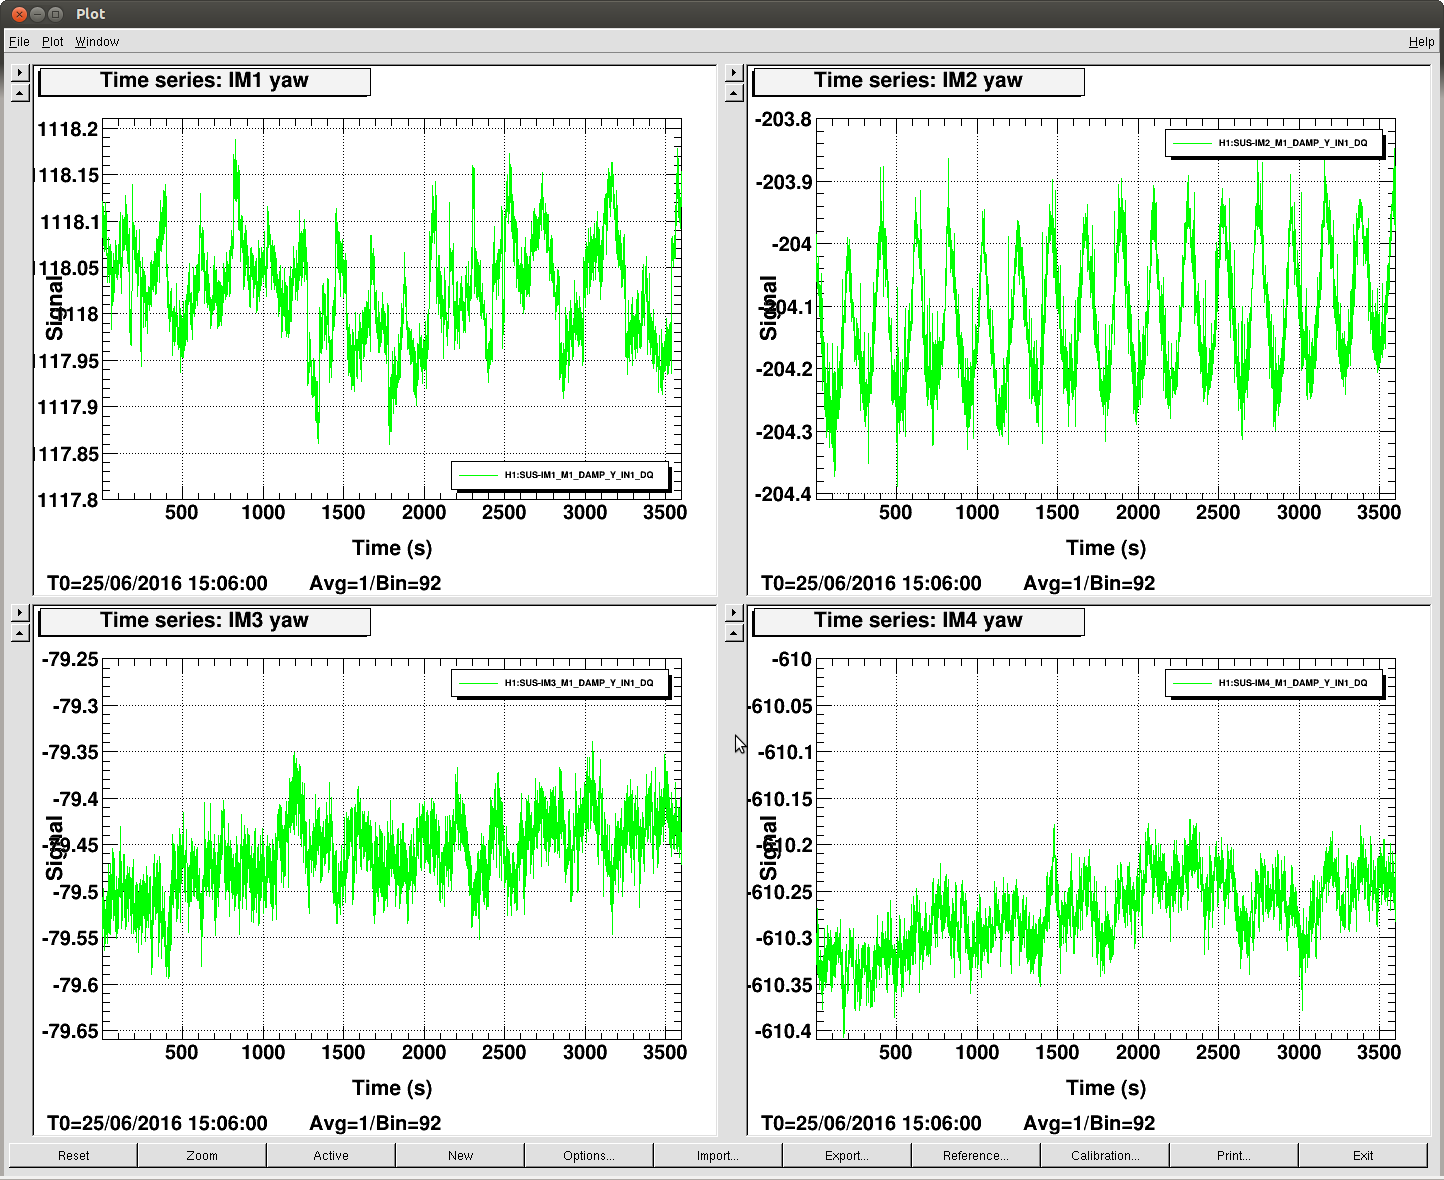
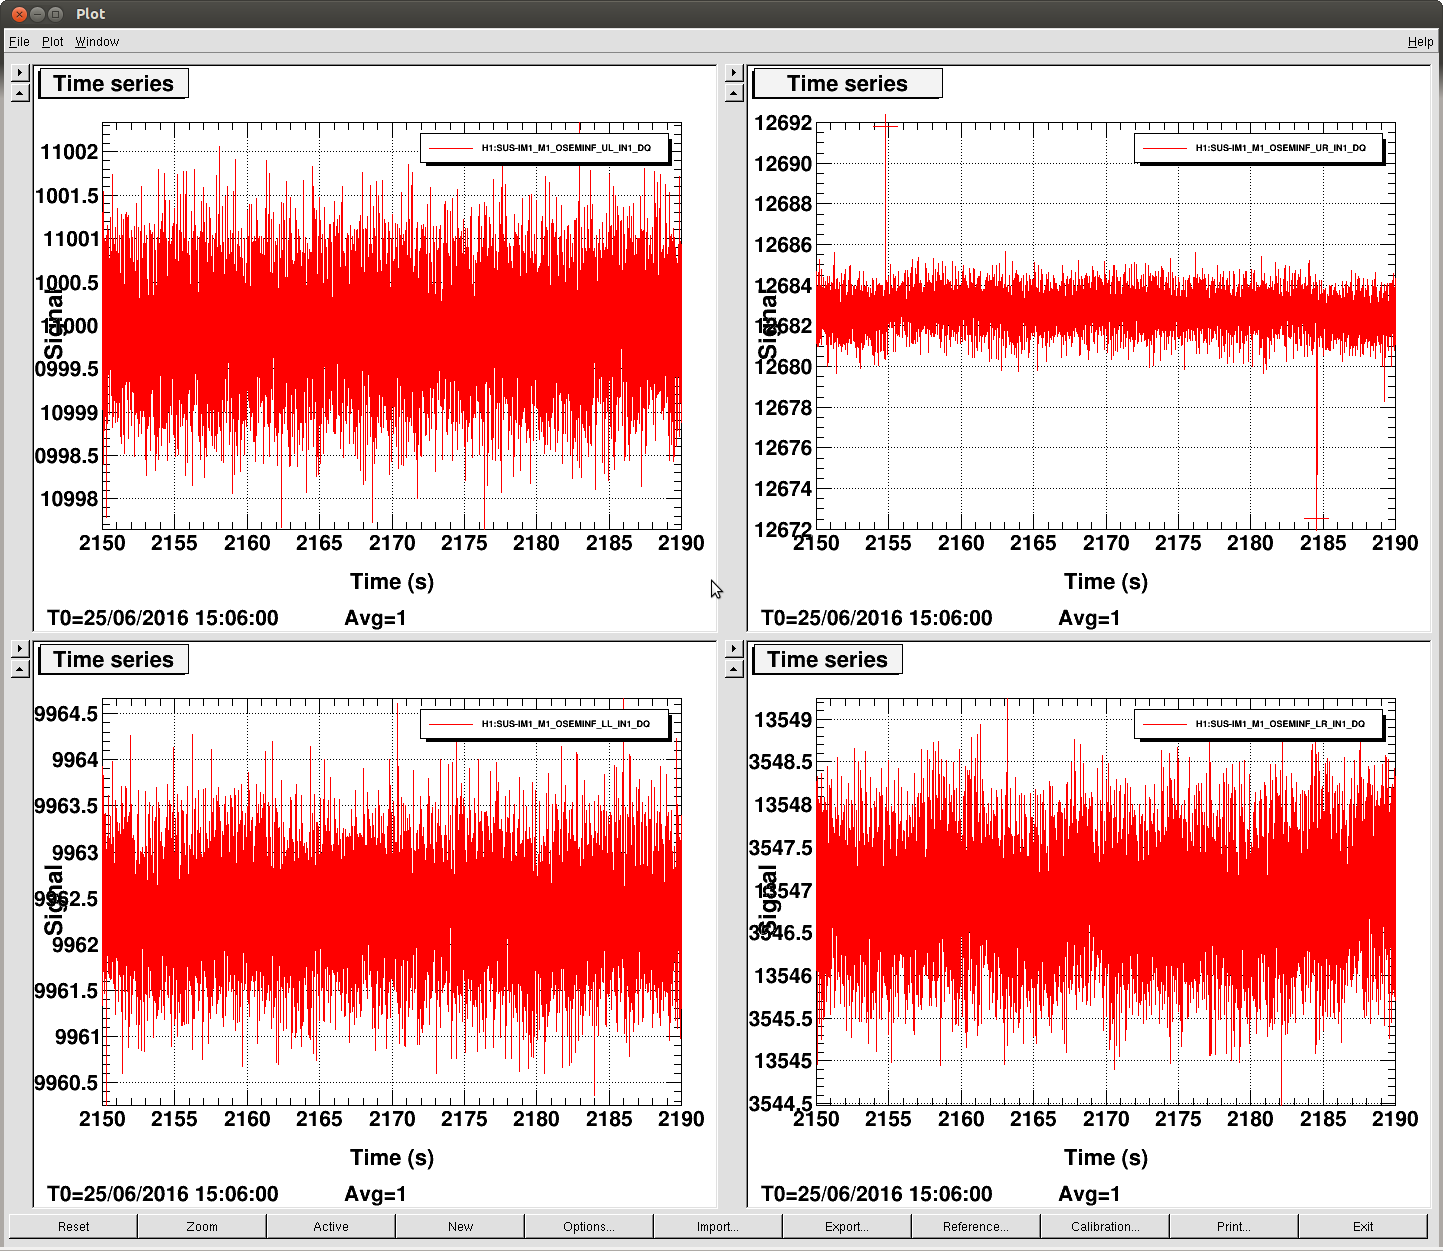
IM3 M1 LL - TBC...
We plan to pursue ITMy R0 and SR2 this week at next opportunity.