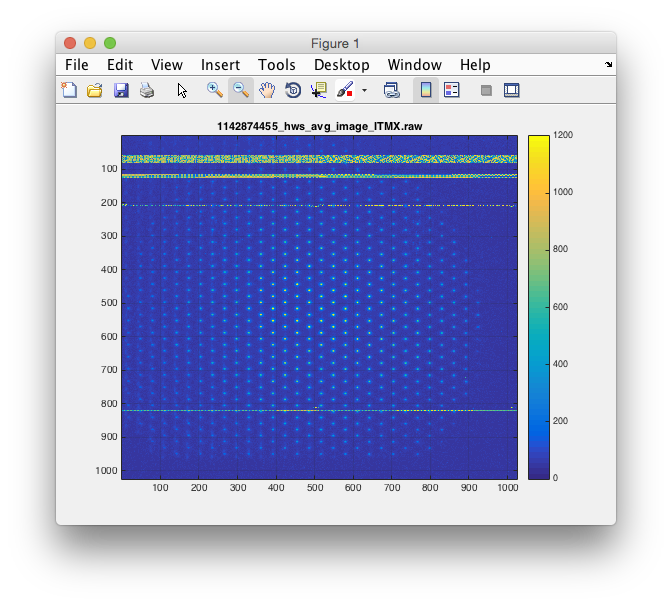
Attached is the whiteboard plan for tomorrow's Tuesday Maintenance period. Basically, we'll drop the lock first thing in order to misalign ETMs for an SRY characterization study, then roll through some ISS 2nd loop characterization. As shown on the whiteboard, people needing to go to the end stations should do so which the SRY study is going such that End station charge measurements can go on unadultured. After all of this, relocking will resume and commissioners will spend some time on jitter and upconversion studies. See picture for additional scheduled tasks.
Title: 10/19 OWL Shift: 23:00-7:00UTC (16:00-0:00PDT), all times posted in UTC
State of H1: Observation Mode at 75Mpc for the last 2+ hrs
Outgoing Operator: Patrick
Quick Summary: He had one lockloss, but brought it up right after that and has ben locked since. CW inj are on, wind is 15mph or below, useism ~0.1um/s.
Summary--Looks like both HAM2 and the ITMY STSs (STSA & B) have problems with their Y and X dofs respectively. The HAM5 unit is the one solid sensor but I wonder what it will look like if we moved it. Of course it would be that Robert believes the ITMY location in the BierGarten is the ideal place most free from tilt affects. The End sensors look okay but this is not a great way to compare. We need a good unit to move closer for comparison. We still have a unit at quanterra. Further, I'll seek out Robert's review for better scrutiny.
More detail:
Looking at the upper left graph, ASD of the Y dofs: Ham2 Y has elevated noise (WRT other units) from 3 down to 0.4 hz. It is also noisier below 90 mhz, I don't think that is tilt, others would suffer as well I'd think if it was.
At the lower left graph, the Y dof coherences further suggest Ham2 is under performing. The end station units coherence gets above 0.8 below 100mhz and thereafter follows the like coherence between ITMY & Ham5. That seems reasonable.
The middle column of plots for the X dofs suggests that the ITMY unit is not as healthy as the HAM2 or HAM5 around 100 to 300mhz. HAM2 looks much better for the X dof than the Y dof. The Ends X dof behaves much like the Y dof.
For the Z dof in the third column, while nothing jumps out in the spectra, the reduced coherence for the red & blue relative to the green trace suggests the ITMY Z is mildly ill. For the end stations in Z, it looks like tilt is plaguing things below 40mhz but this data is from 2am this morning and was not subject to much wind...So I'm not sure what to suggest there...
Evan and Sheila done Ran a2l script again
Adjusted ETMX in pitch and yaw to lock X arm on green Adjusted PSL diffracted power from 5.8% to 8.5% by changing REFSIGNAL from -2.00 V to -1.98 V. Ran a2l script. Holding off on going to observing mode to allow Sheila and Evan to perform scattering measurements on ISTC6. (WP 5566) Also tracking down SDF diff for H1:PSL-ISS_SECONDLOOP_SIGNAL. The setpoint has F10 ON and it is OFF.
Thank you, Jenne and Patrick for pointing it out.
Since the PID loop of the ISS is very slow (much slower than 1 Hz), I do not expect significant impact on the interferometer noise performance. Oops.
FM10 should be OFF. Kiwamu had Ed accept the SDF difference when it was ON. It is now OFF. Kiwamu has changed the SDF setpoint back to OFF.
20:54 UTC Betsy to LVEA to turn on CDS wifi for Evan and Sheila 20:55 UTC Kyle and Gerardo to mid Y for leak checking 21:11 UTC Betsy to LVEA to check on wifi/issue logging into computer 21:18 UTC Betsy back 21:29 UTC Evan and Sheila done ~21:52 UTC Kyle and Gerardo back 22:02 UTC Kyle and Gerardo heading back to mid Y
Cause yet unknown. SUS I_T_M_Y saturating (Oct 19 20:07:54 UTC) SUS M_C_2 saturating (Oct 19 20:07:54 UTC) SUS S_R_M saturating (Oct 19 20:07:54 UTC) DRMI Unlocked (Oct 19 20:07:54 UTC) Intention Bit: Commissioning (Oct 19 20:07:54 UTC) ISC_LOCK state: DOWN (Oct 19 20:08:05 UTC) SUS OMC SW watch dog tripped (Oct 19 20:08:16 UTC)
Still locked in observing at ~ 77 MPc. No changes in state. 15:02 UTC Jeff B. checking TCS chillers in mechanical building 15:16 UTC Jeff B. back 15:20 UTC Crew heading out to work on X arm concrete enclosure approximately four doors past mid X. 17:10 - 17:17 UTC Stepped out of control room ~18:39 UTC Corey in control room giving tour to two people
SudarshanK, TravisS
Travis and Darkhan took Pcal calibration measurements at the end station last week (alog 22489). Using the gps time information from that alog we have calculated the new pcal calibration factors. The summary is that the calibration at Y-End is pretty close to what we measure last time (Aug 27) however, the calibration at X-end, atleast for RxPD, has changed significantly due to clipping of one of the pcal beam. The clipping issue at X-end is discussed in detail on another recent alog by Rick (alog 22529).
Attached is the calibration factors from each endstation compared to the most recent calibration. This report includes the parameters used and relevant intermediate numbers as well. A summarized report of the final calibration numbers is uploaded to the DCC document (T1500252). The calculation of TxPD factor and its uncertainty on X-end will have to be done little differently in light of the clipping issue. For now, I just reported what is calculated by the old code but I will work on implementing a more accurate representation.
J. Kissel In order to get the latest updates to GWINC inspiral range calculation authored by John Miller and Salvo Vitale @MIT, I've updated the local checkout of gwinc on the workstations in /ligo/svncommon/IscSVN/iscmodeling/trunk/gwinc/ corner of the Isc SVN repo: /ligo/svncommon/IscSVN/iscmodeling/trunk/gwinc$ svn up A redshift_to_dist.m A dist_to_redshift.m U precompIFO.m U int73.m U gwinc.m U IFOModel.m A calculate_horizon.m A int73_FminsearchVersion.m U SourceModel.m U int73_GWINCV3.m Updated to revision 2719.
VAC: Continue leak checking at mid Y AUX cart is still running at end X
TITLE: 10/19 [DAY Shift]: 15:00-23:00 UTC (08:00-16:00 PDT), all times posted in UTC STATE Of H1: Observing @ ~ 76 MPc. OUTGOING OPERATOR: Jeff QUICK SUMMARY: From the cameras the lights are off in the LVEA, PSL enclosure, end X, end Y and mid X. I can not tell if they are off at mid Y. Riding out end of earthquake. Microseism has come down. Winds are less than 5 mph.
Activity Log: All Times in UTC (PT) 00:00 (00:00) Take over from Ed 10:53 (03:53) ETM-Y saturation 11:08 (04:08) ETM-Y saturation 12:37 (05:37) Reset timing error on ETM-X 15:00 (08:00) Turn over to Patrick End of Shift Summary: Title: 10/19/2015, Owl Shift 07:00 – 15:00 (00:00 – 08:00) All times in UTC (PT) Support: None needed Incoming Operator: Patrick Shift Summary: Quiet shift – IFO locked at LOW_NOISE for the past 10 hours. 80Mpc range. Intent Bit set to Observing all shift. Winds calm all night. Seismic activity low. There was a 5.8 mag EQ in the Philippines, R-Wave due at LHO ~14:43 (07:43). No apparent problems with the EQ at LHO.
A quiet shift for the first 4 hours. The IFO has been locked at NOMINAL_LOW_NOISE, 22.5W, 80Mpc for the past 6 plus hours. The Intent Bit is set to Observing. Wind and seismic activity are low. There has been one ETM-Y saturation during the shift.
During ER8, there was a calibration artifact around 508 Hz - a non-stationary peak with a width of about 5 Hz. The peak went away on Sep 14 16 UTC probably due to an update of the calibration filters which was documented in this alog. When re-calibrated data is produced, it's worth having a look at some of this ER8 time to check that the peak is removed. I made a comparison spectrum a bit before and after the change of the filters (plot 1). The wide peak is removed and the violin modes that it covers (ETMY modes, maybe some others) appears. I did the same thing for a longer span of time, comparing Sep 11 and Oct 17 (plot 2). The artifact manifests itself also as an incoherence between GDS-CALIB_STRAIN and OMC-DCPD_SUM (plot 3). The only other frequency where these channels aren't coherent is at the DARM_CTRL calibration line at 37.3 Hz. I've also made a spectrogram (plot 4) of the artifact. It has blobs of power every several seconds. The data now looks more even (plot 5), though it's more noisy because the calibration lines are lower.
I agree that it was due to bad digital filters in CAL-CS. See my recent investigation on this issue at alog 22738.
Title: 10/19/2015, Owl Shift 07:00 – 15:00 (00:00 – 08:00) All times in UTC (PT) State of H1: At 00:00 (00:00) Locked at NOMINAL_LOW_NOISE, 22.5W, 81Mpc. Outgoing Operator: Ed Quick Summary: Environmental conditions are good. IFO in Observing mode. All appears to be normal.
The LHO SEI team has known about a .6-ish hz peak on the HAM3 ISI for a long time (see my alog 15565, December of last year for the start, Hugh has a summary of LHO alogs in the SEI log for more). I was working with Ed on a DTT template for the operators when I noticed it was now gone. Very strange. Looking a little closer, it seems to have been decreasing over the last couple of days to a week, and disappeared completely this morning about 7-8:00 UTC. Attached spectra are from ~0:00 UTC (red) and ~16:00 UTC (blue, when I found it was missing). Looking at random times over the last week, it looks like it may have been trending down.
Could someone in Detchar look at this peaks longish term BLRMS, say over the last month, or even over the last year since we found it? Pretty much every sensor in that chamber saw this, but the GS-13s are the best witness.
I checked the coherence of H1:SUS-PR2_M1_ISIWIT_L_DQ with some PEM sensors for frequencies around 0.6 Hz.
Note - it reappeared for a few hours on Oct 13 - picture at https://alog.ligo-wa.caltech.edu/aLOG/index.php?callRep=22775
The attached plots show the inspiral range integrand, and cumulative integral, for a stretch of recent H1 strain data. This is just the standard integration of the strain noise power, weighted as (frequency)^(-7/3). I was also interested in the impact the 35-40 Hz calibration lines have on the range calculation, so the plots include a cumulative integral curve for which the calibration lines have been artificially removed from the strain spectrum (the strain noise in the 35-38 Hz band was replaced with the average strain noise at nearby frequencies). These curves (magenta) show that the calibration lines reduce the range calculation just a bit -- by just less than 1 Mpc.
The inspiral range for the spectrum used is 75 Mpc. 90% of the total is accumulated by 150 Hz; the second plot thus shows the same data from 0-150 Hz. At the lower frequency end, 10% of the total range comes from the band 16-26 Hz.
Hi Peter, Andy pointed me to this post, indicating that this result shows we might want to filter from lower frequencies in the PyCBC offline CBC search. However, when we run our own scripts to generate the same result we don't see nearly as much range coming from the 20-30Hz band. Instead, we see only ~1% of the inspiral range coming from this band. Initially Andy had a script that agreed with your result, however I've convinced him that there was a bug in that script. I think that it might be possible that the same bug is also present in yours. I've attached a python script and a PSD from that time that should generate a relative range plot. I hope that it is clear enough to check if your scripts are doing the same thing.
Yes, indeed my script was making the error you allude to -- thanks for the correction. The integrand curves in my plots are correct, but the cumulative integral curves are not -- see Alex's plots for those. The corrected statements for Oct 6 - now somewhat obsolete due to reductions in the ~300 Hz periscope mount peaks - are that 90% of the range comes from the band 47 Hz - 560 Hz. About 1% of the range comes from frequencies below 29 Hz.