Peter, Stefan
We read up on alog # 20699, indicating that the main problem during power-up is a change of the MICH ASC error signal. That alog suggested mixing in A36I, but back then AS_A_RF36 was phased differently.
Thus we looked at the MICH_P signal in AS_A_RF36, and indeed confirmed that the signal is now in Q, as expected.
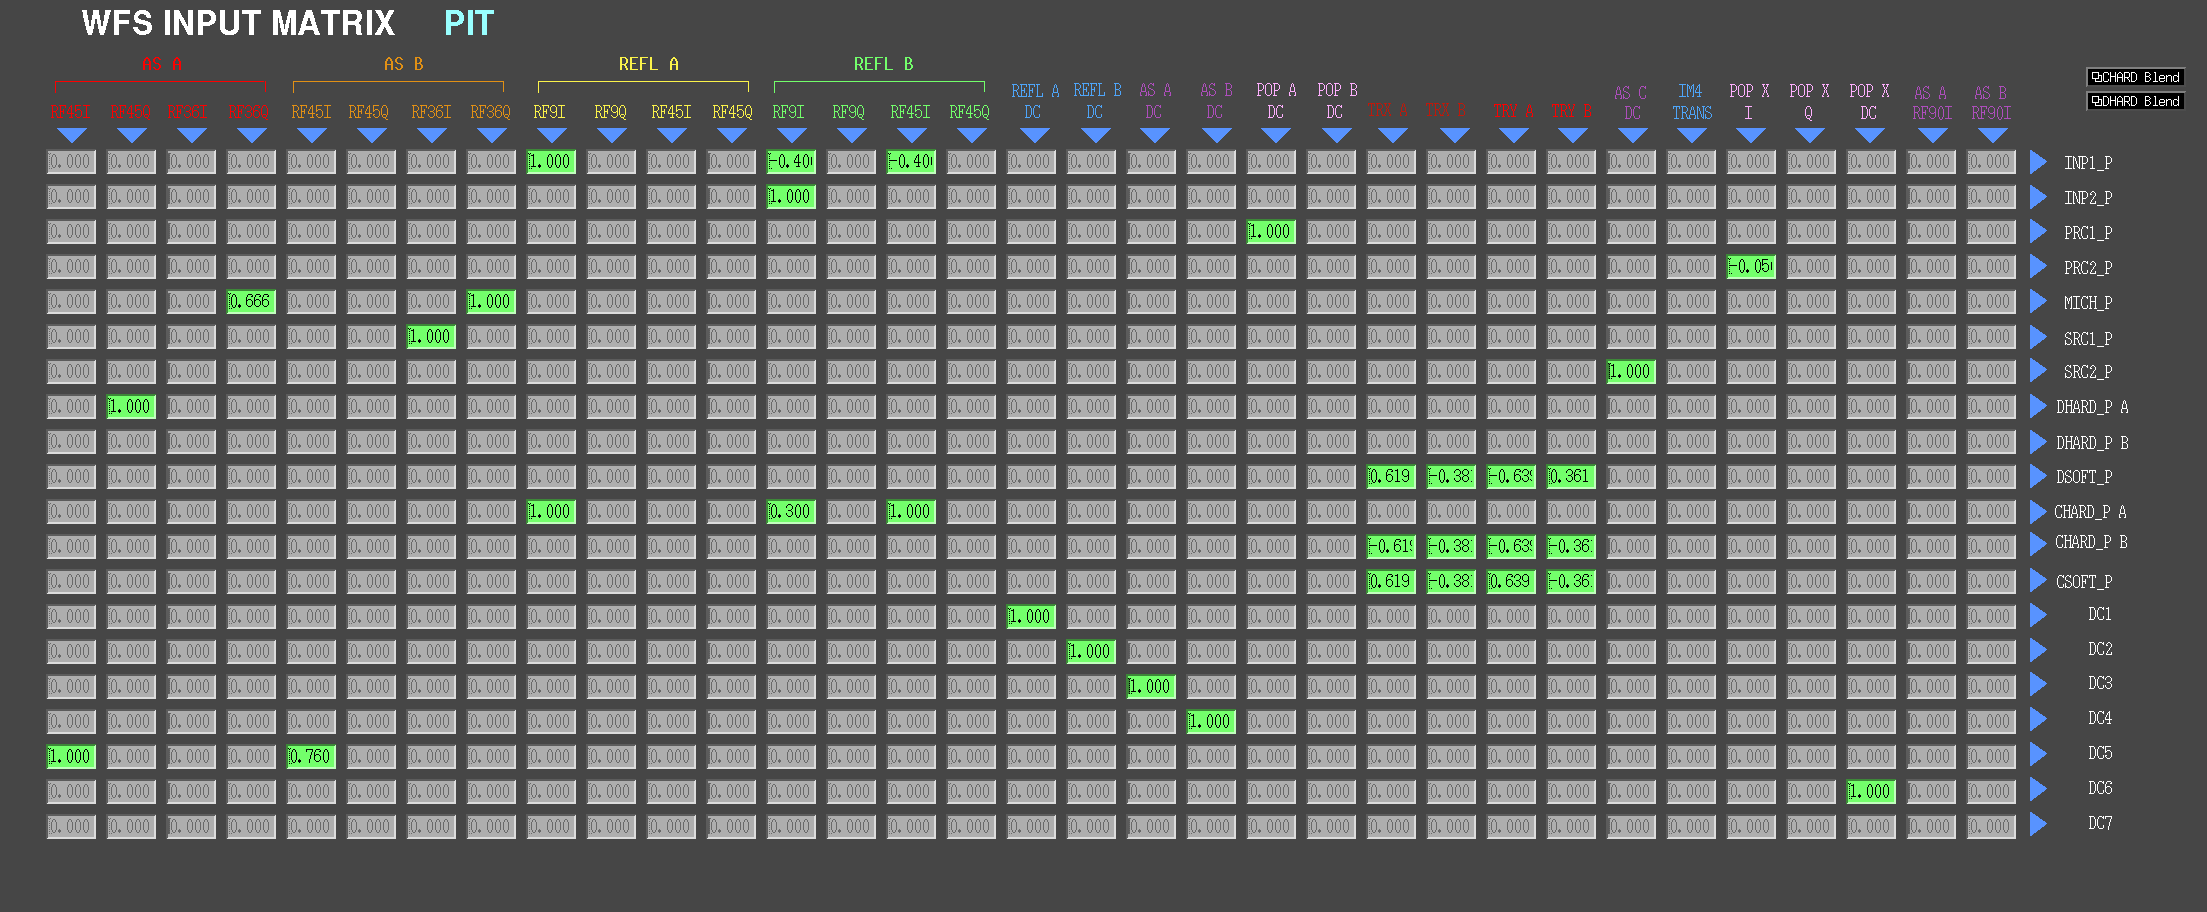
We thus set the following pitch matrix element for MICH:
ISC_library.asc_intrix_pit['MICH', 'AS_B_RF36_Q'] = 1 # reduce from 2 to 1
ISC_library.asc_intrix_pit['MICH', 'AS_A_RF36_Q'] = 0.666
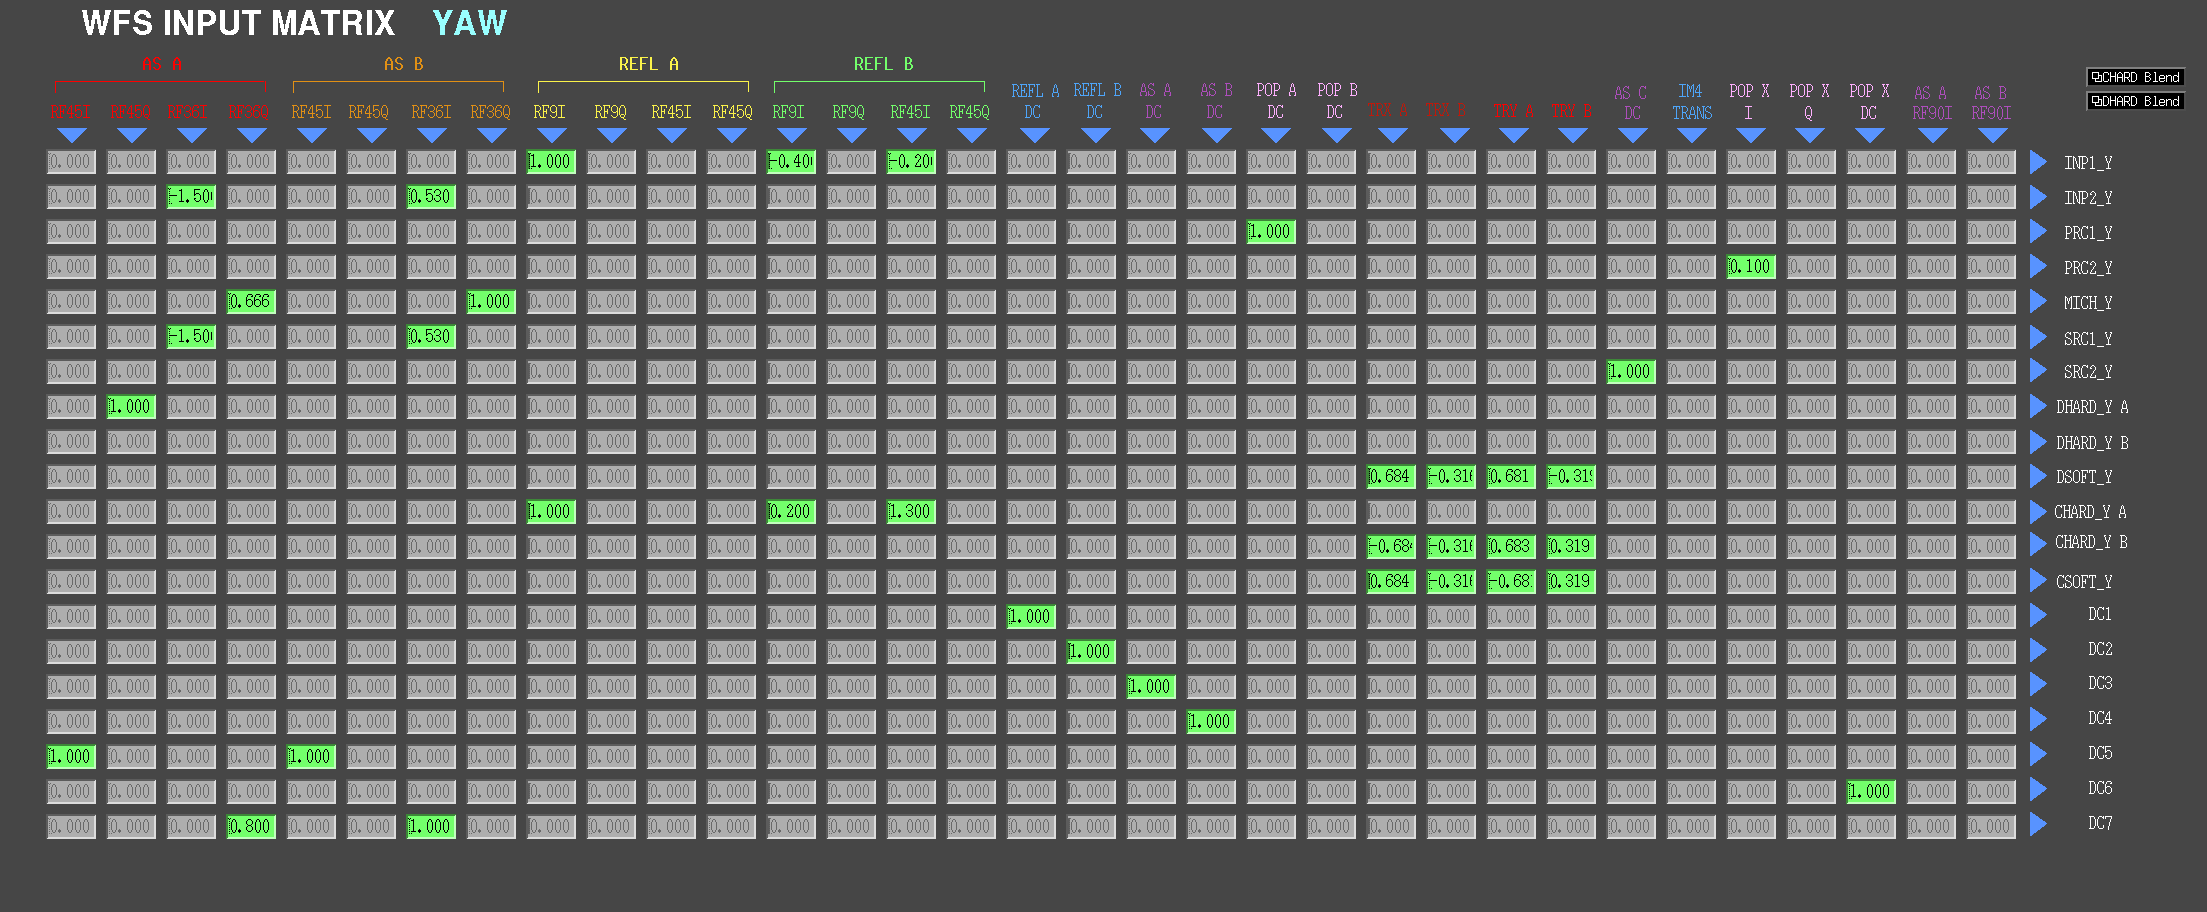
With this setting we noticed that MICH_Y was unhappy - in particular the AS_A_RF36_Q_YAW signal grew tremendously during power-up. We confirmed my moving the BS that the same error signal combination as for MICH_P also made sense for MICH_Y, i.e. we used the following yaw matrix element for MICH:
ISC_library.asc_intrix_yaw['MICH', 'AS_B_RF36_Q'] = 1 # reduce from 2 to 1
ISC_library.asc_intrix_yaw['MICH', 'AS_A_RF36_Q'] = 0.666
These settings are now in the Guardian (including setting them to 0 in the DOWN state).
For reference, for SRCL we are using the following error signals:
ezca['ASC-INMATRIX_P_6_3']=0 # off for now # AS_A_RF36_I
ezca['ASC-INMATRIX_P_6_7']=1 # good enough for now # AS_B_RF36_I
ezca['ASC-INMATRIX_Y_6_3']=-1.5 # AS_A_RF36_I
ezca['ASC-INMATRIX_Y_6_7']=1 # AS_B_RF36_I
We then noticed that the SRC1_Y top stage offloading resulted in a slow oscillation, indicating the the loop gain dropped enough to make the offloading oscillate. We have not fixed this in the Guardian yet.
We also used the TCS_ITMX_CO2_PWR and TCS_ITMY_CO2_PWR guardians to set the TCS power at 11W. This ramps the central heating down as the power comes up. This is currently only done in the guardian after the whole power-up is finished (i.e. in the COIL_DRIVER). For now, we did this by hand.
With this setting we were stably sitting at 11W until the 5.4 magnitude earthquate in Vanuatu hit.
=================================================================================
After the quake had settled down, we went to 23W, and noticed that SRC1_Y now would prefer a different error signal:
ASA36_I to SRC1_Y: -1.5 (was -1.5)
ASB36_I to SRC1_Y: 0.53 (was 1.0) # (not in guardian yet)
We noticed that for large SRC1_Y offsets AS36_I seems to turn around - during one lock we even were able to keep it locked with opposite gain, al;though the sideband buildups were worse.
We also set
H1:TCS-ITMX_CO2_LSRPWR_MTR_OUTPUT = 0.2 # (not in guardian yet)
H1:TCS-ITMY_CO2_LSRPWR_MTR_OUTPUT = 0.0 # (not in guardian yet)
this slightly improved the sideband buildups.
We left it locked atr 25W to damp the violin modes out over night. Attached are screen shots of the ASC input matrix.
An example of how to follow along at home, and how you can access the matrix elements a little cleaner using the guardian interactive shell:
servo:~ 0$ remote_epics -u jameson.rollins lho
IFO = H1
ifo = h1
SITE = LHO
site = lho
GATEWAY = lhoepics.ligo-wa.caltech.edu
jameson.rollins@lhoepics.ligo-wa.caltech.edu's password:

Connection to lhoepics.ligo-wa.caltech.edu established
Searching for a free port to use for EPICS CA transport
The script will randomly select some ports in an attempt to find
an available network port to send the EPICS data over.
Attempting to use port 27963 for EPICS
Forward attempt 1

Launching bash shell setup to access EPICS at LHO.
Use the 'exit' command to return to your regular environment.

servo:~ 0$ guardian -i ISC_LOCK
--------------------
aLIGO Guardian Shell
--------------------
ezca prefix: H1:
system: ISC_LOCK (/home/jrollins/ligo/src/userapps/isc/h1/guardian/ISC_LOCK.py)

MANAGER SYSTEM:
  nodes = NodeManager(['ALS_COMM', 'OMC_LOCK', 'LASER_PWR', 'ISC_DRMI', 'TCS_ITMX_CO2_PWR', 'TCS_ITMY_CO2_PWR', 'ALS_DIFF', 'ALIGN_IFO', 'ALS_YARM', 'SEI_BS', 'IMC_LOCK', 'ALS_XARM'])
Type 'nodes.init()' to initialize.

In [1]: ISC_library.asc_intrix_pit['SRC1', 'AS_A_RF36_I']
Out[1]: 0.0

In [2]: ISC_library.asc_intrix_pit['SRC1', 'AS_B_RF36_I']
Out[2]: 1.0