Bad PEM corner station MAG and MIC channels
Richard, Fil, Robert, Dave:
We found that all the MAG and MIC corner stations channels have not been correct since the power recovery Mon 6/6. These channels span several ADC cards, so it did not look like a software issue. However to rule this out we power cycled h1oaf0, its IO Chassis and the PEM AA chassis with no change to the signals. Problem was identified as two DC power supplies which needed to be turned on after the outages (18V for MAG, 36V for MIC). Robert confirms these channels are now good. We are still unsure why all the MAG and MIC channels read about 3000 counts on the IOP and not zero, we may investigate further next Tuesday.
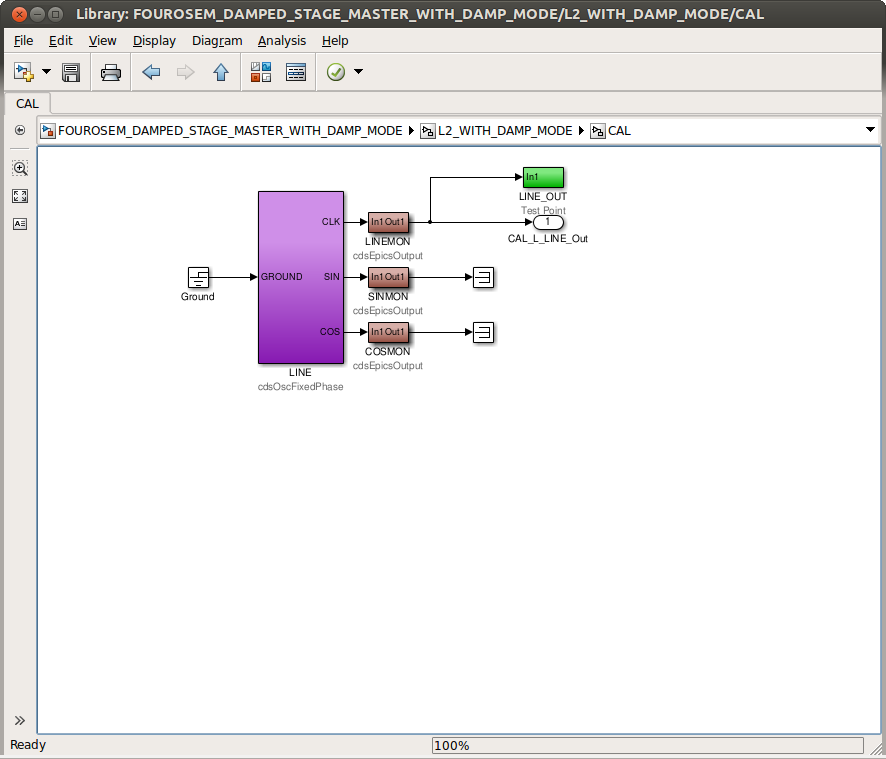
h1calcs new code
Joe, Jeff, Dave:
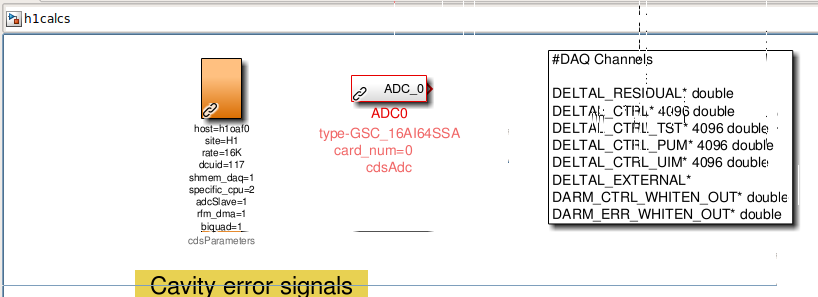
new h1calcs model went in. Some channels were promoted from standard single precision floating point to the new double precision floating point data type. The RCG appends the suffix "_DBL_DQ" to these channels, compared with "_DQ" for standard chans. The channels changed are:
[H1:CAL-DARM_CTRL_WHITEN_OUT_DBL_DQ]
[H1:CAL-DARM_ERR_WHITEN_OUT_DBL_DQ]
[H1:CAL-DELTAL_CTRL_DBL_DQ]
[H1:CAL-DELTAL_CTRL_PUM_DBL_DQ]
[H1:CAL-DELTAL_CTRL_TST_DBL_DQ]
[H1:CAL-DELTAL_CTRL_UIM_DBL_DQ]
[H1:CAL-DELTAL_RESIDUAL_DBL_DQ]
Initially H1:CAL-DELTAL_EXTERNAL was made double, but this meant the DTT display on the control room TV stopped working, this channel was then reverted to single precision.
ETMY Hardware Watchdog
Jim, Dave:
To verify the HWWD software is running, I pulled out the top monitor cable on the front panel of the EY HWWD unit. The LED fault light came on, showing that the software did start after the power outage.
DMT broadcaster channel configuration
Joe B, Maddie, Dave
Joe and Maddie requested some channel additions/removals from the DMT channel list, these were installed.
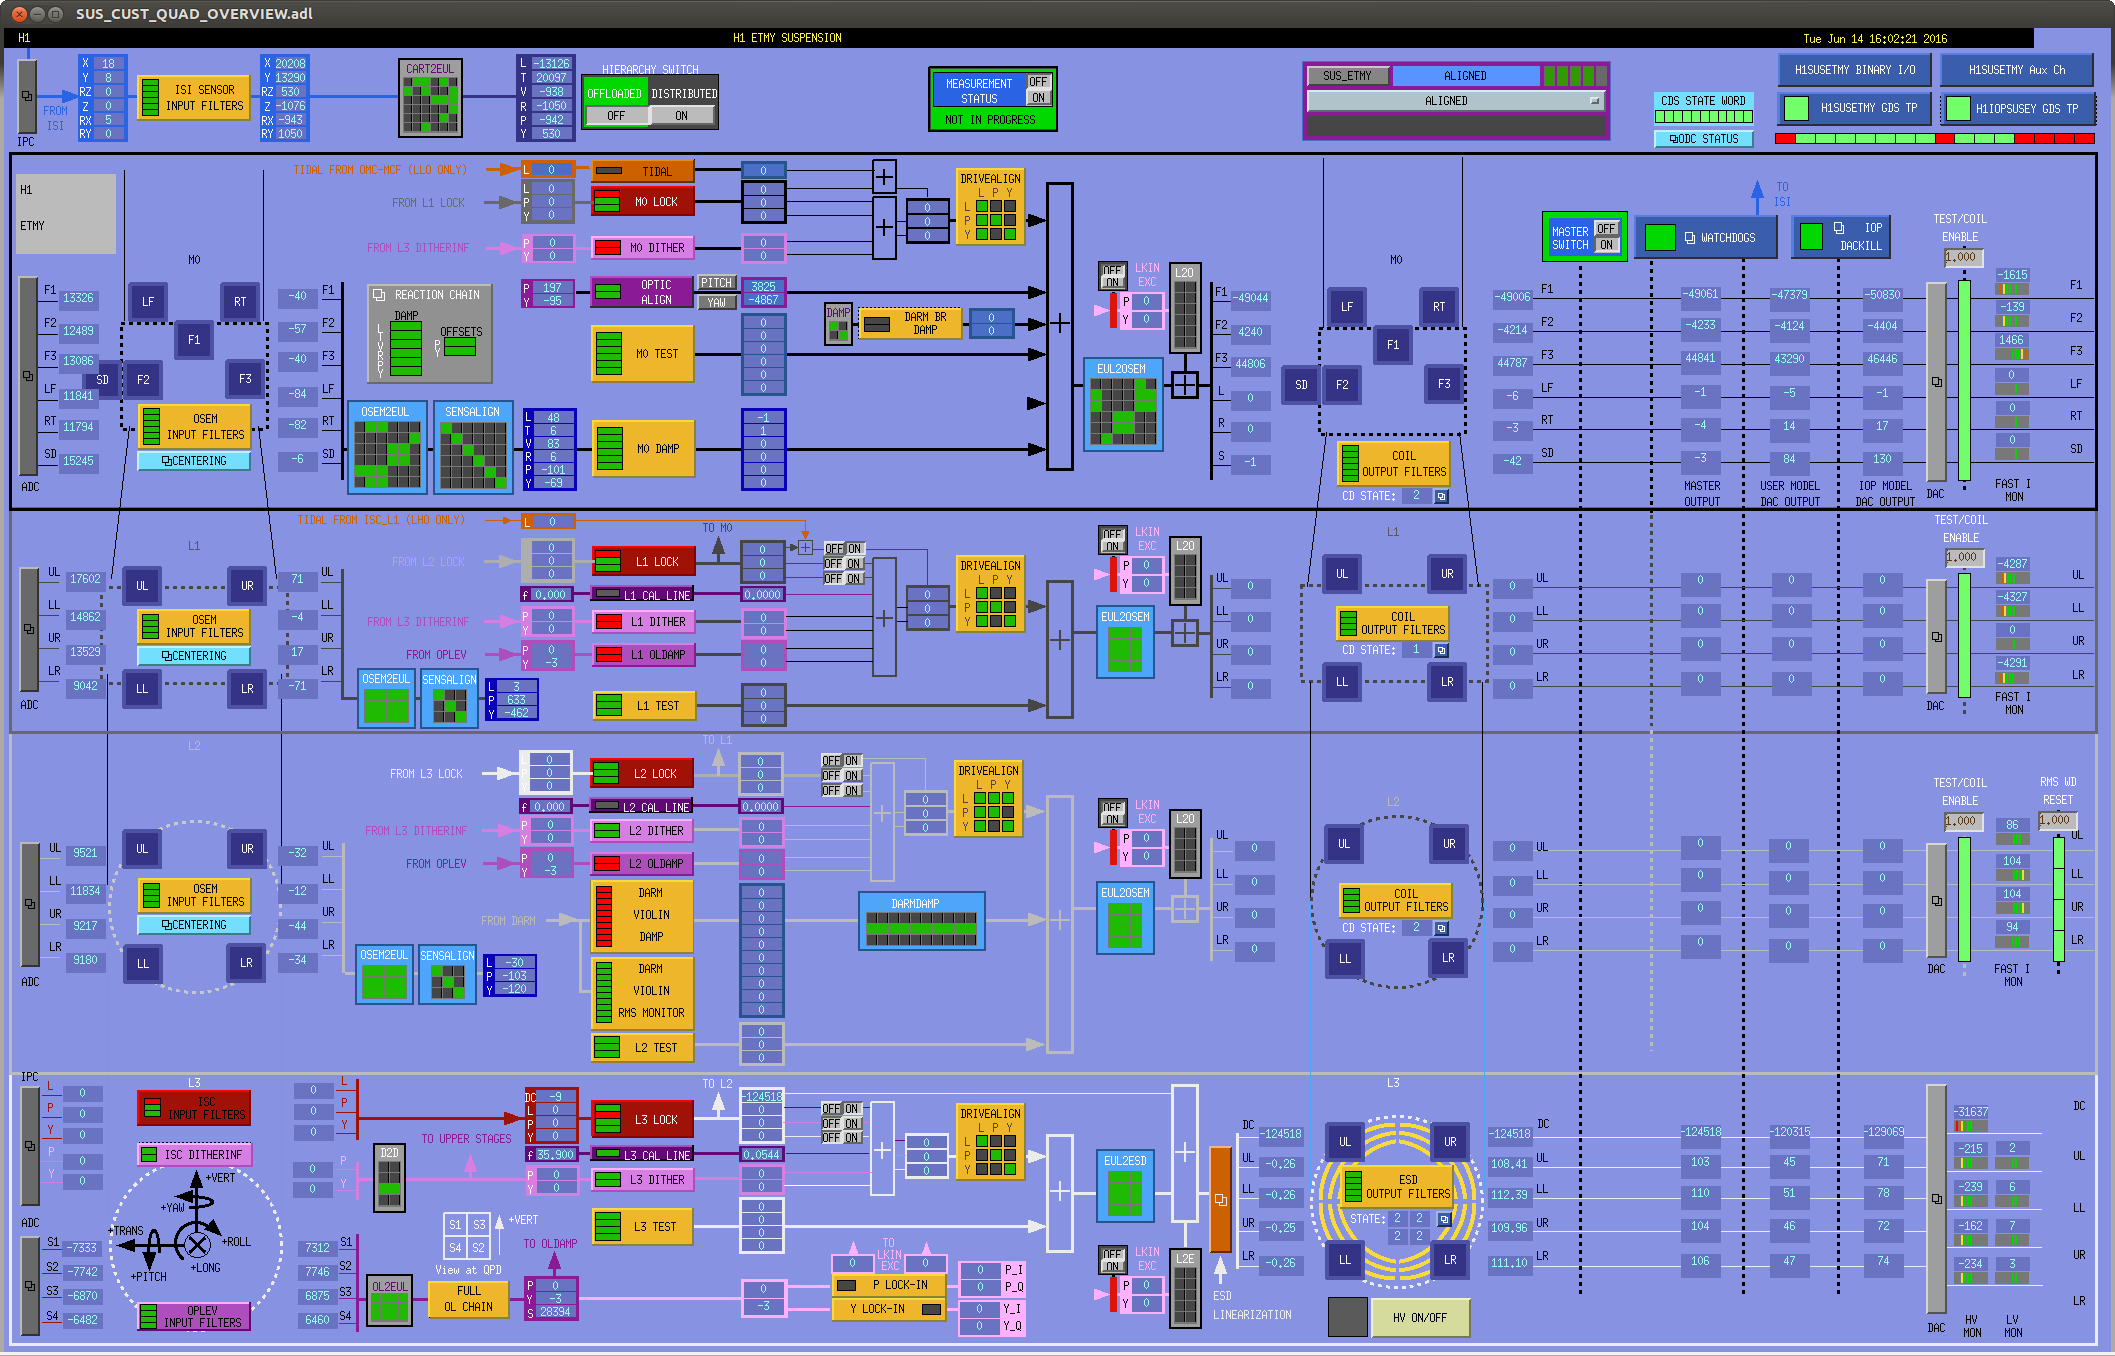
QUAD_MASTER change
Jeff
h1susetmx,y were restarted against a change to the QUAD_MASTER.mdl file. Next Tuesday QUAD_ITM_MASTER.mdl will be modified and the itm models restarted.
Resync of atomic clock to NTP GPS receiver
Jim:
Following the power outage, Jim re-synchronized the atomic clock to the 1PPS signal coming from the NTP GPS receiver. This provides an independent timing of the Timing Master.