Ross, Terra, Carl, Tega, Jim, Dave, Matt, Ed, Daniel.
In this alog we report on some of the simulink model changes made in relation to PI work carried out at LHO during the period spanning April to 10th of June.
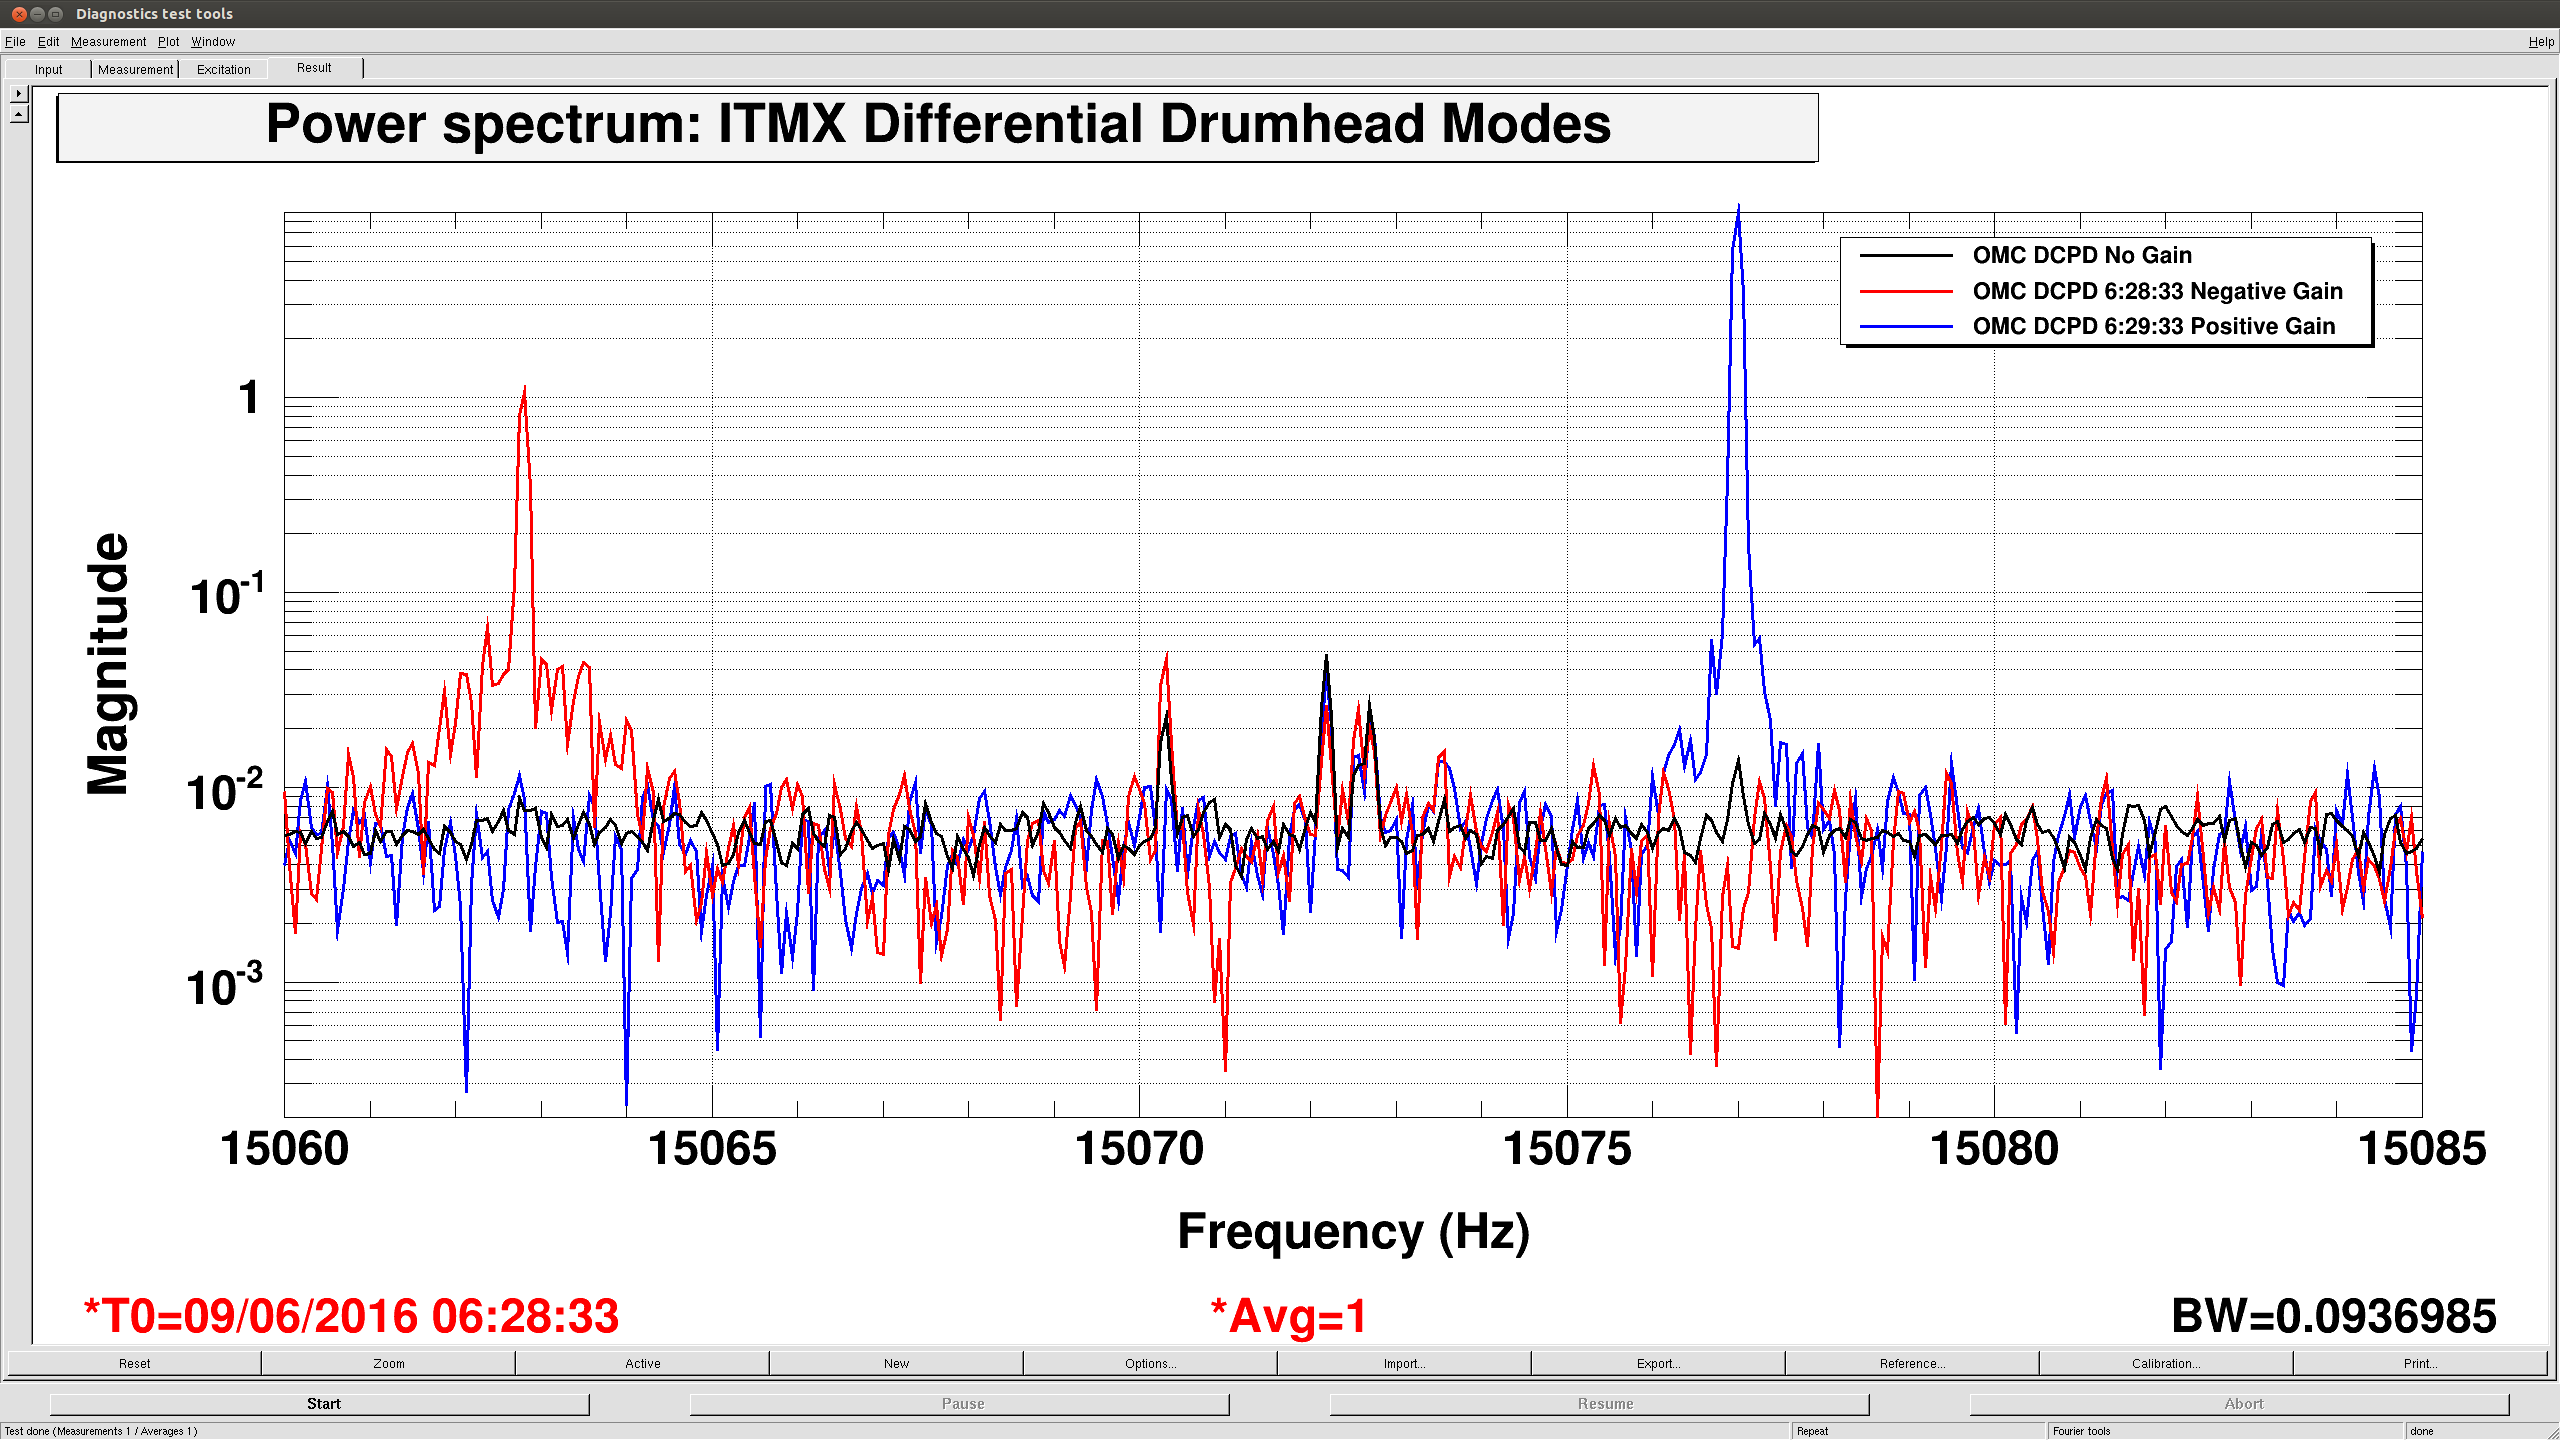
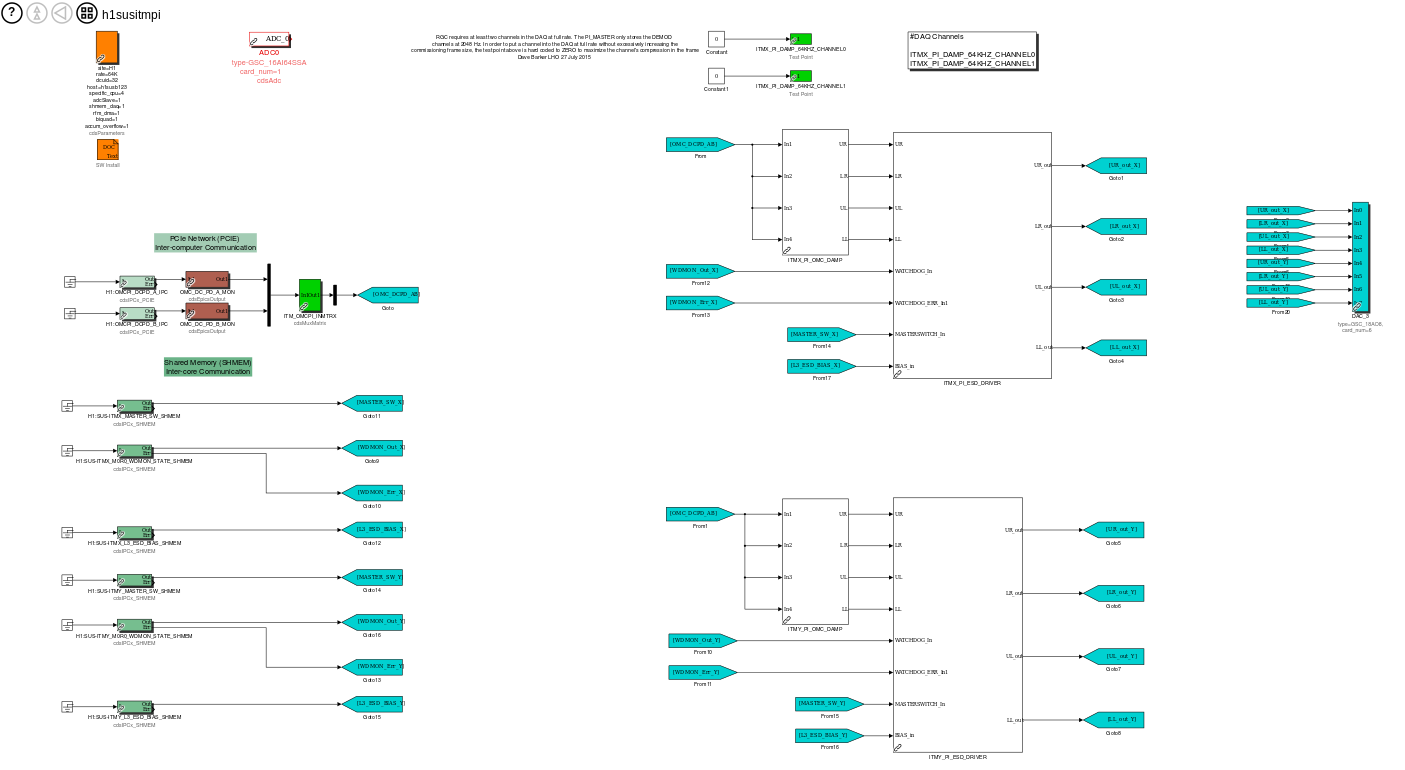
We currently have two possible error signals for PI damping: the trans-QPDs and the OMC DCPD signals. The trans-QPD signal is more readily available to drive the ETMs, whereas the OMC DCPD signal is more readily available to the ITMs. Since the OMC DCPD signal has a better SNR compared to the trans-QPDs, it can be used to monitor the modes lines before they ring up. The main limitation of the OMC error signal lies with fact that its fidelity may change with better alignment of the X- and Y-arms.
There are currently three different strategies for PI damping in the suspi models, all of which have been implemented in the end station suspi models (h1susetmxpi and h1susetmypi).
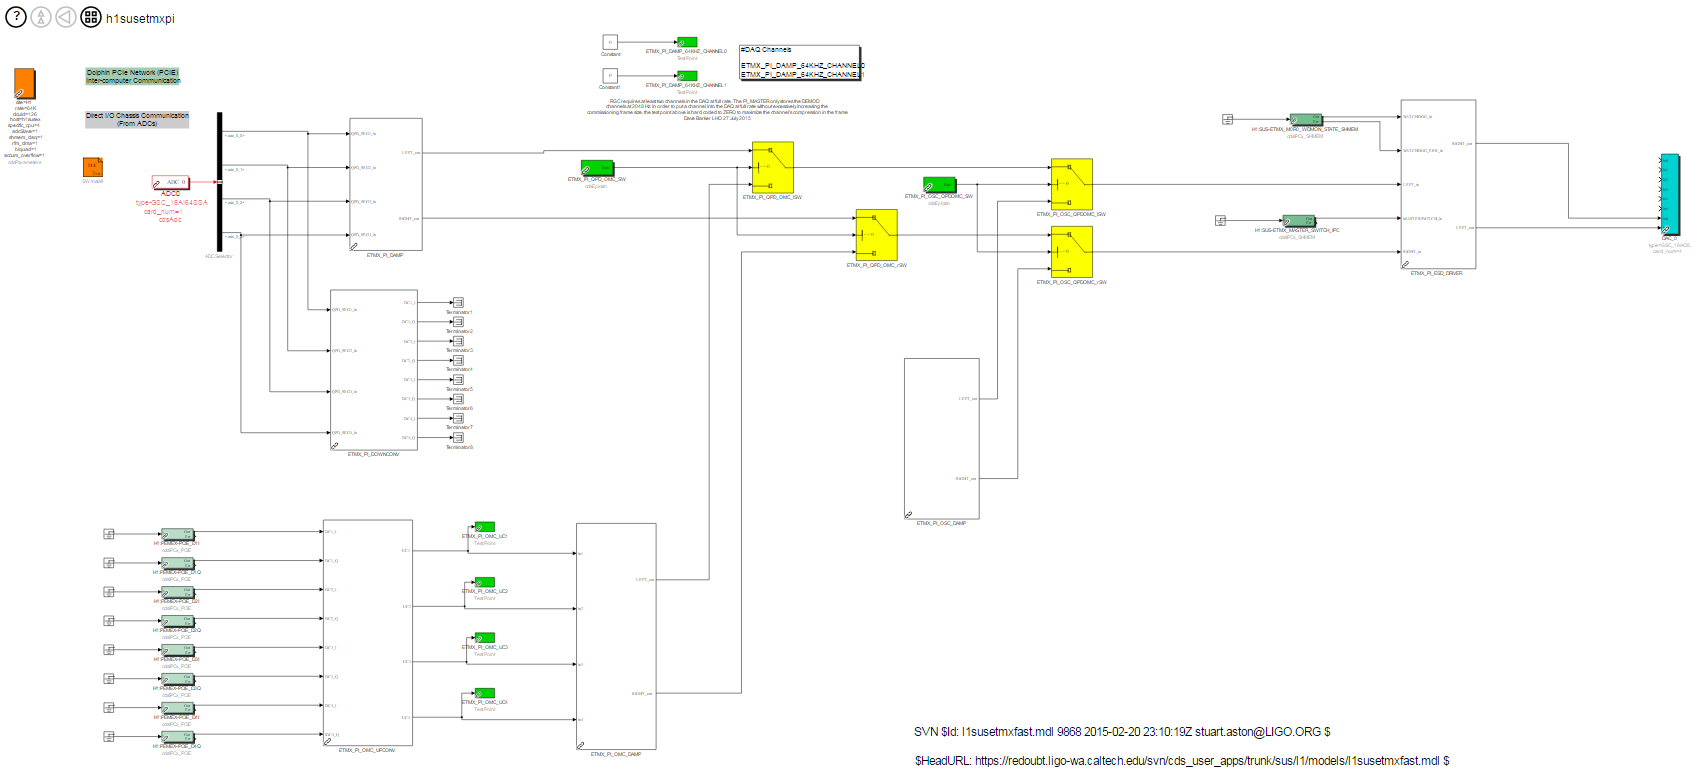
The first takes data from the trans-QPDs, processes the data using a band-pass filter and a PLL (iWave) and sends the output to the ESD driver. This is the top-left block in the suspi models called "ETMX_PI_DAMP". It comprises 8 modes blocks each one of which contains an IWave PLL block for dynamic line tracking. The down-conversion block immediately below the trans-QPD mode block provides the means for sending the trans-QPD signals to the corner station (the data transfer for this has not been implemented yet).
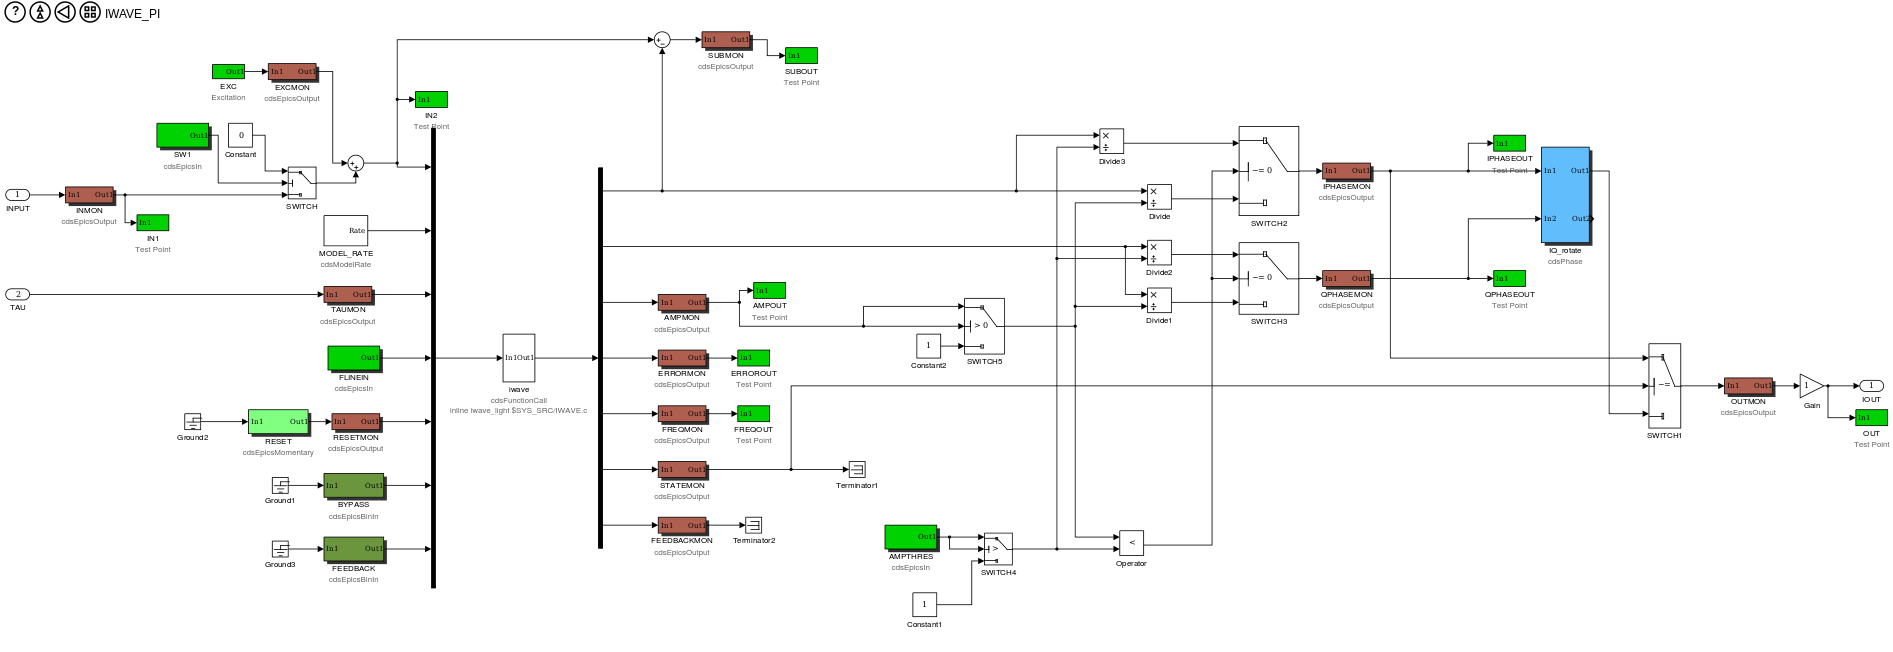
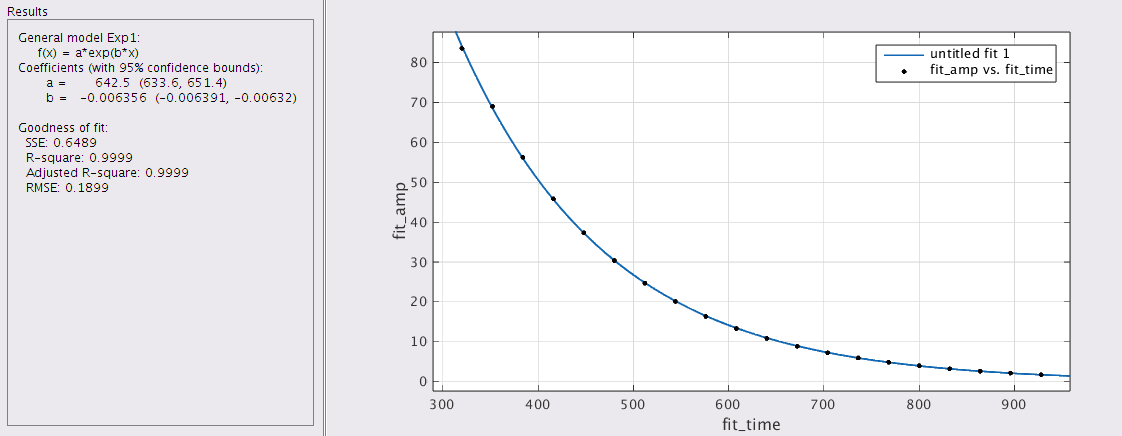
We have also adapted the iWave line tracker to PI damping. The simulink model shown below provides the means for the user to enter a threshold value above which the we maximally damp and below which we damp proportionally. There is also a modified IWAVE_AMPCTRL block (in userapps/sys/common/models/IWAVE.mdl) that damps the mode to a manageable level that is again specified by the user so that we can continuously monitor the mode power in the error signal. This block is not currently deployed but should be amongst several variations of PI damping to be tested in the future in order to down-select to the best configuration.

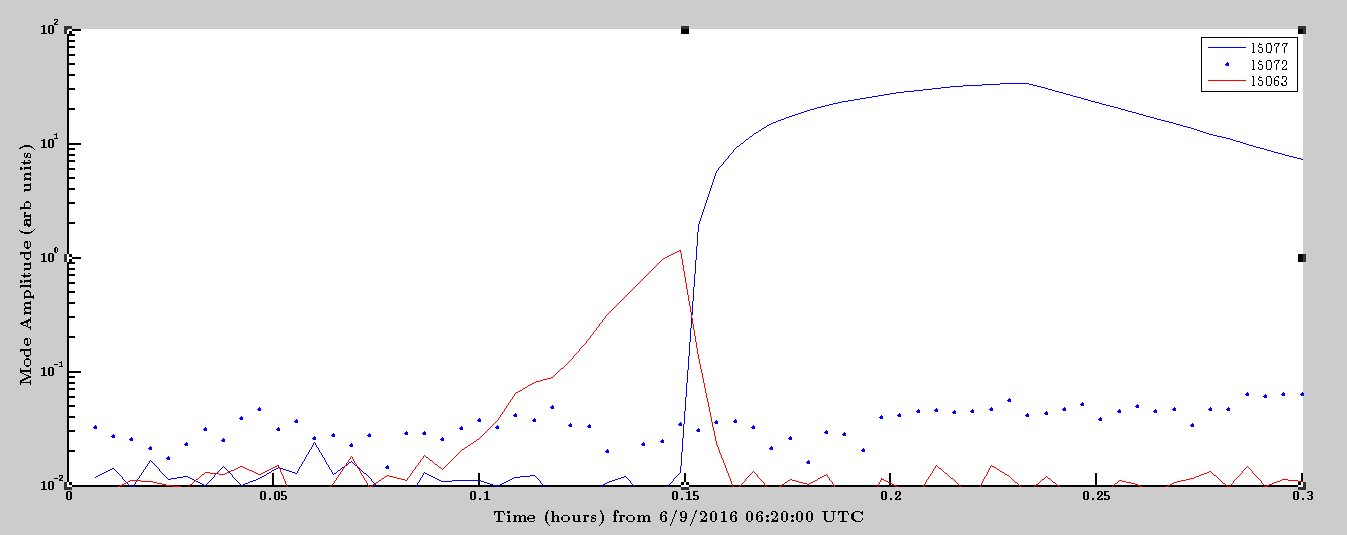
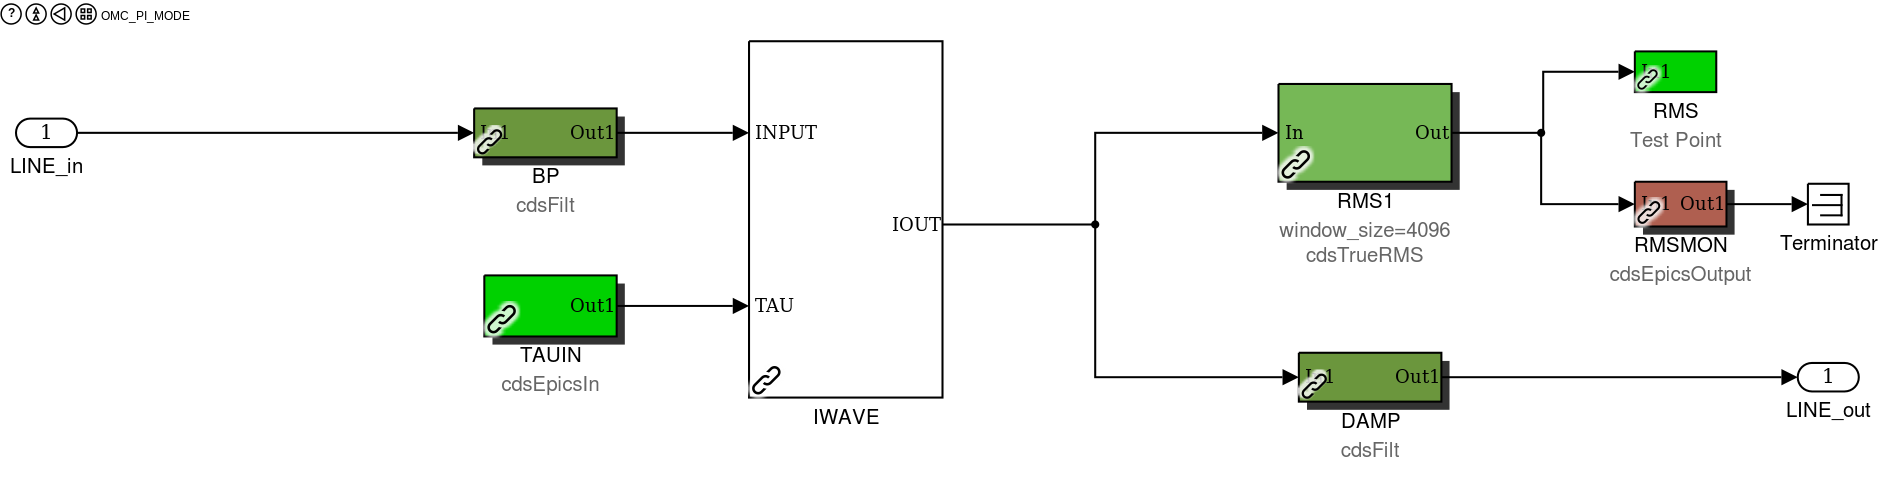
The second strategy uses the OMC data sent from the corner station. In this case the low pass filters (anti-aliasing and anti-imaging) in the signal path serve the same function as a band pass filter, so the
up-converted data is sent directly to the line tracker (iWave), whose output is then sent to the ESD driver. This system has been applied successfully in
dampling PI at the
ITMs and the
ETMs.
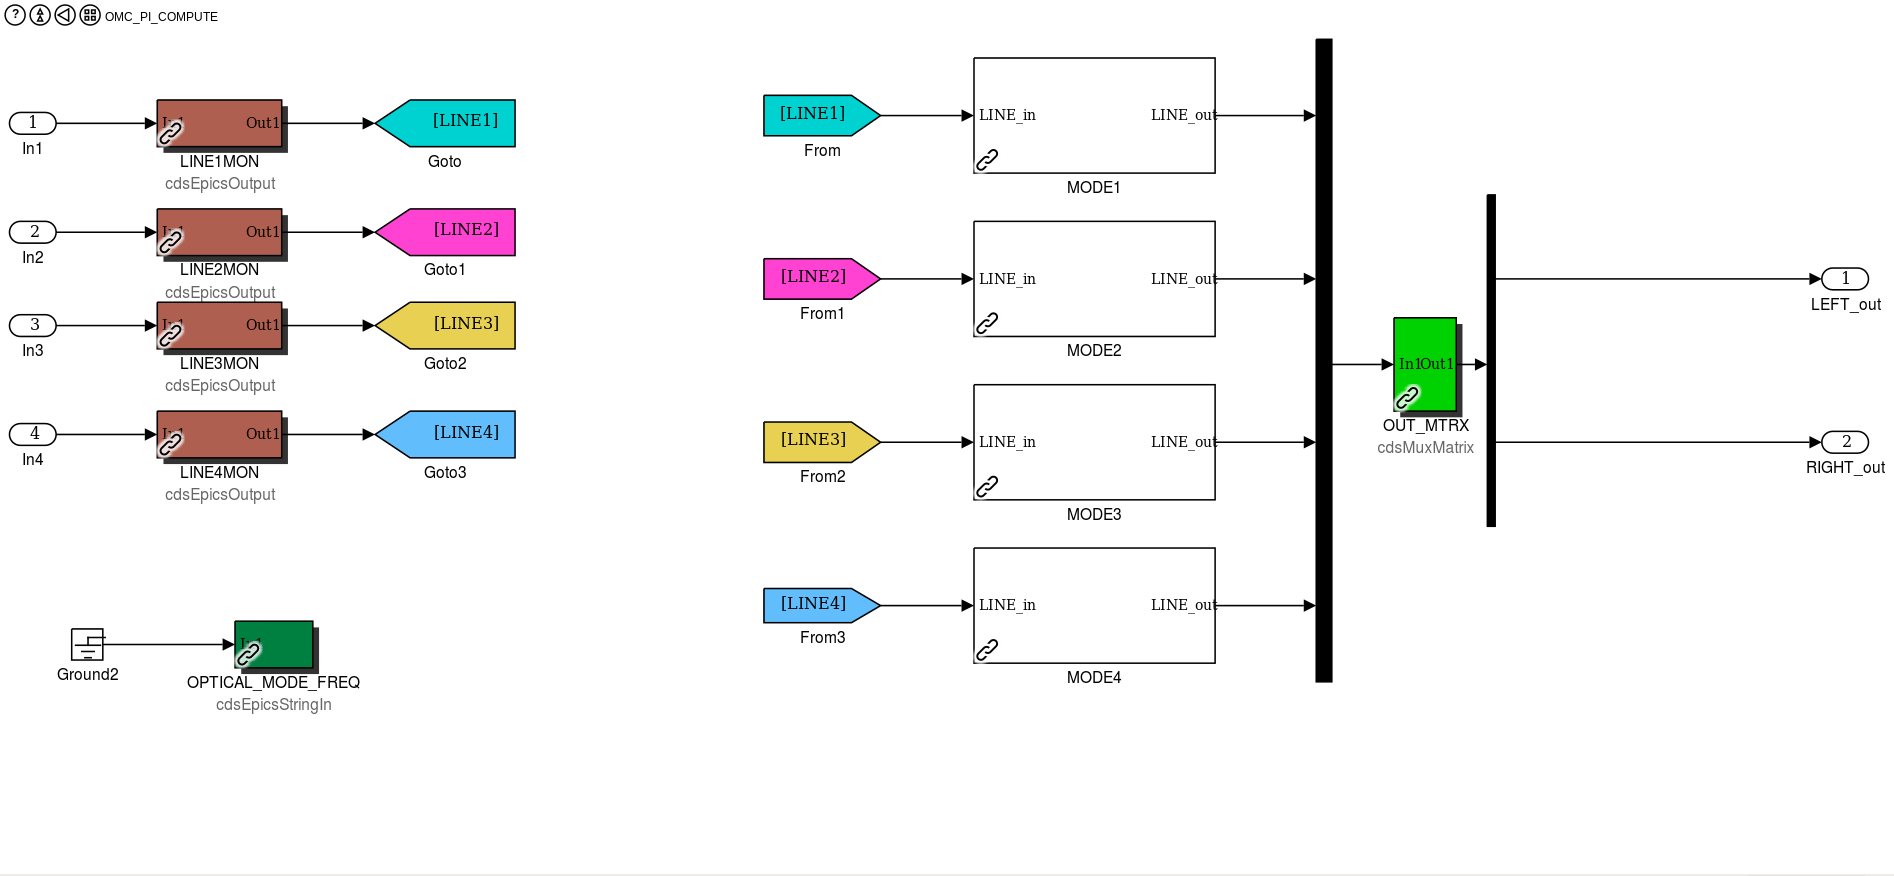
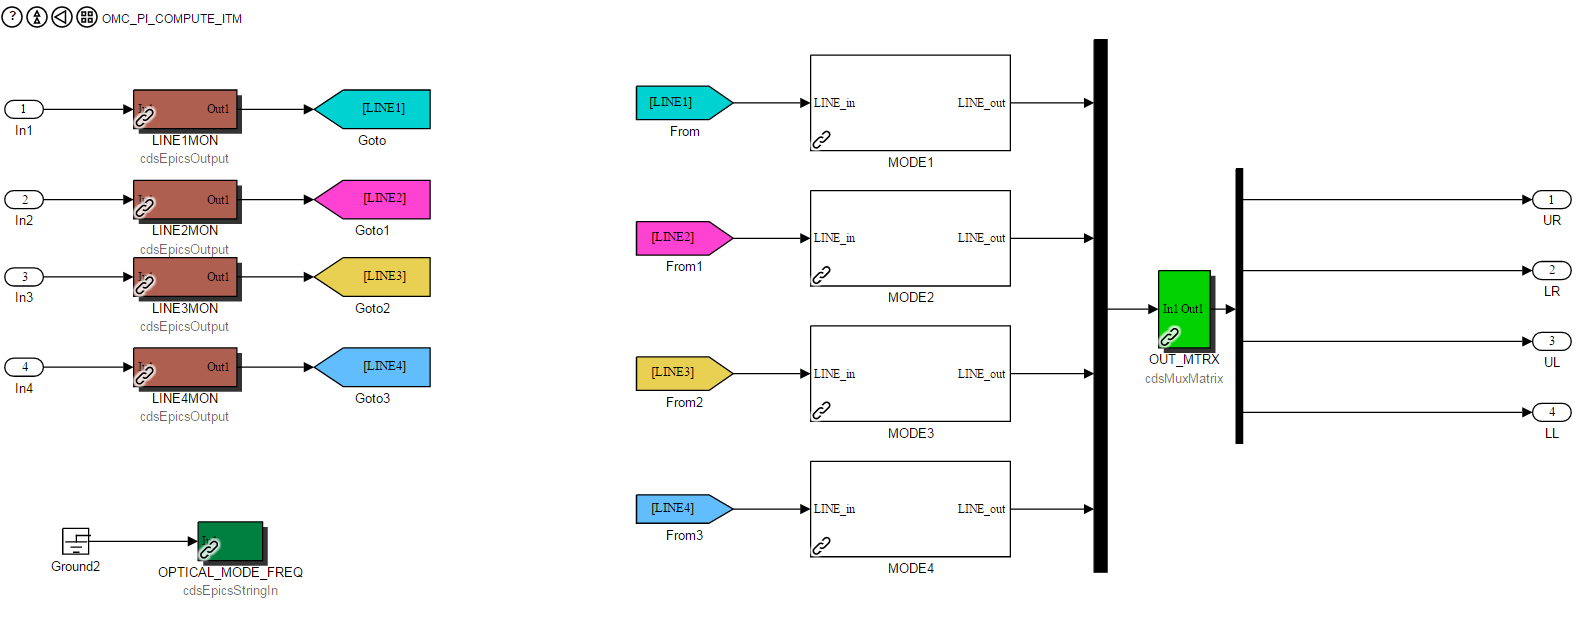
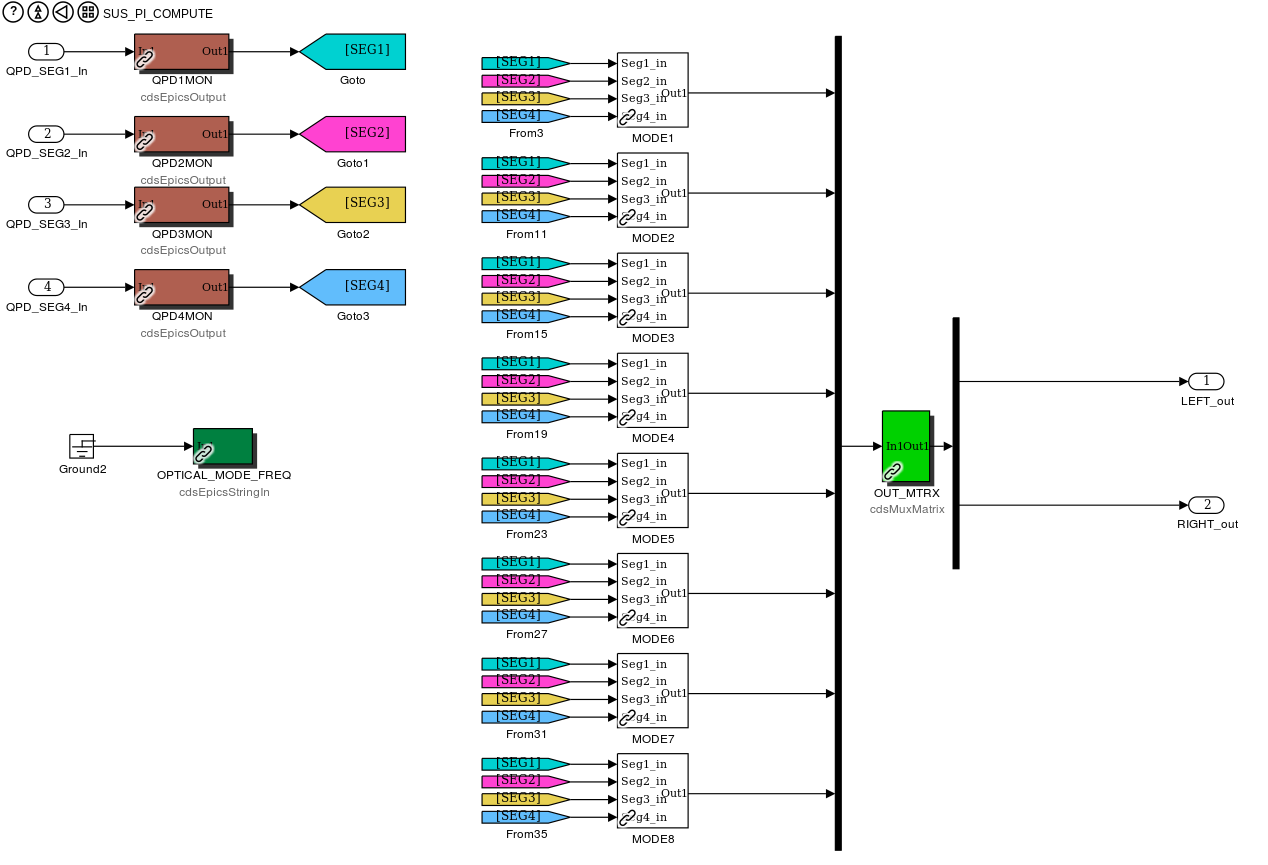
The computation block with 4 outputs is only used in the corner station pi model (h1susitmpi), where we have control of the four ESD quadrants.
The third strategy uses a remote
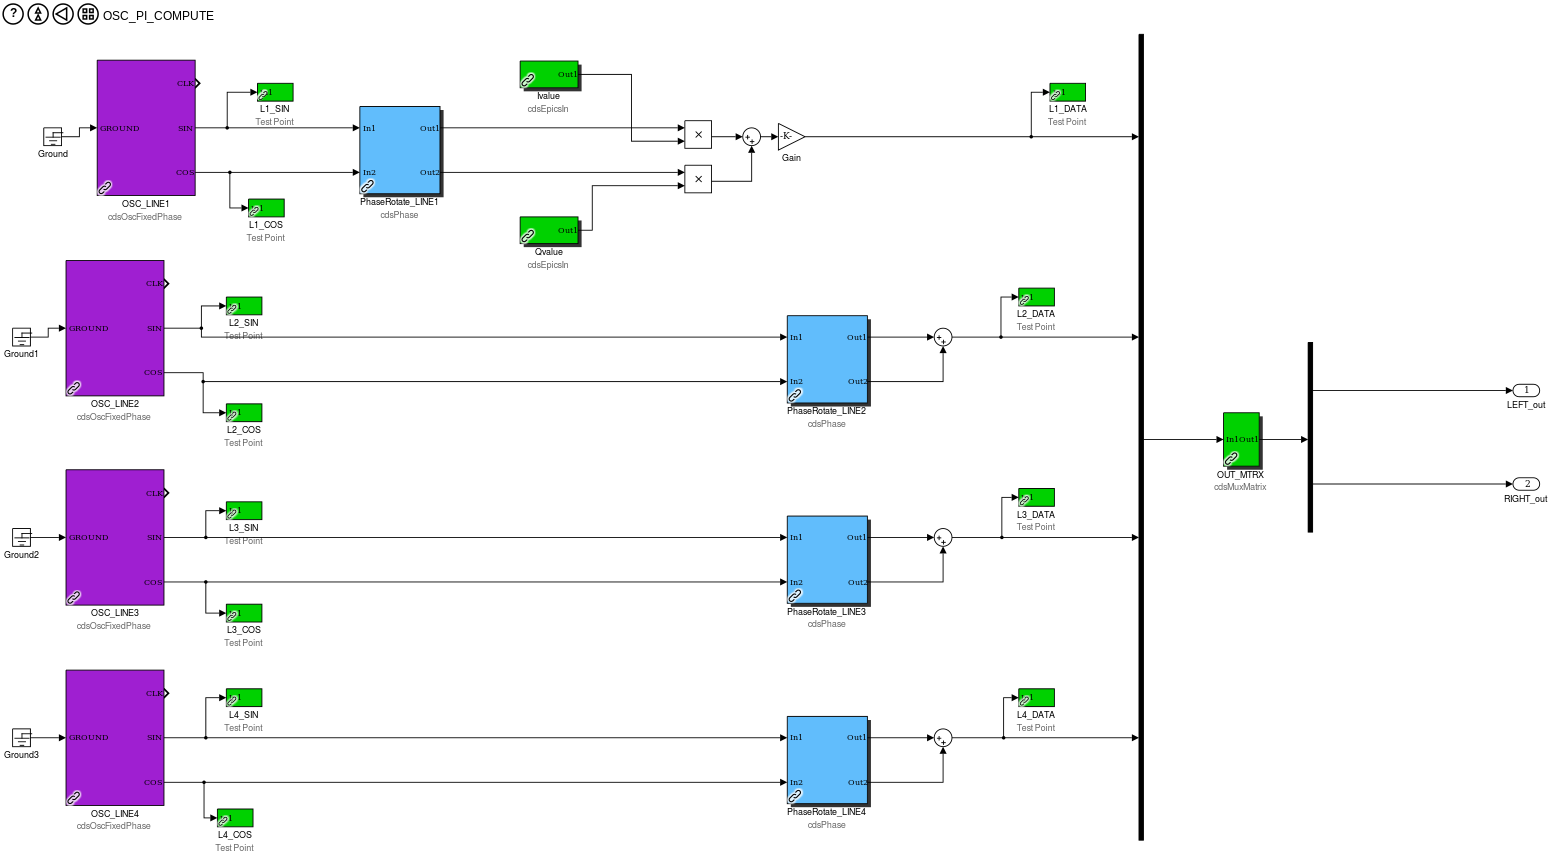
synchronous oscillator (whose output is phase-locked to the mode lines in the OMC DCPD error signal) to drive the ESDs. This strategy combines various aspects of the first two schemes and takes advantage of the fact that the frequencies of mode lines change very slowly and can thus be transmitted over a slower channel. More importantly, the output of the oscillator should be cleaner than the error signal that derives directly from a band-passed or dynamically tracked trans-QPDs or OMC DCPDs data. Consequently, we think that this scheme when implemented correctly, should be the best of the three strategies.
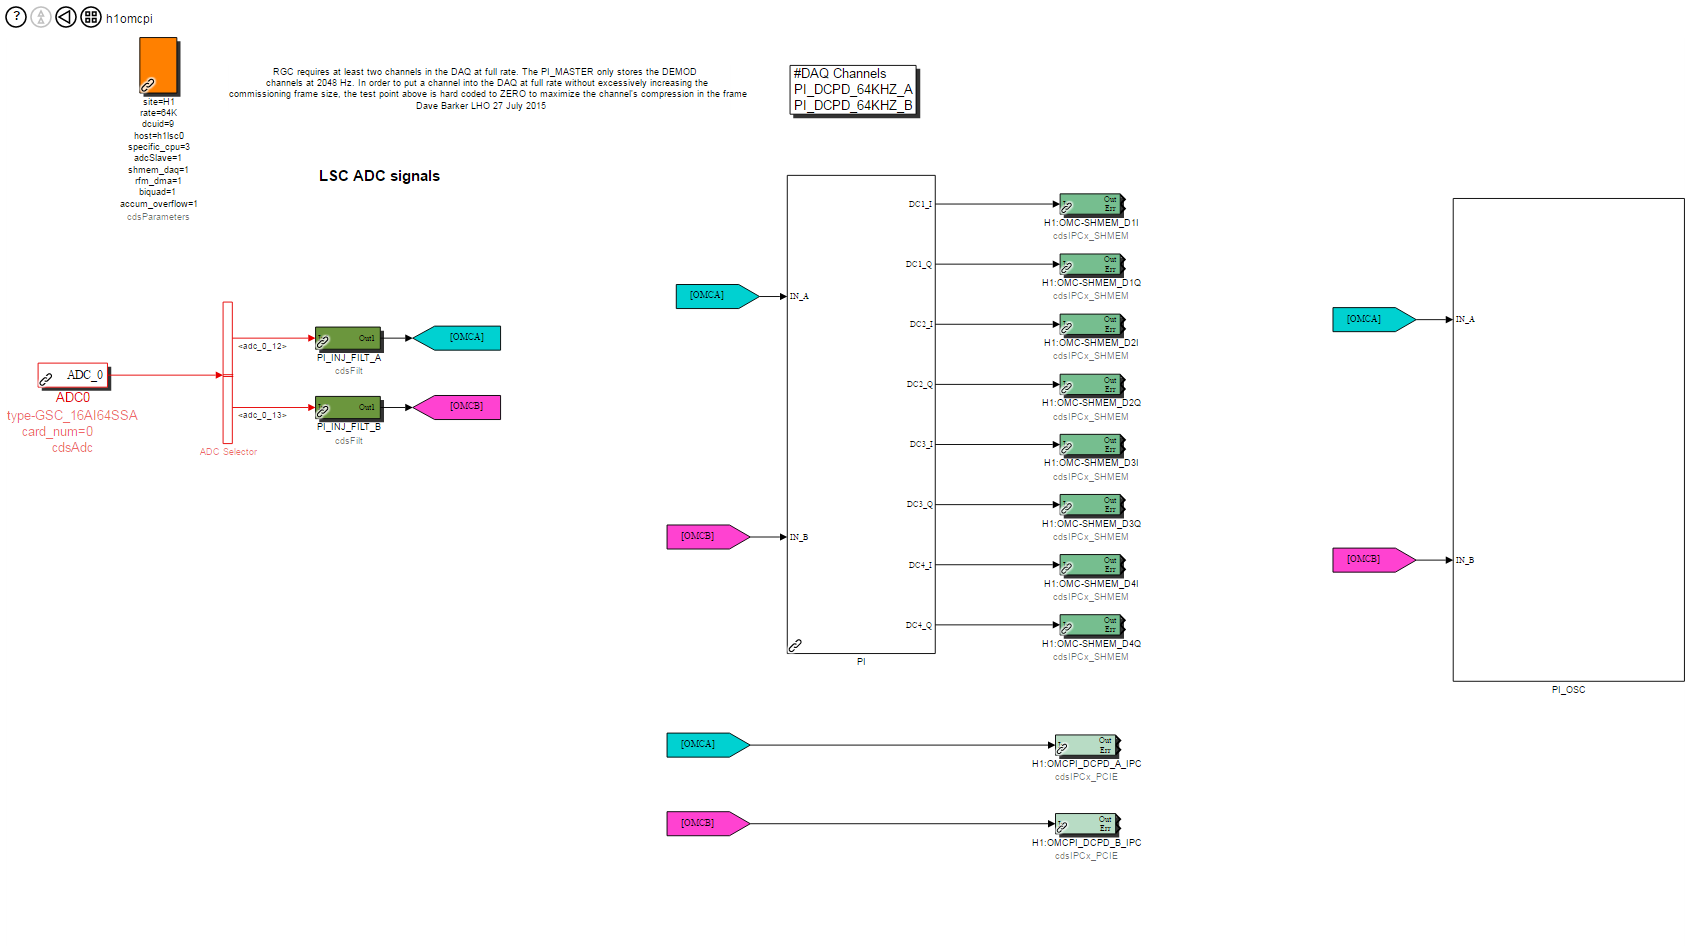
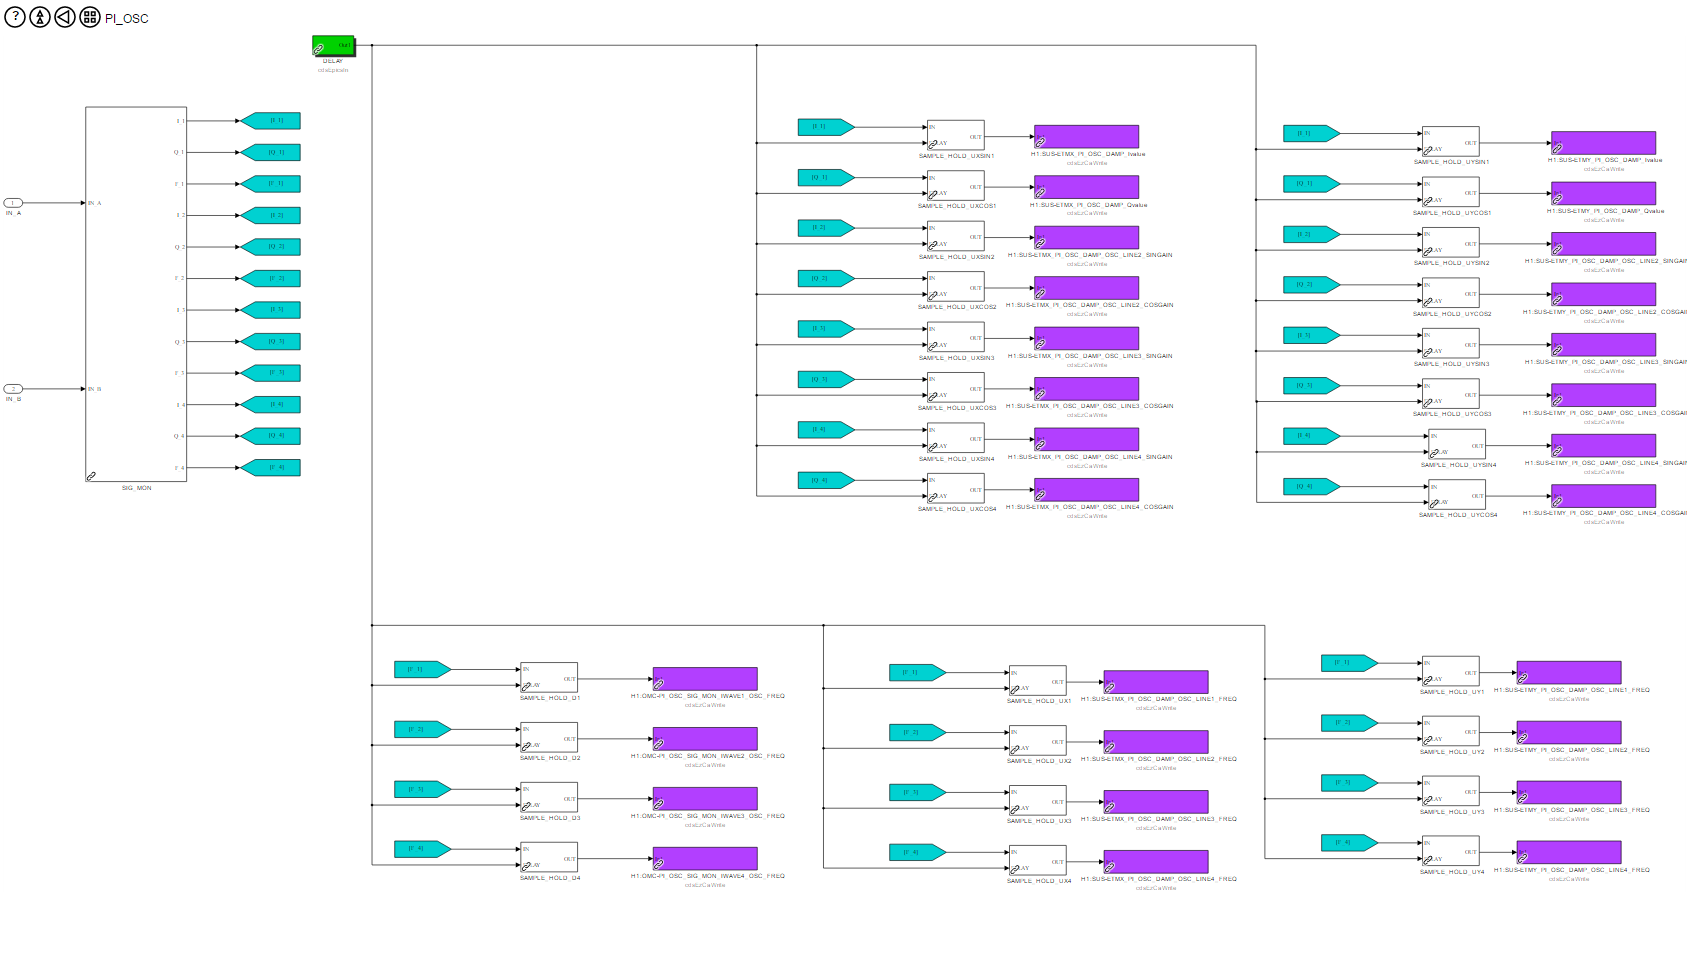
The most recent test of this system shows that updating the parameters (SINGAIN, COSGAIN, frequency) of the remote oscillator introduced considerable noise. A short term solution---aimed at demonstrating the viability of the system---is the reduction of the rate at which we update the oscillators. This is the role of the sample-and-hold block in the monitor block below. Whilst the system has been shown to work successfully with this modification, further work is required to realise the full potential of this scheme. For example, some of the amplitude noise in the I and Q values can be eliminated by the constraining them with the tracked amplitude from iWave. This would be particularly useful should the I and Q values suffer the same distortion from the update of the fixed oscillators frequency in the omcpi model (h1omcpi).
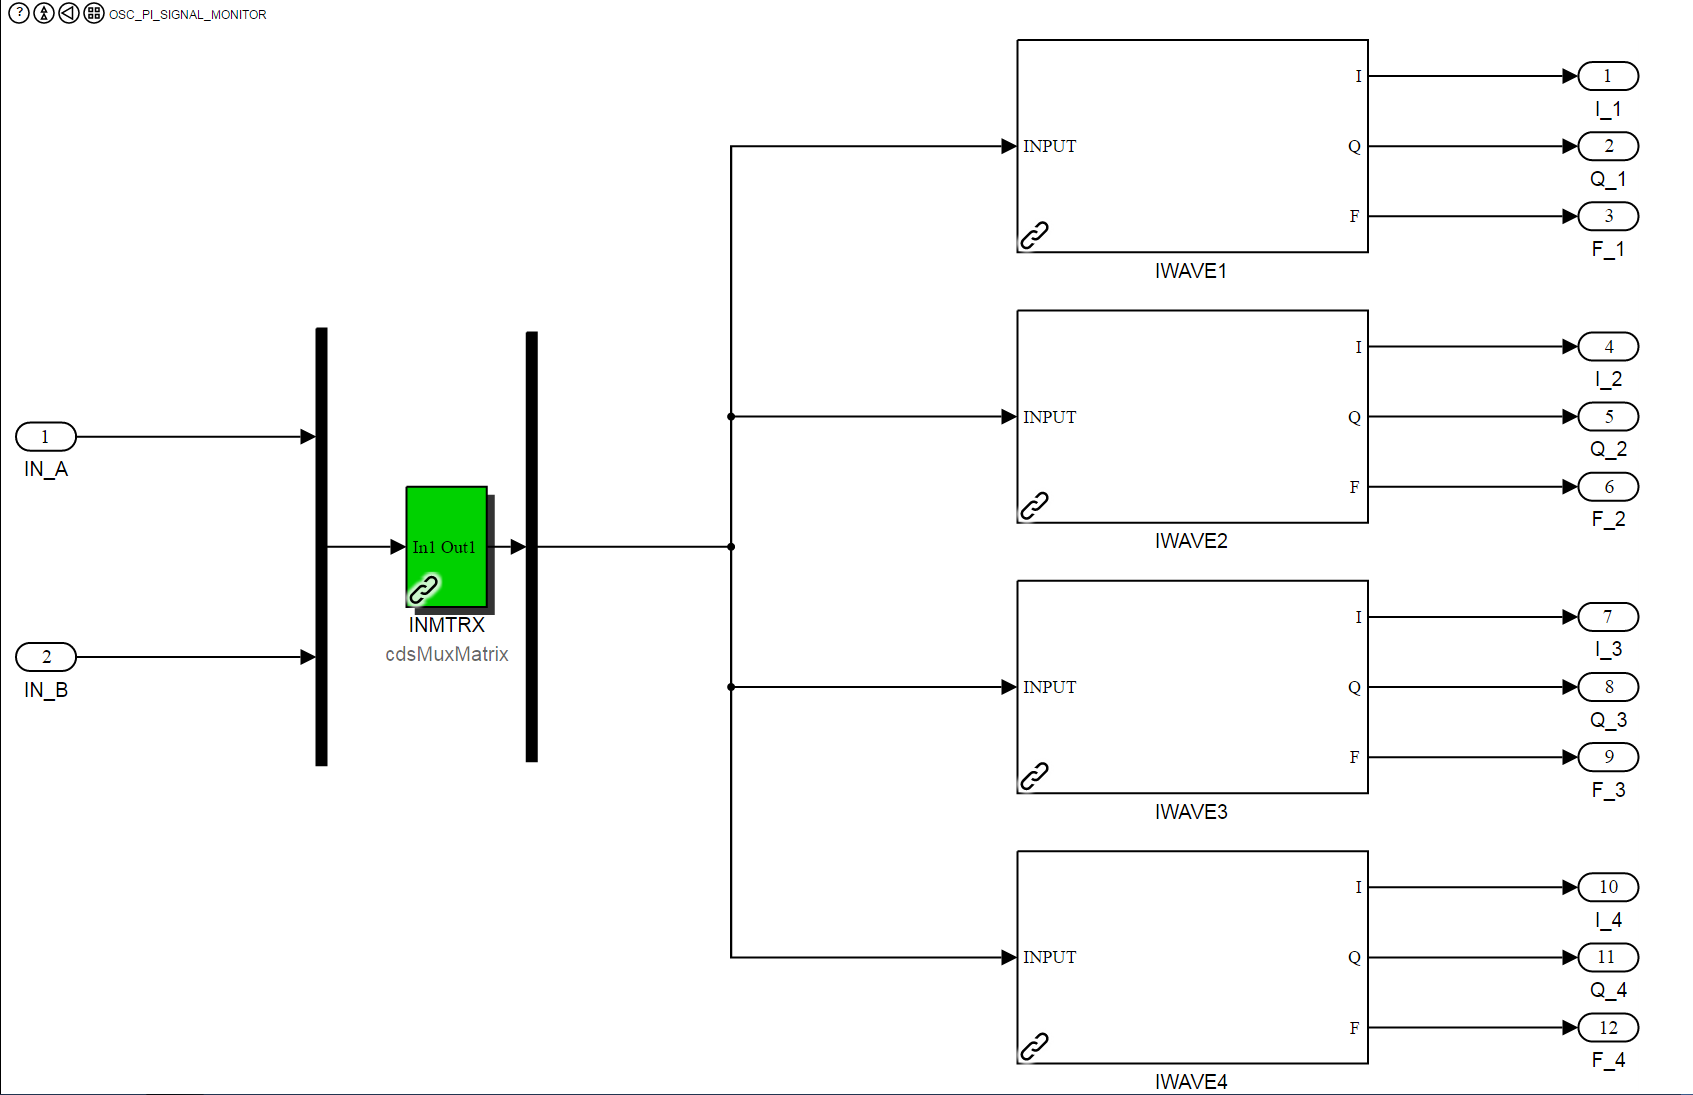
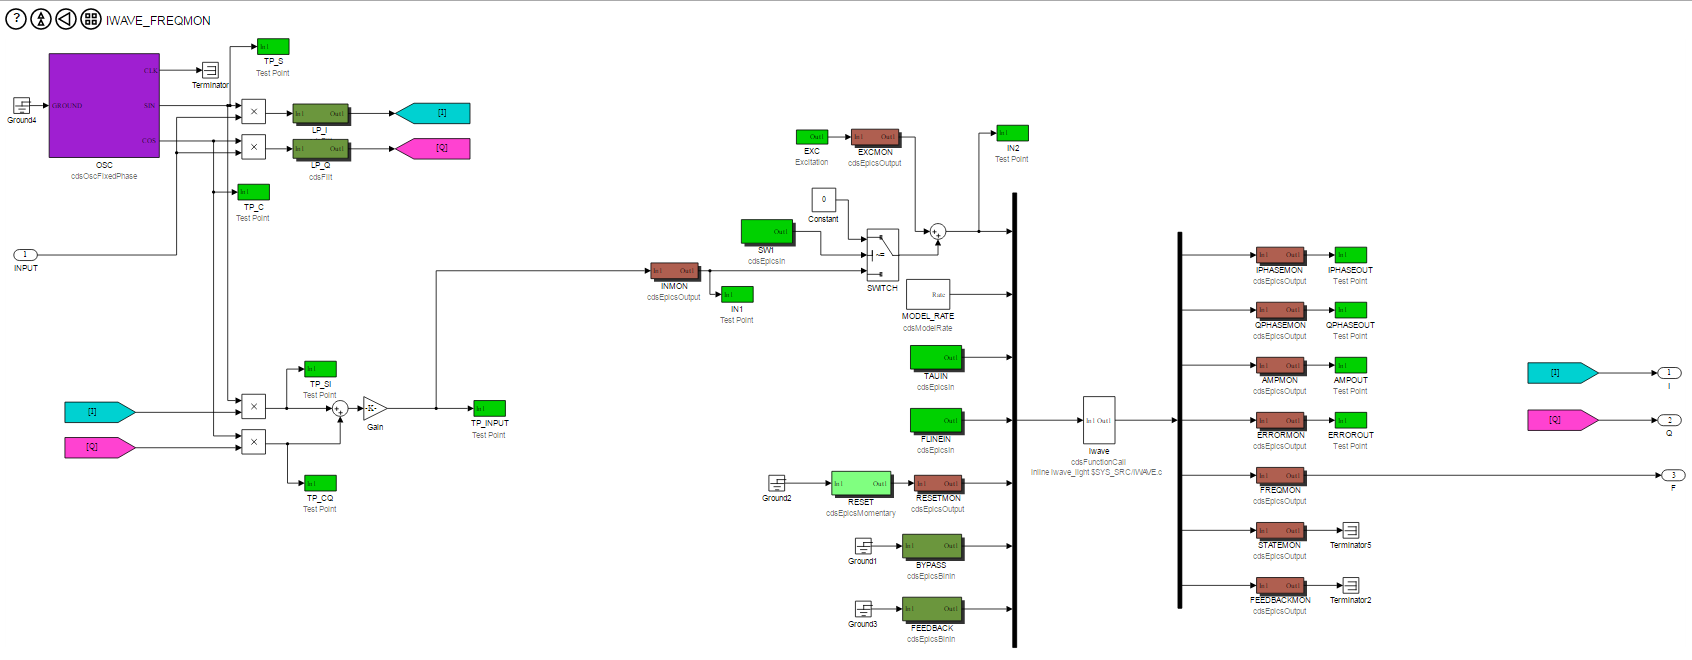
To get the signal parameters (I, Q, frequency), we use a modified version of the iWave block that incorporates a fixed phase oscillator. Here, the oscillator serves two main functions: extraction of the I and Q values and providing a dynamic band-pass filter around the mode line of interest.
At the end station, we have companion oscillators whose parameters (SINGAIN, COSGAIN, frequency) we update via EPICs for proof of concept. We note that the first mode uses a slightly different architecture. This was part of the debug process intended to test whether an indirect update of the I and Q values of the oscillators reduces the noise at the output. So far this does not seem to be the case. Although this system currently uses EPICs, this does not have to be the case. The low bandwidth nature of the update means it can be readily added to the existing PI channel for moving the data between the corner and the end stations.
We have also adopted the MIN_MAX_CALC CDS library part for monitoring power build-up of PI modes over a wide range of frequencies and should be deployed shortly. The monitor block resides in userapps/sus/common/PI_MASTER.mdl.
Presently, there is no mechanism for dealing with multiple lines that are separated by less than 1Hz, so we have adapted iWave to function as a user configurable static and dynamic notch filter. These blocks reside in userapps/sys/common/IWAVE.mdl. The idea is to place at least one notch filter in series with iWave in the PI mode block and have it operate in static mode by default. Although preliminary work done on the test stand shows that this does not impact on the performance of the mode block in the absence of any nearby lines and stabilises the behaviour of the iWave PLL in their presence, further work is required to fully stress test this system against wandering lines that cross one another in the frequency domain before deployment.