keith.riles@LIGO.ORG - posted 14:24, Friday 03 June 2016 - last comment - 20:04, Tuesday 07 June 2016(27548)
Implemented new inverse actuation for CW injections with time delay correction
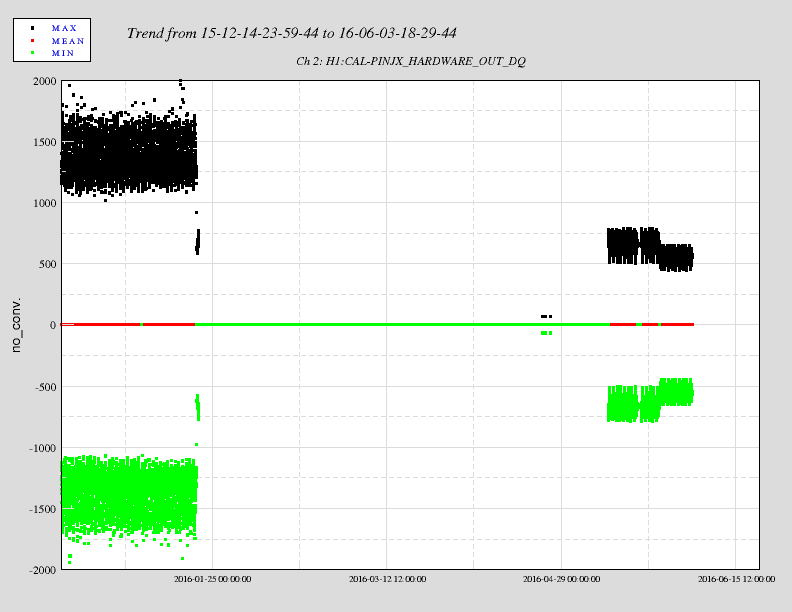
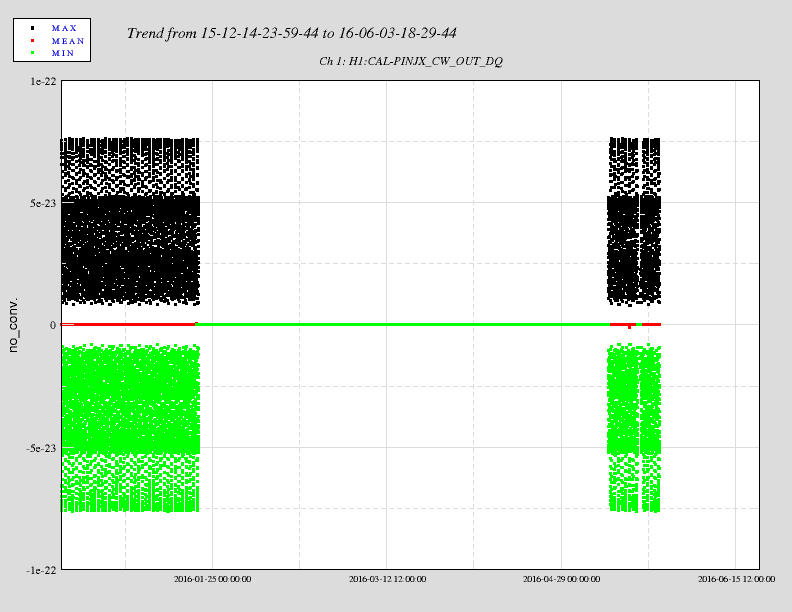
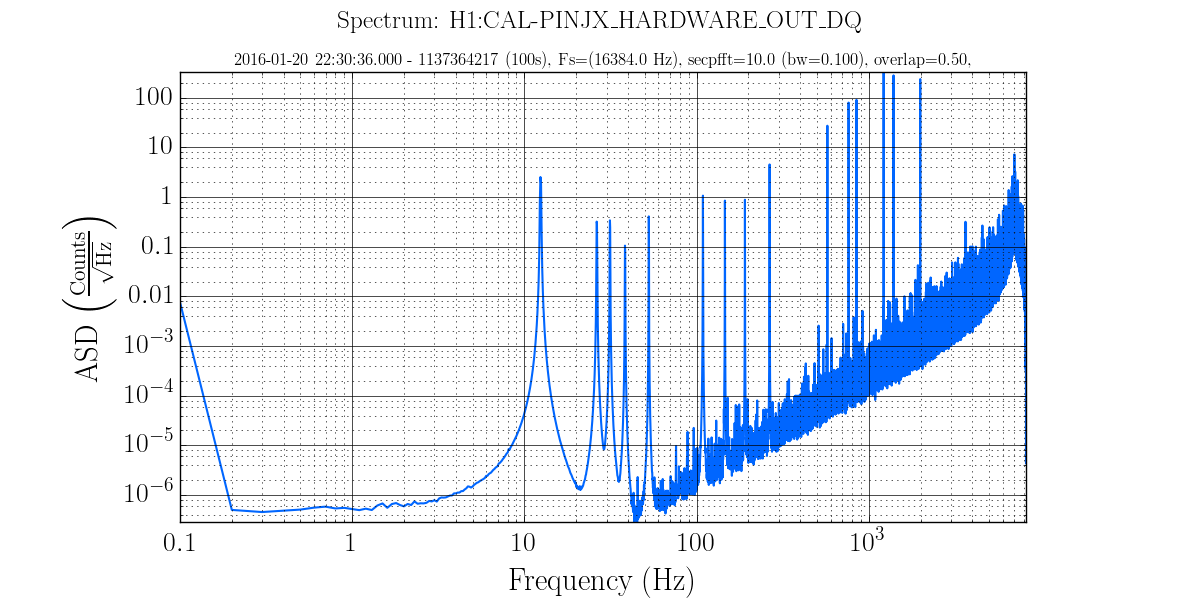
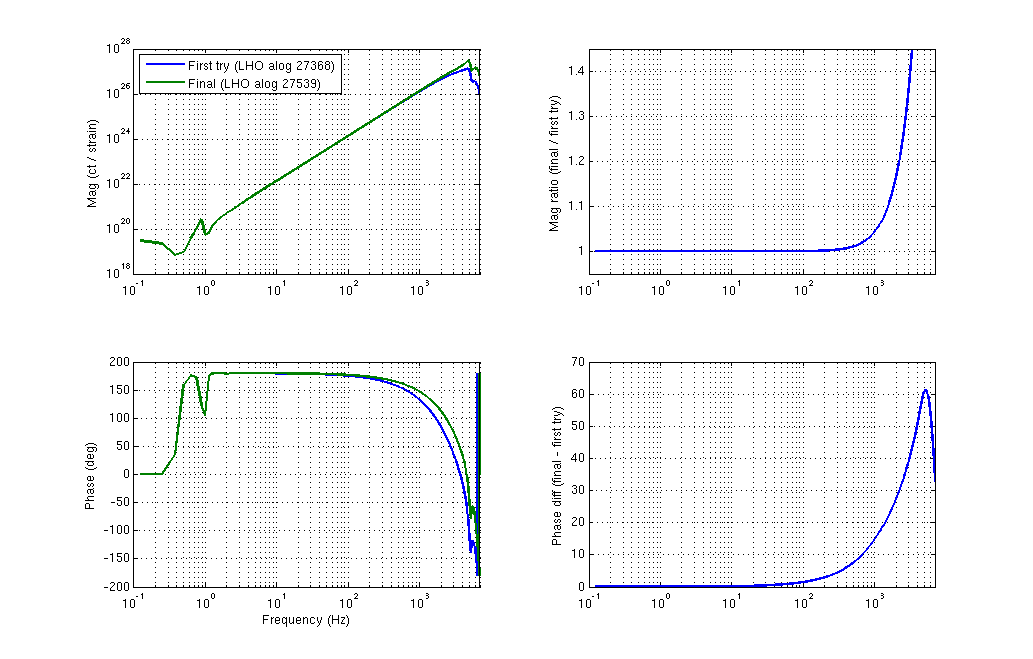
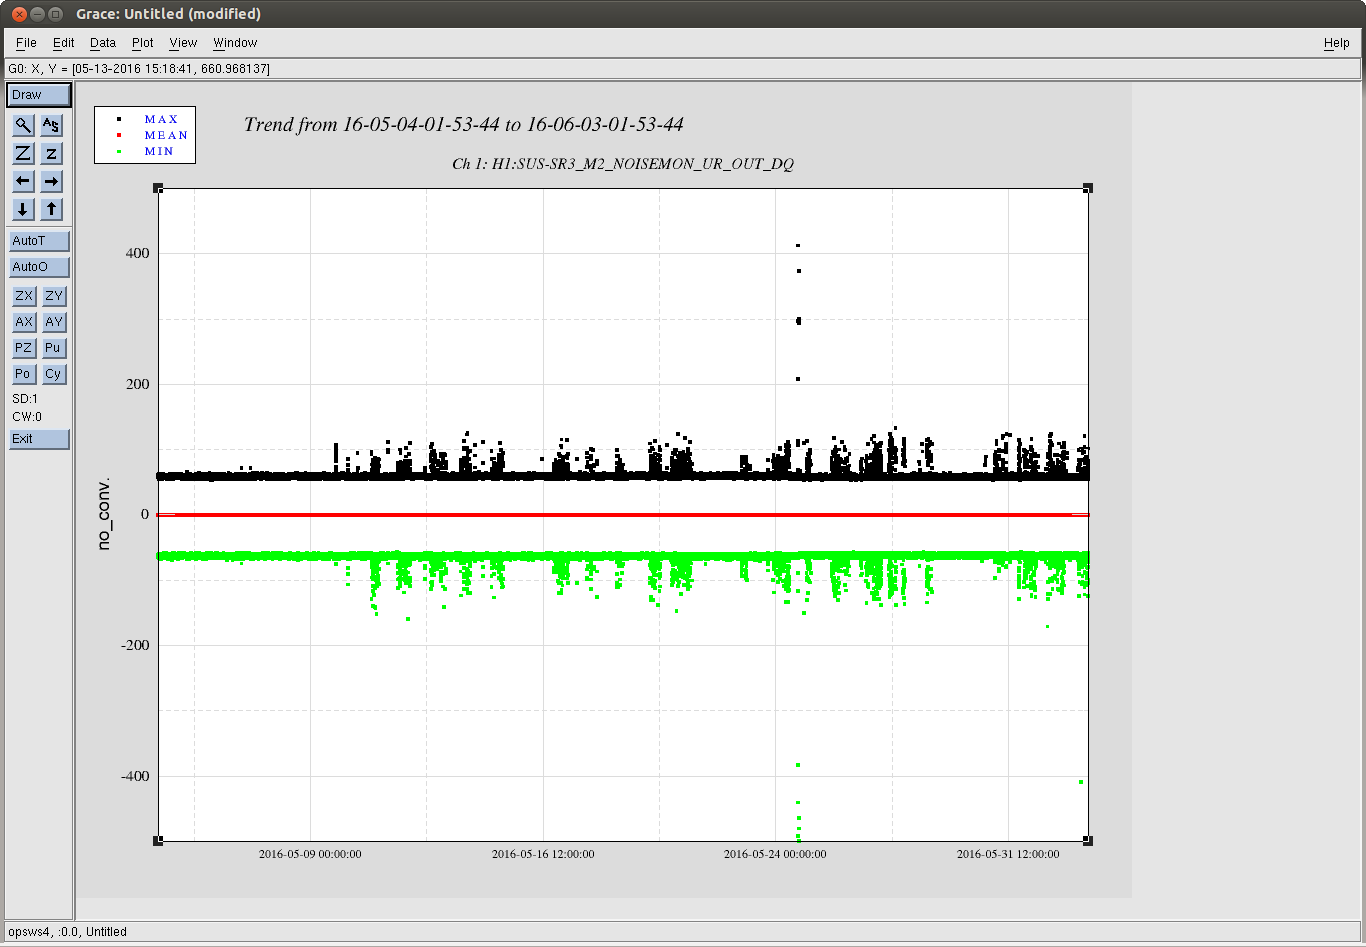
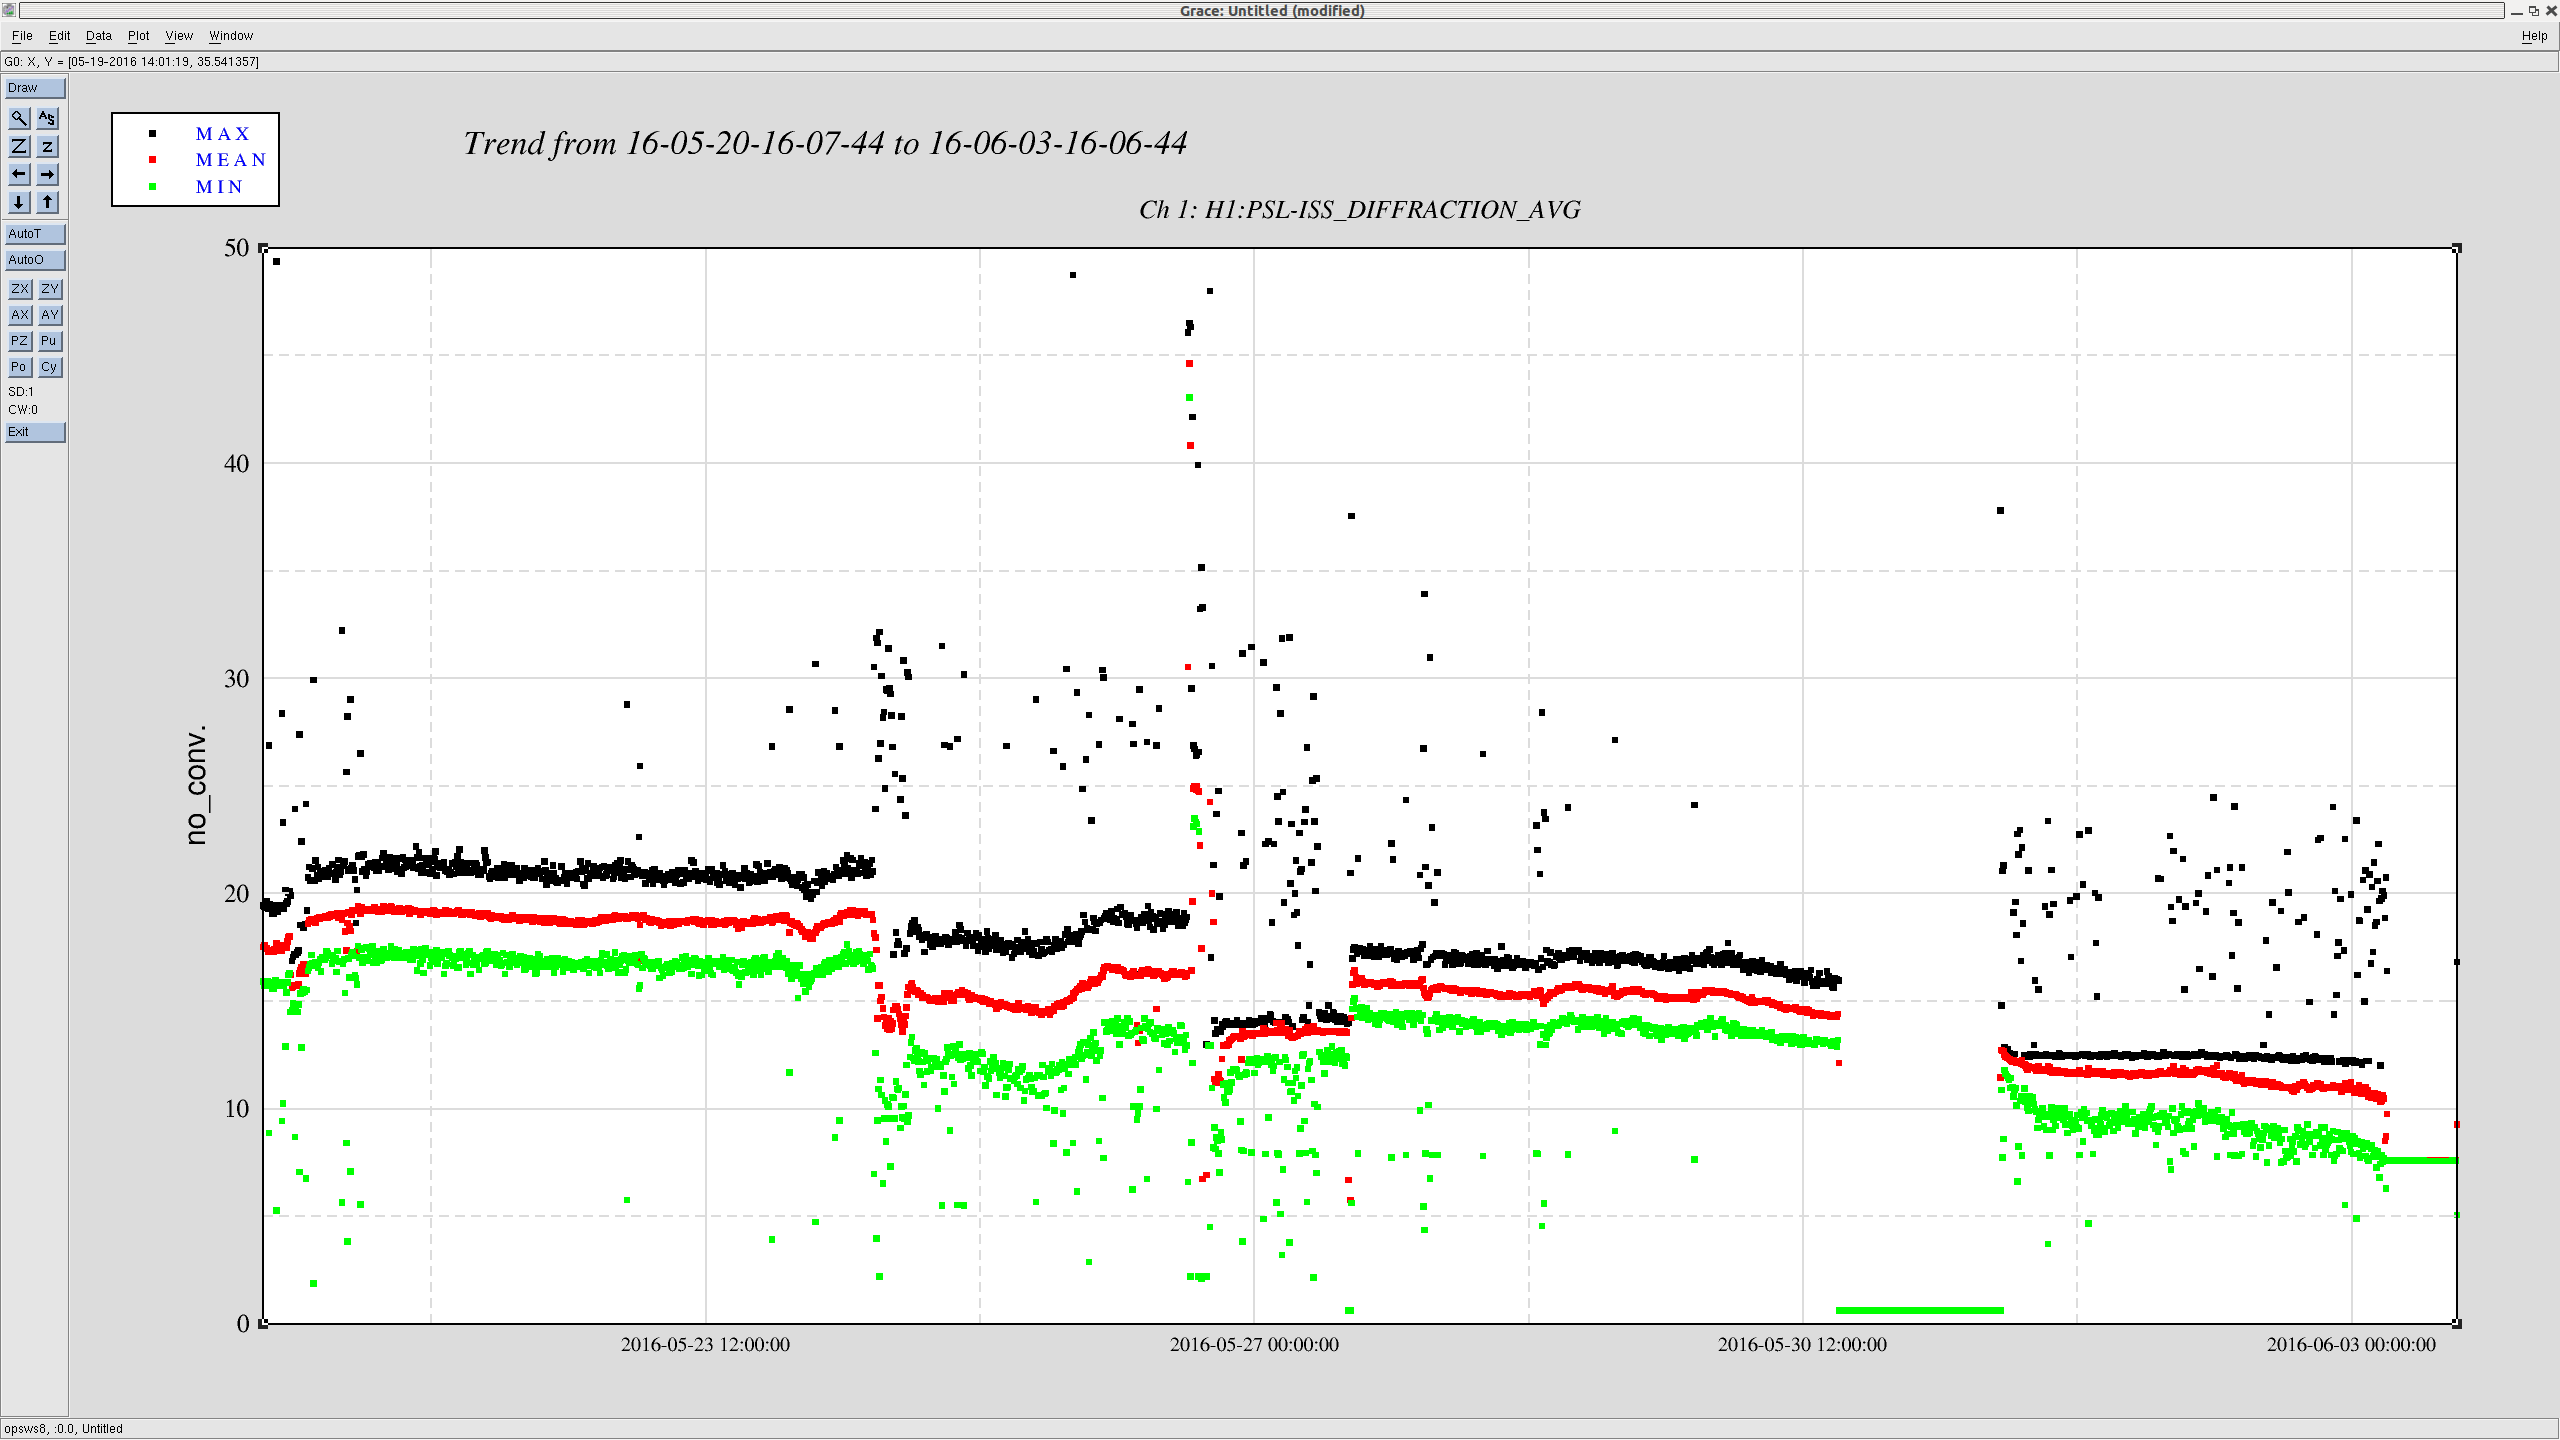
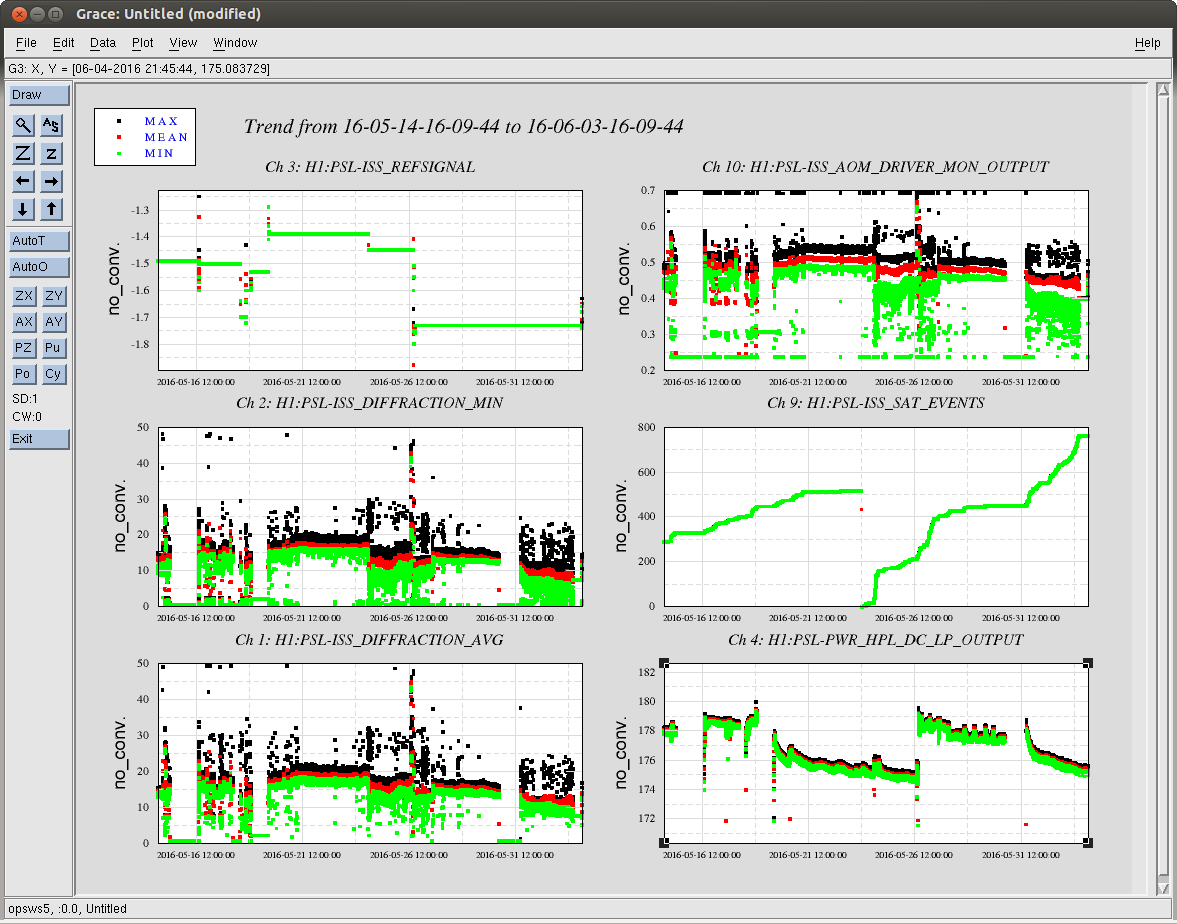
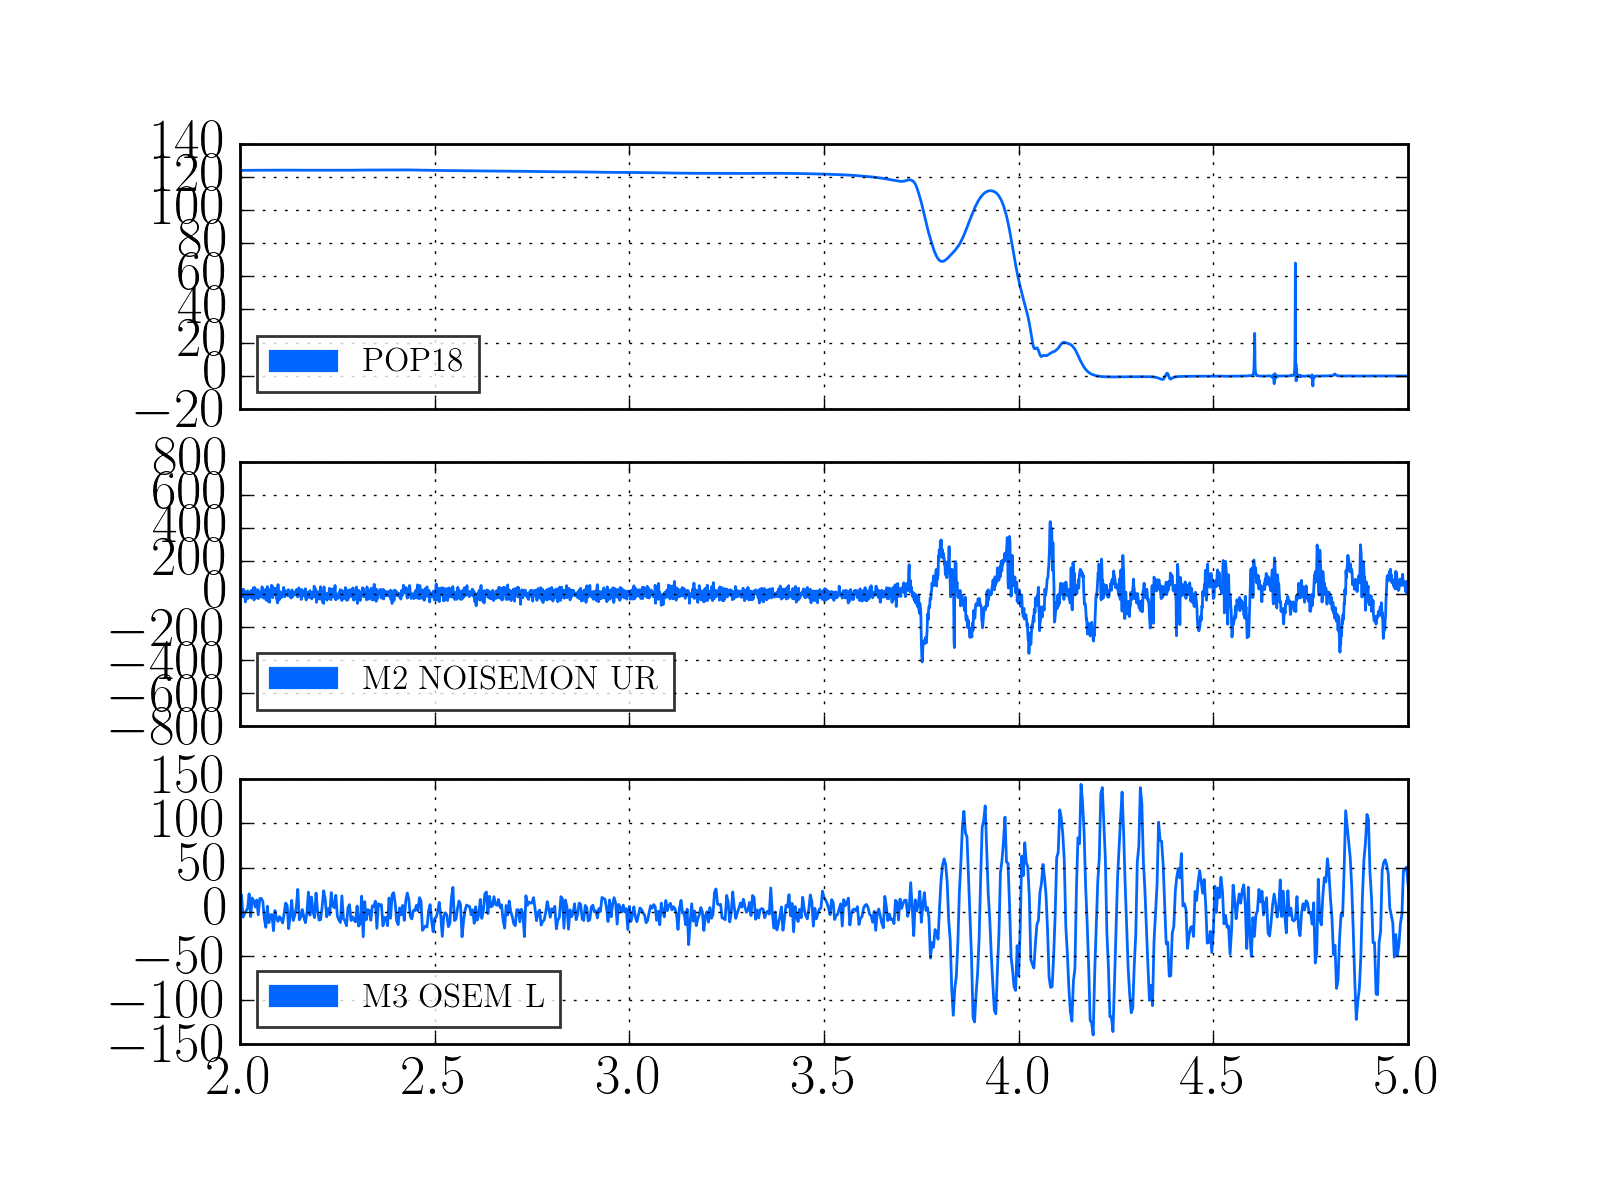
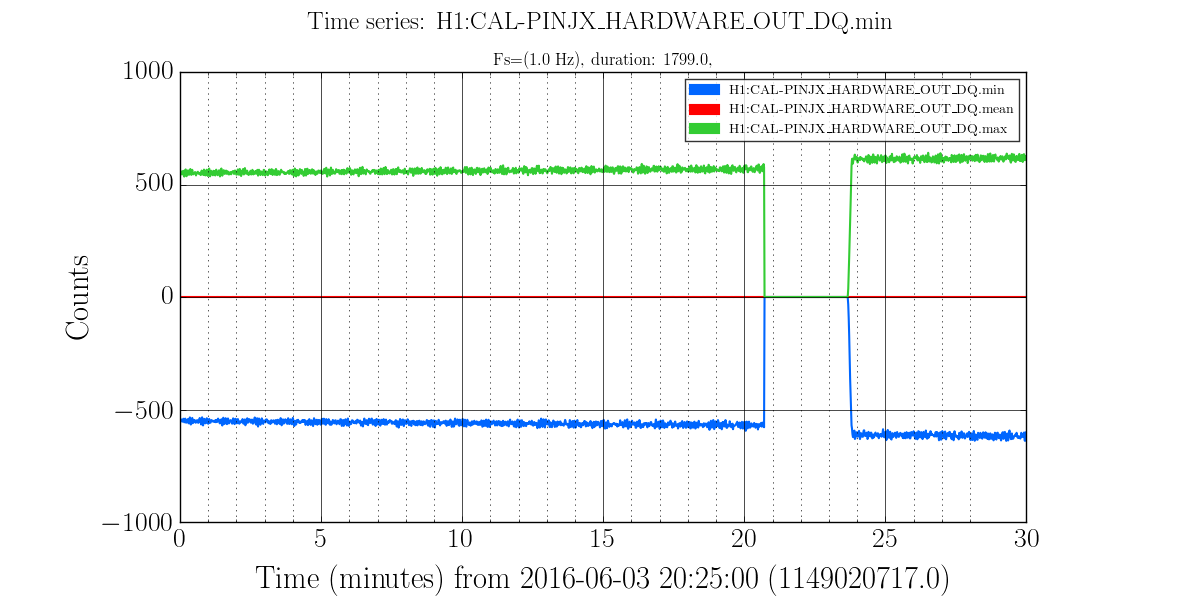
I have copied Evan's new actuation function to the h1hwinj1 directory currently used
for CW injections: ~hinj/Details/pulsar/O2test/. I used the one that corrects for the
actuation delay:  H1PCALXactuationfunction_withDelay.txt.

For reference, the uncorrected version (no "_withDelay") sits in the same directory,
along with the one we first tried last week: H1PCALXactuationfunction.txt.25may2016.
The perl script that generates the command files in.N (N=0-14) has been updated to
use "_withDelay" and the command files regenerated.

The CW injections have been killed and automatically restarted by monit. Attached
are second trends before and after the gap showing that things look about the same,
as expected, but there is a small increase in injection amplitude (~5%).
Images attached to this report
Comments related to this report
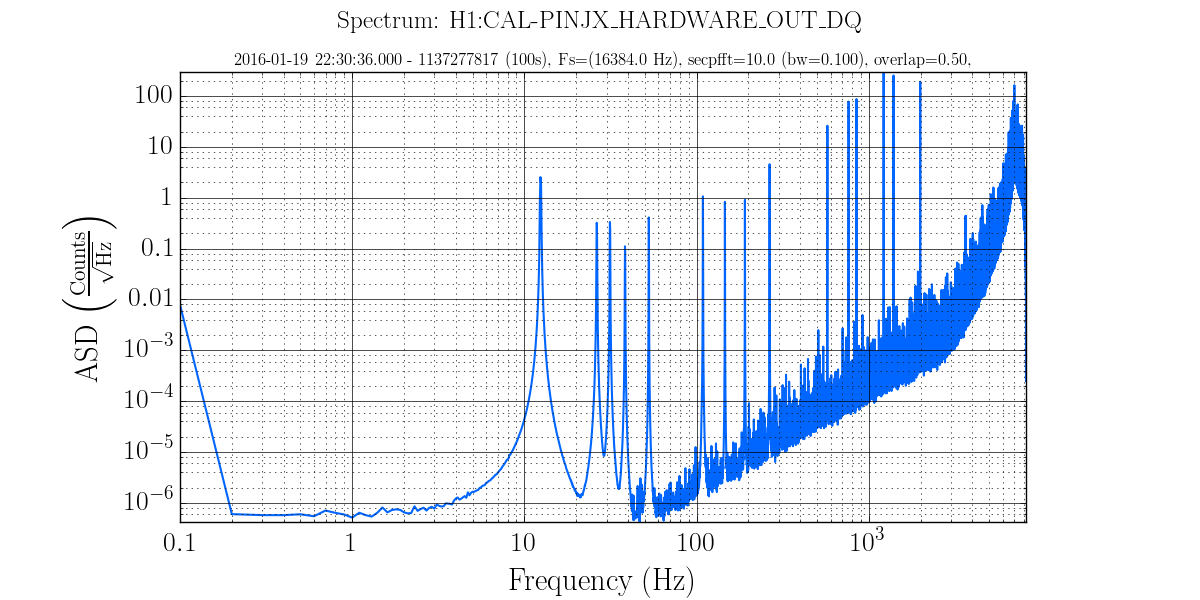
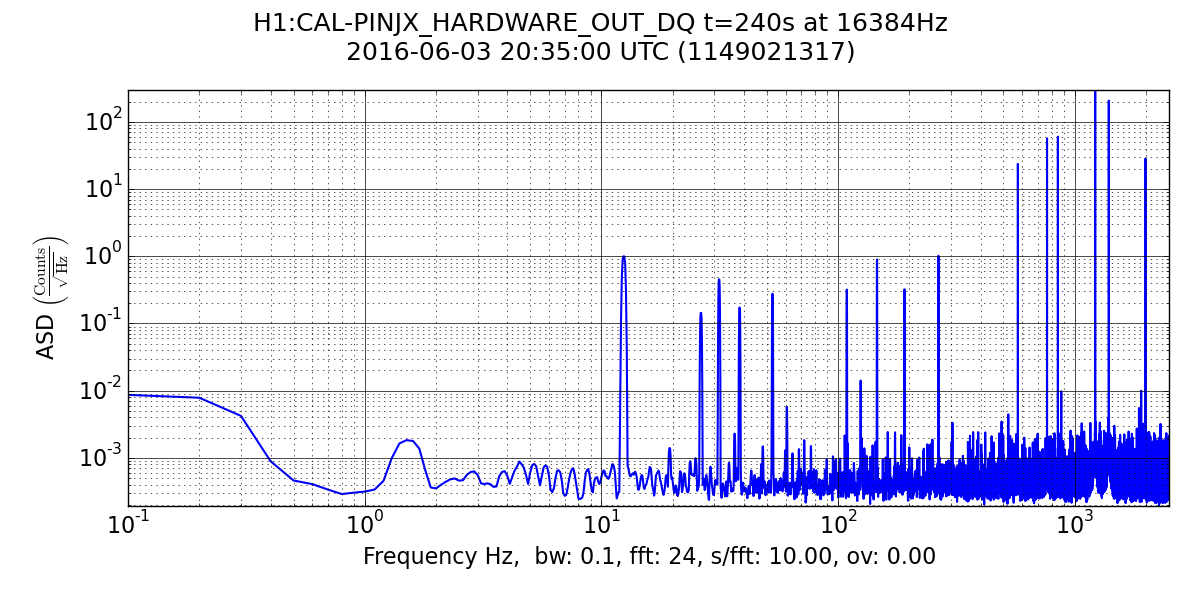
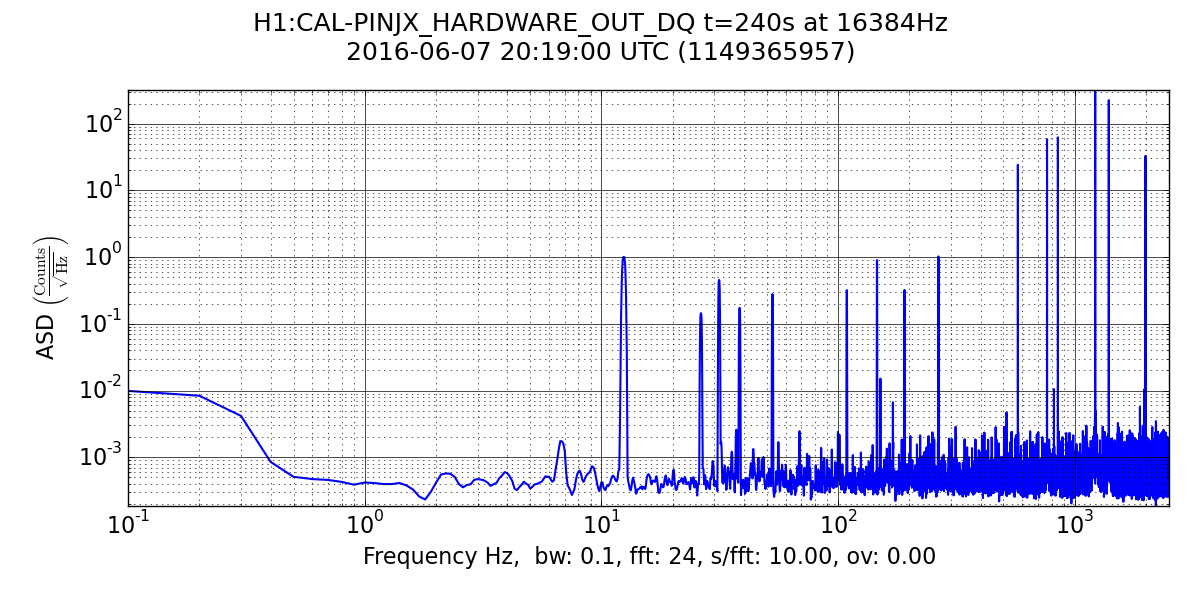
Evan wondered if the ~5% increase in total injection amplitude was dominated
by the highest frequency injection or one at lower frequencies. I took a look
for this time interval and found that the total amplitude is dominated by
the injection at ~1220.5 Hz. Simply comparing spectral line strengths
before and after the changeover turned out not to be a robust way to
estimate the frequency-dependent ratio of the new to the old inverse actuation
function, because some pulsar injections (especially the highest frequency one)
are going through rapid antenna pattern modulations during this period.

But comparing the new to the old spectral line strengths at the same
sidereal time several days later (after power outage recovery) gives
robust measures for a sampling of low-, medium- and high-frequency
injections:
| Freq (Hz) | "Old" amplitude (before switchover) | New amplitude (4 sidereal days later) | Ratio (new/old)
| 190.90 | 0.32292 | 0.32211 | 1.00
| 849.00 | 60.502 | 62.344 | 1.03
| 1220.5 | 299.37 | 318.70 | 1.06
| 1393.1 | 207.50 | 224.37 | 1.08
| 1991.2 | 28.565 | 32.788 | 1.15
| |
Images attached to this comment
Non-image files attached to this comment