Josh, user EcceruElme from GravitySpy beta, Andy
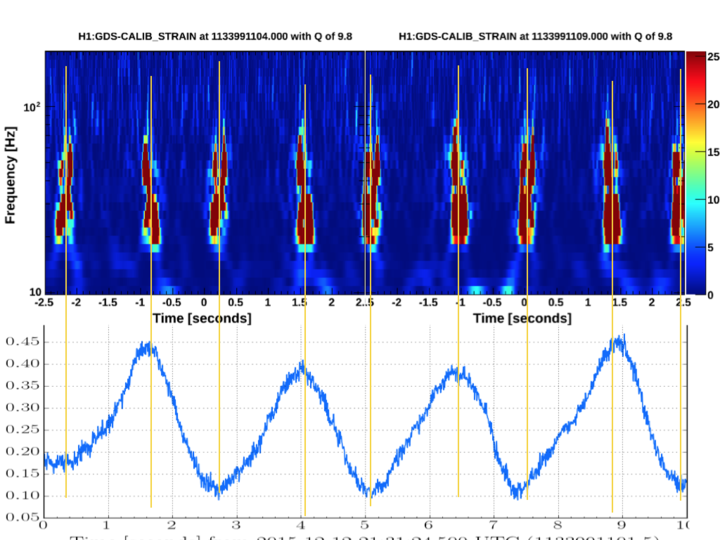
User EcceruElme in the GravitySpy beta (a citizen science effort to classify detector artifacts) identified a new glitch class. They pointed out here that the glitches are not quite periodic, but the shapes seem to alternate - first upwards, then downwards. See the first plot.
One time when this happens is Dec 12 at 21:31 UTC. Looking at more time, we realized that these are nearly periodic when you treat them as coming in pairs - first an upward glitch, then downward. The pair have a spacing of about 2.5 sec (or 0.4 Hz). The glitches go on for minutes, and then the lock ends.
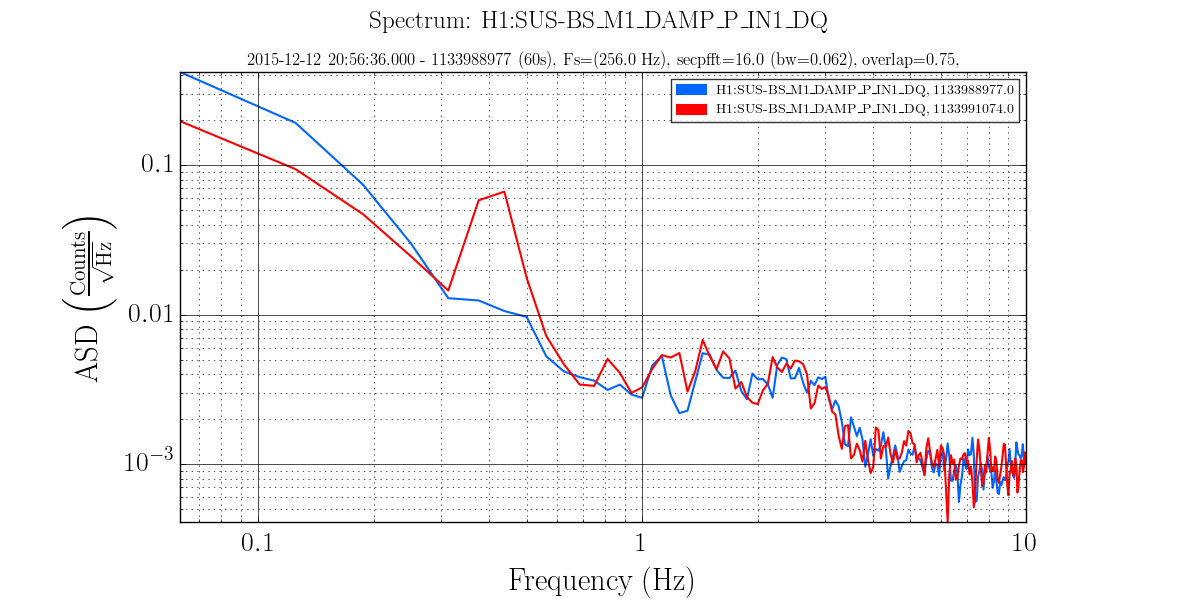
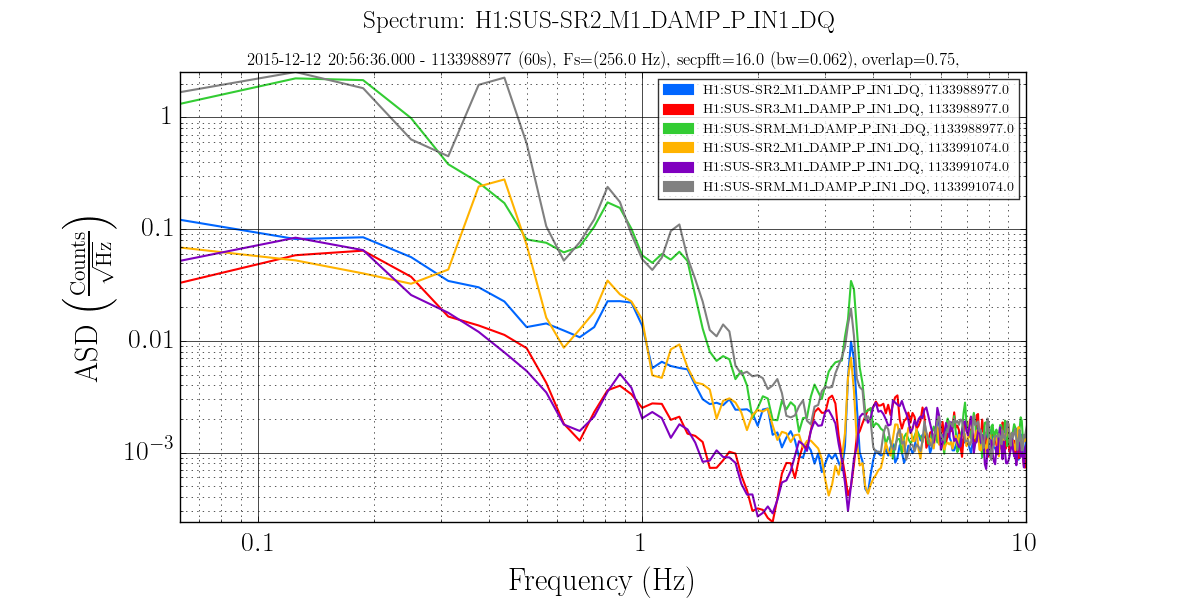
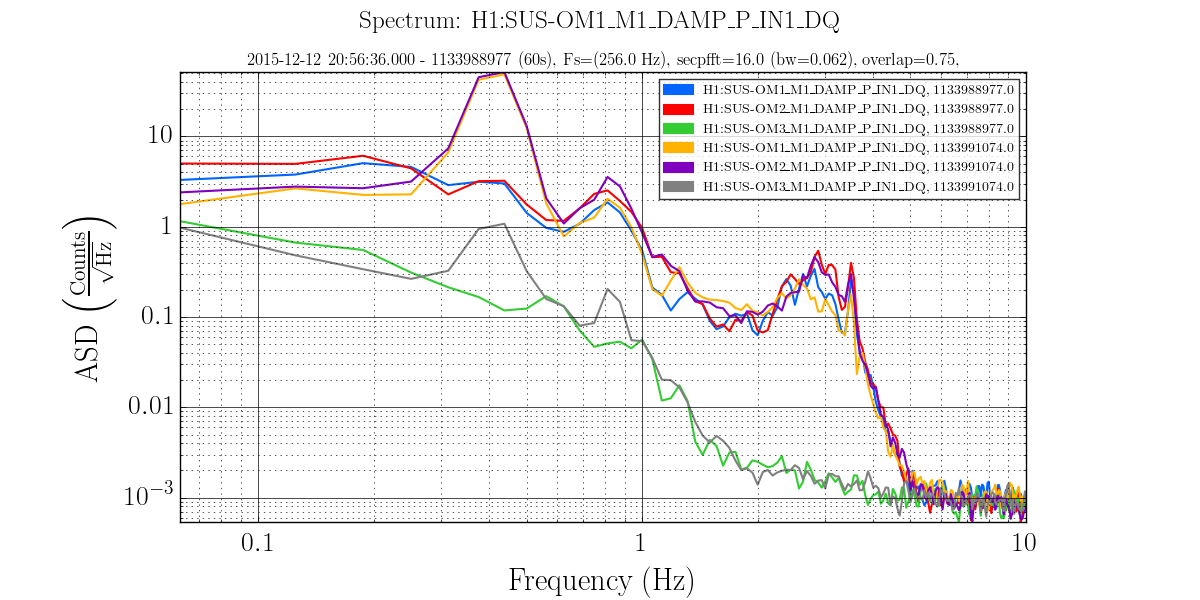
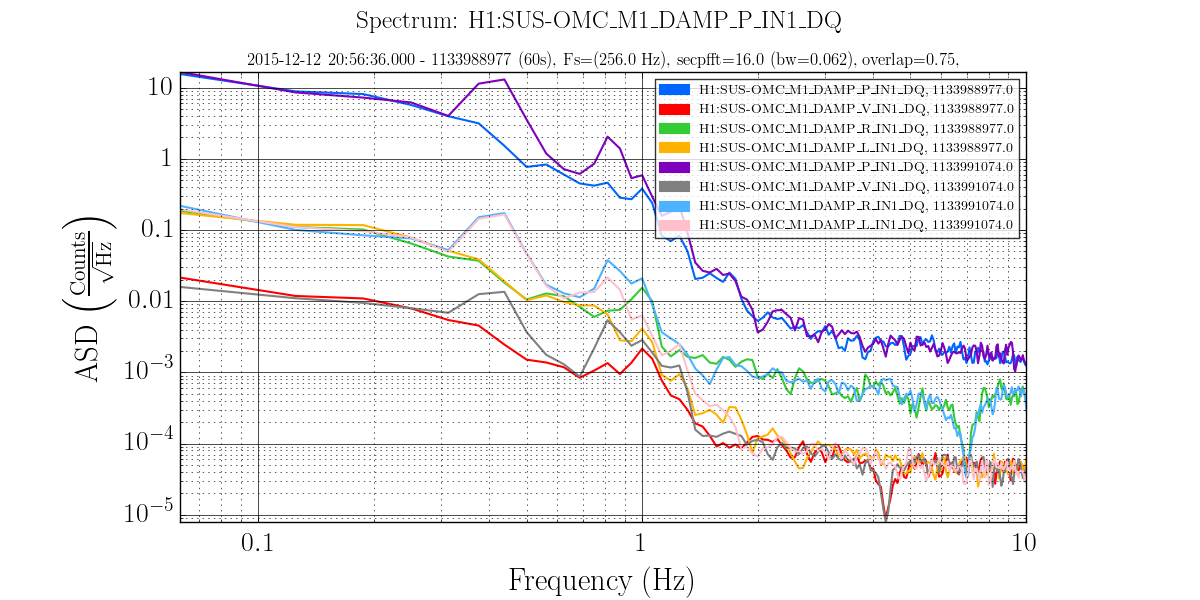
Comparing to a time earlier in the lock, several mirrors develop a big peak in pitch (and to a lesser extent length) motion around 0.4 Hz, as witnessed by the OSEMs. We see this motion in the beamsplitter, SRM and SR2 but not SR3, and in the OMC tip-tilts and the OMC suspension. The BS has a pendulum mode in length at 0.4193 Hz and in pitch at 0.4683 Hz. So it seems most likely that this resonance got rung up somehow, and then SRM and SR2 are following this to try to keep the beam pointed toward the tip-tilts (SR3 is uncontrolled and has no movement). Then the three tip-tilts and the OMC are following that motion - there are two degrees of freedom to center the beams on the WFS, and two more to keep it pointed into the OMC, which is why all three tip-tilts as well as the OMC suspension itself all move. The second through fourth plots are the motions of the BS, SRs, and tip-tilts in pitch. The fifth plot is motion of various OMC DoFs.
It’s not clear why the beamsplitter is moving. It seems likely that the BS pitch resonance is the primary cause of the motion, but it may instead be tracking motion upstream. If the problem is the BS, maybe something is wrong with the local control or maybe some seismic noise is driving the resonance.
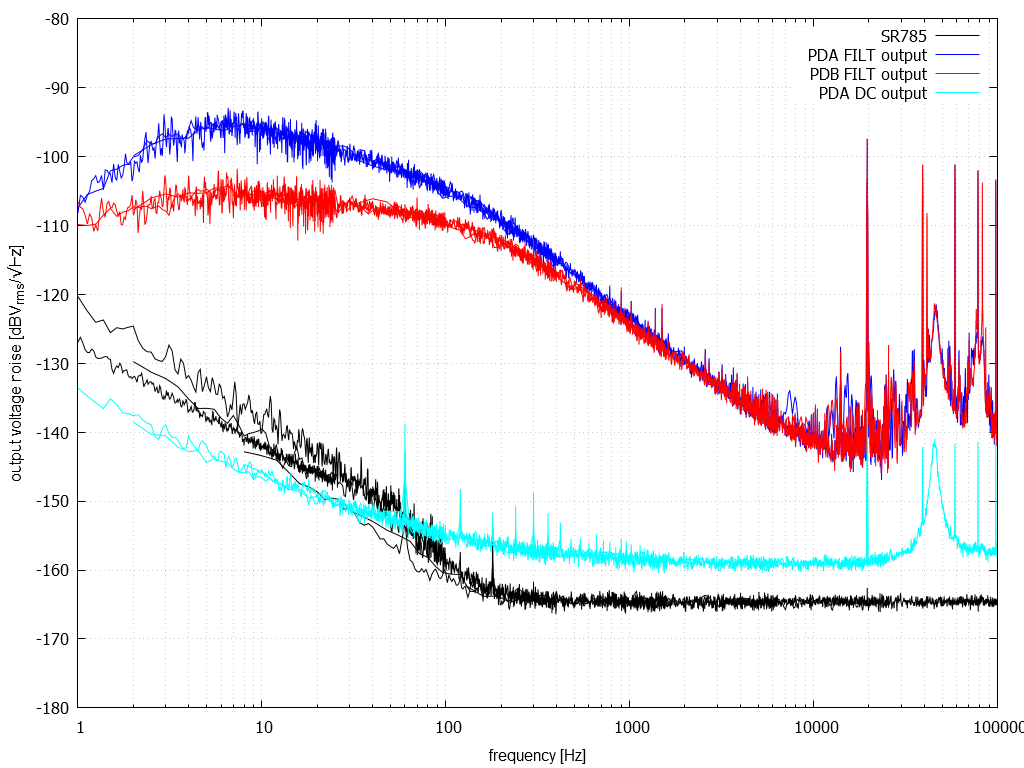
It’s also not clear yet exactly how this couples in. These glitches do not look like scattering arches - they are too high in frequency, have no support at lower frequency, and also there’s no top part of an arch. So it may be jitter, or clipping. The best prediction of the glitches is the pitch position of SR2 as seen by the OSEM. One kind of glitch happens at the maxima, and one at the minima. The final attachment shows this. But we haven’t looked at all channels yet.
Further work can be done by looking at other times when this kind of glitch occurs (GravitySpy can provide those), looking for the cause of the BS motion, and trying to find which of the alignment channels is the best predictor of the exact glitch times.