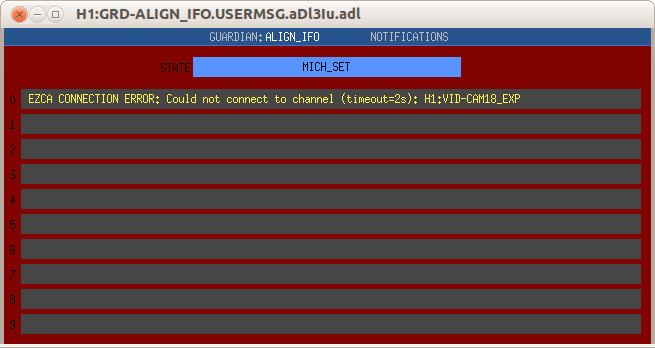
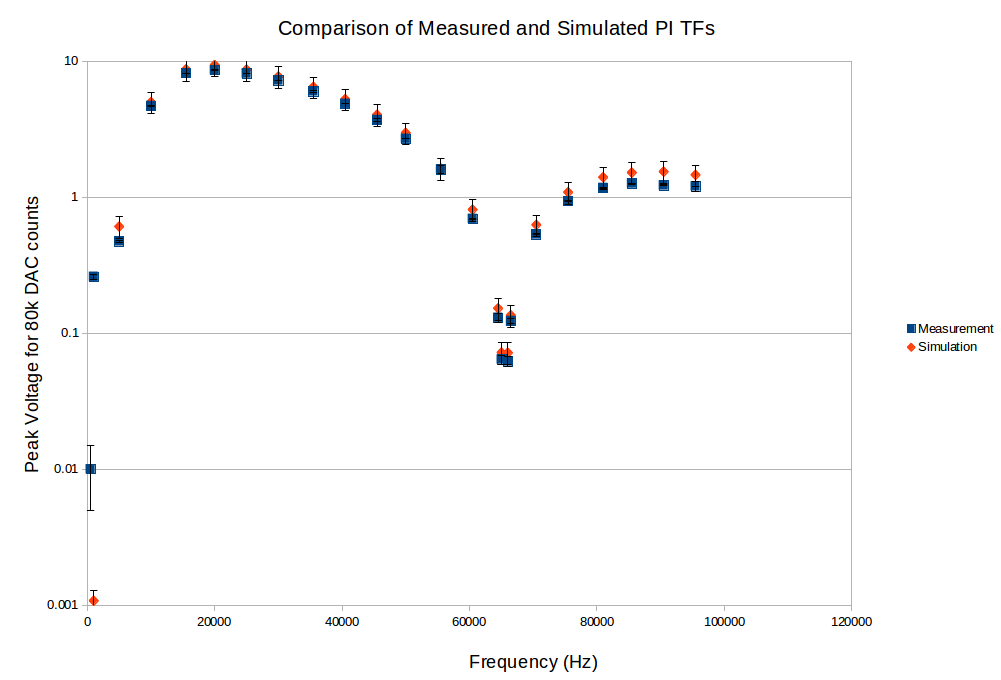
The injection was made at the damping filter H1:SUS-ETMX_PI_OMC_DAMP_MODE4_DAMP_EXC. With H1:SUS-ETMX_PI_OMC_DAMP_OUT_MTRX_1_4 = 1. H1:SUS-ETMX_PI_ESD_DRIVER_PI_DAMP_SWITCH = ON. H1:SUS-ETMX_BIO_L3_UL_STATEREQ = 1. H1:SUS-ETMX_BIO_L3_PI_ULLL_SW = ON. H1:SUS-ETMX_BIO_L3_LL_VOLTAGE_SW = OFF
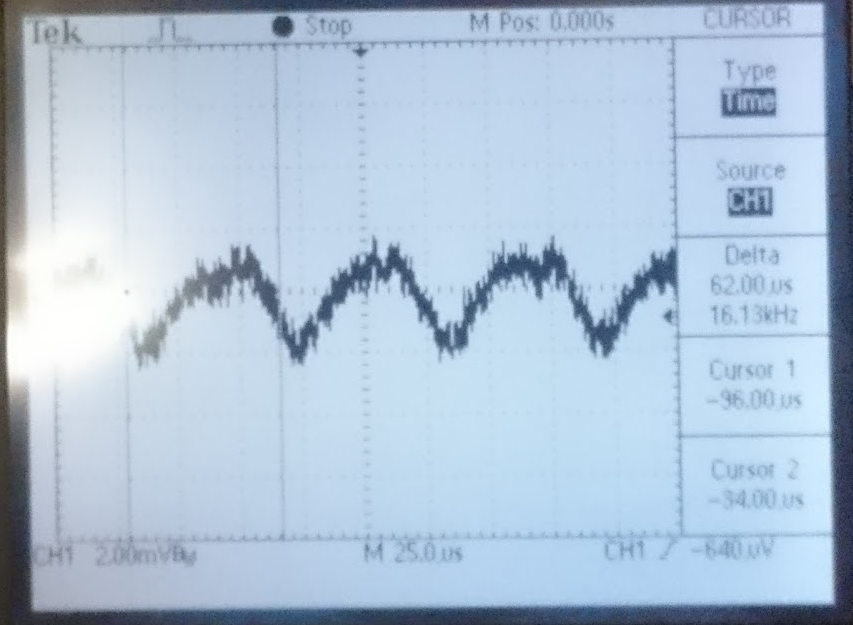
We saw the noise at XEnd ESD LL again at ~1.28 MHz, 15mV pk2pk. Rich A. came out to have a look; believe the noise be real (a real oscillation in the hardware).
On LR drive, we also saw the spectrum glitching (bouncing up and down) when driving at 15.5kHz; goes away with no drive signal (note we did not try other drive frequencies yet). Some beat making a low frequency component?
The source of the 1.2Mhz oscillation was identified by opening the spare chasis and looking for marginally stable opamp stages.
The stage that is marginally stable is U6 page 7 of D1500016. It can be made to oscillate at ~600khz or ~1.2Mhz. The stage is a configurable with the pole/zero bypass bit.
When for example the H1:SUS-ETMX_BIO_L3_UL_STATEREQ control word is set to 2 the stage has a pole at 2.2Hz. This is the normal low noise configuration. In this configuration there is no 1.2MHz oscillation.
When this control word is set to 1 the stage is nominally a unitly gain stage. In this configuration some channels (like UL UR LL and LR) have a Q of >5 at 1.2MHz and can be induced to freely oscillate. This oscillation may be damped with a 30pF capacitor across R21.
As this oscillation is not a problem in the low noise configuration no changes will be made. Testing PI channels should be performed with the H1:SUS-ETMX_BIO_L3_UL_STATEREQ control word set to 2.