Craig, Sheila, Rana, Terra, Jim, Evan
In light of 27483, we wanted to try to balance the test mass PUM common/differential and hard/soft actuation. As a start, we wanted to make better common/differential actuation for the ETMs and ITMs (next we will try to make better hard/soft actuation).
We drove the ETMs in common-mode (pitch and yaw) and looked at the AS 45 Q pitch/yaw signals. We then adjusted the L2 LOCK P/Y filter gains in order to minimize the AS 45 Q signals. Gain adjustments of a few percent were required. The biggest reduction in AS 45 Q was a factor of a few; the smallest was basically nil.
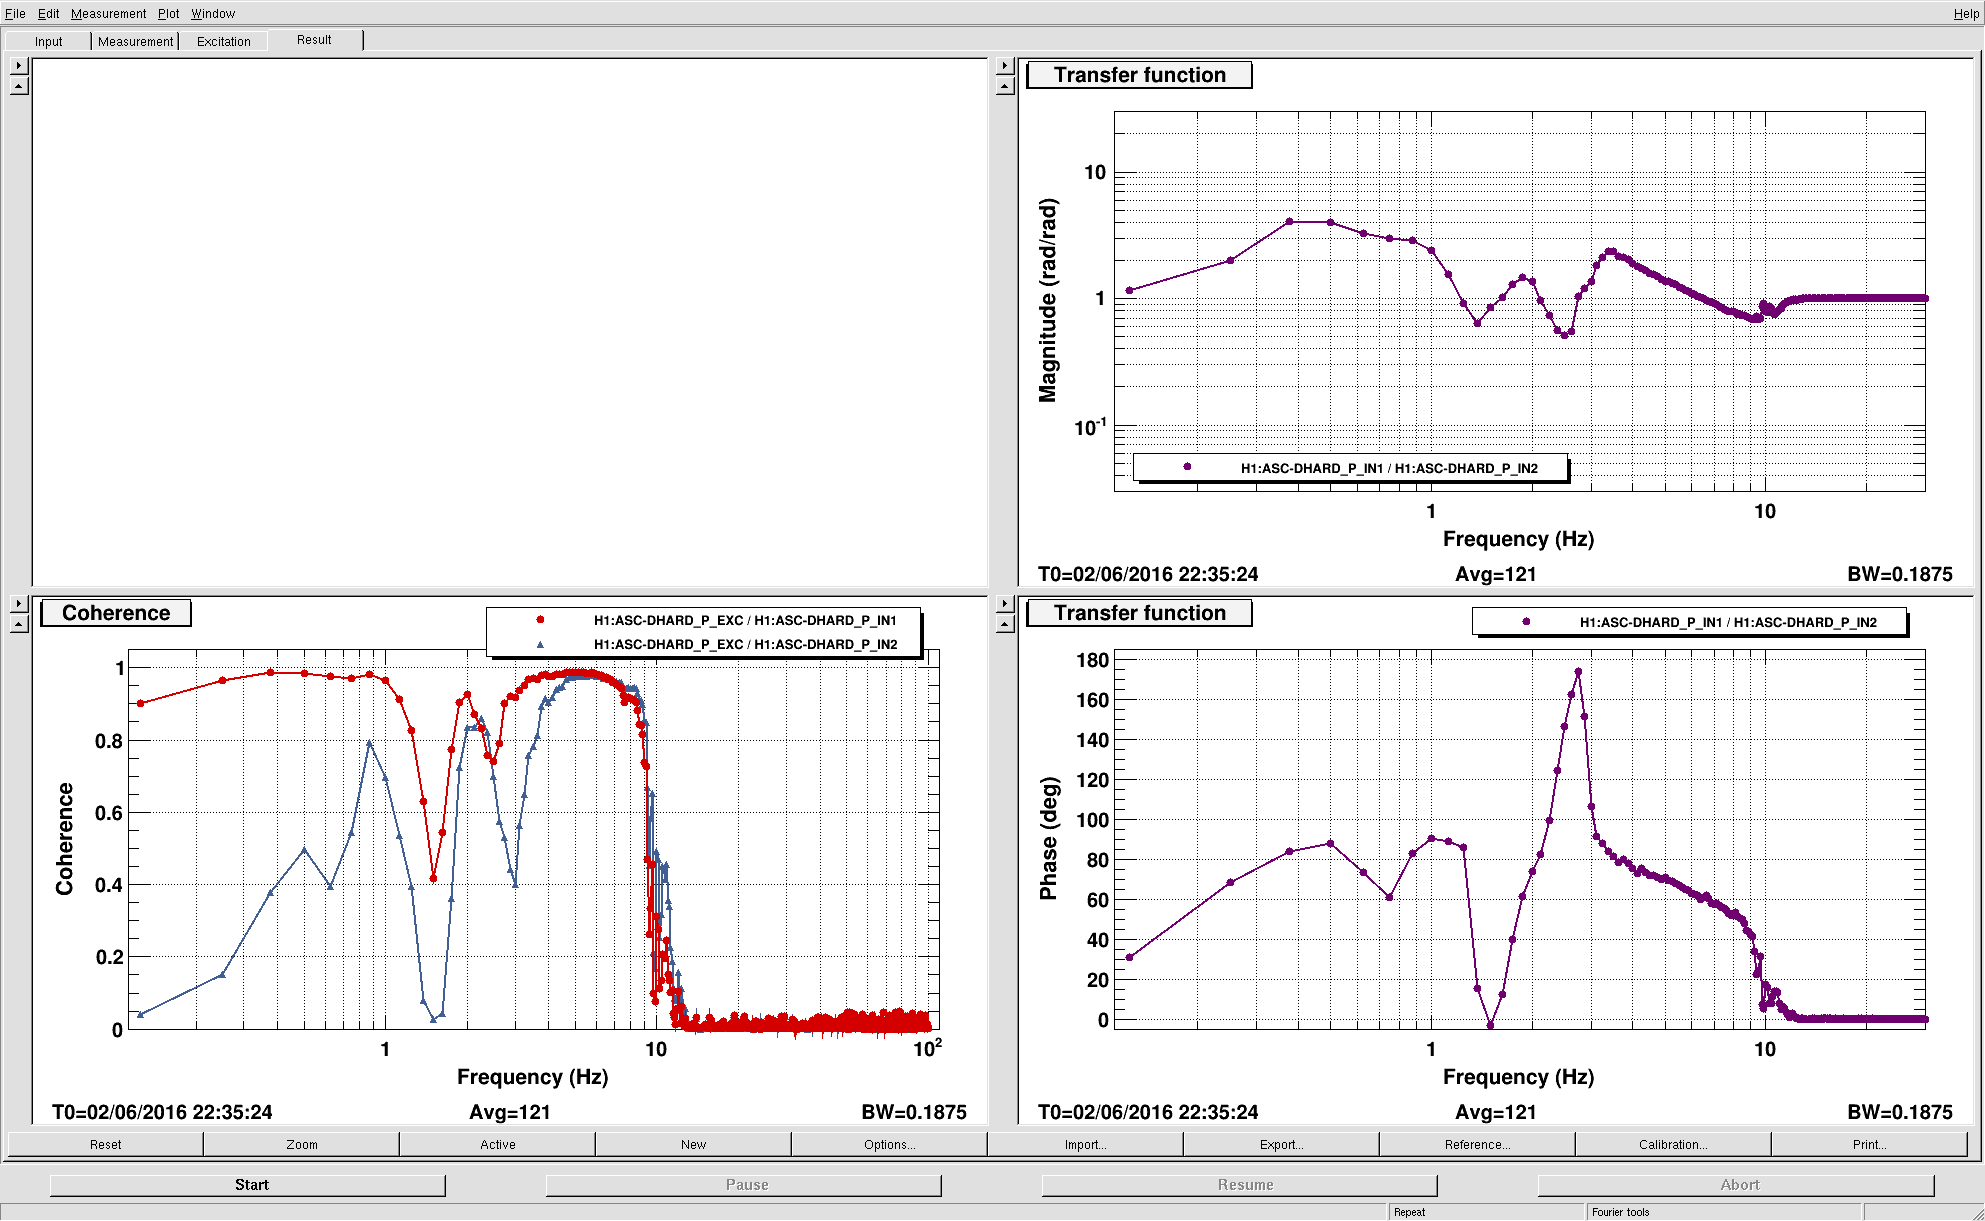
Along the way we noticed that there was essentially a 1:1 cross-coupling between cHard pitch and cHard yaw when driving ETMs (i.e., driving cHard pitch would produce equally sized signals in both cHard pitch and cHard yaw). This could be explained by the transmon roll orientation causing a rotation of pitch into yaw at the QPDs. However, removing the QPD blending (i.e., using REFL A/B 9I only) for cHard reduced the cross-coupling by a factor of a few.
So it seems that the transmon QPDs are not aligned with the ETMs pitch/yaw alignment. However, the REFL pitch/yaw seems rotated from ETM pitch/yaw by ~30 deg. The ITM drives do not produce this cross-coupling. We want to minimize this to reduce the Hard looop pit/yaw instability that we saw. Should we rotate the REFL WFS matrix to align with the ETMs or ITMs?
We lost lock twice trying to switch CARM to in-vac control, so that needs to be debugged tomorrow.