Ross, Tega, Evan, Terra
Tonight we successfully damped a known parametric instability at 15540.6 Hz with the newly implemented ESD damping scheme.
In April last year, this mode was detected in the X-arm during a 15W lock. Ultimately it was avoided by turning on the ETMX ring heater (0.5 W requested power top and bottom), shifting the optical mode peak down in frequency and away from ~15540 Hz mechanical modes. To test the new active damping scheme, we turned off the ETMX ring heater, allowed 15540.6 Hz to start to ring up during a 24W lock, and damped it by driving the UR and LL quadrants of the ETMX ESD.
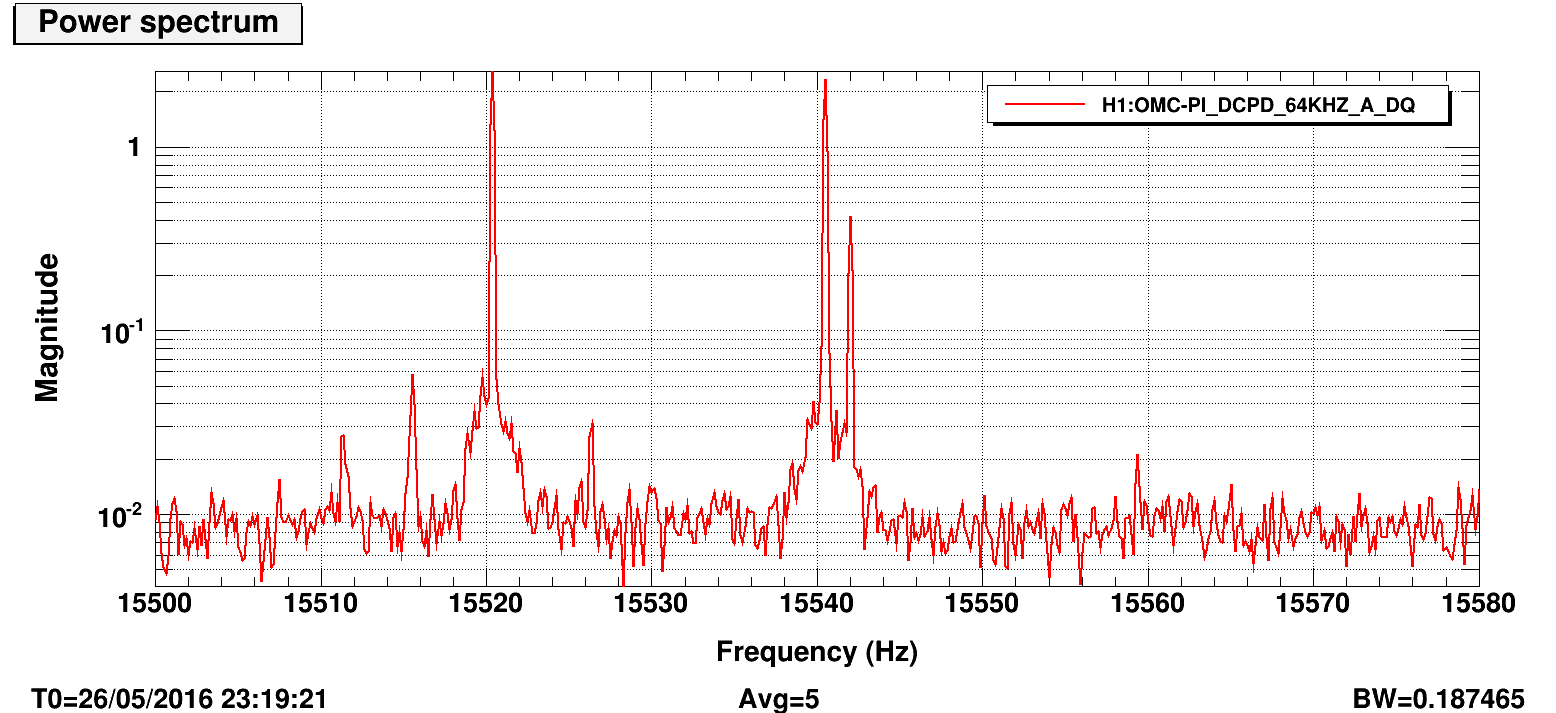
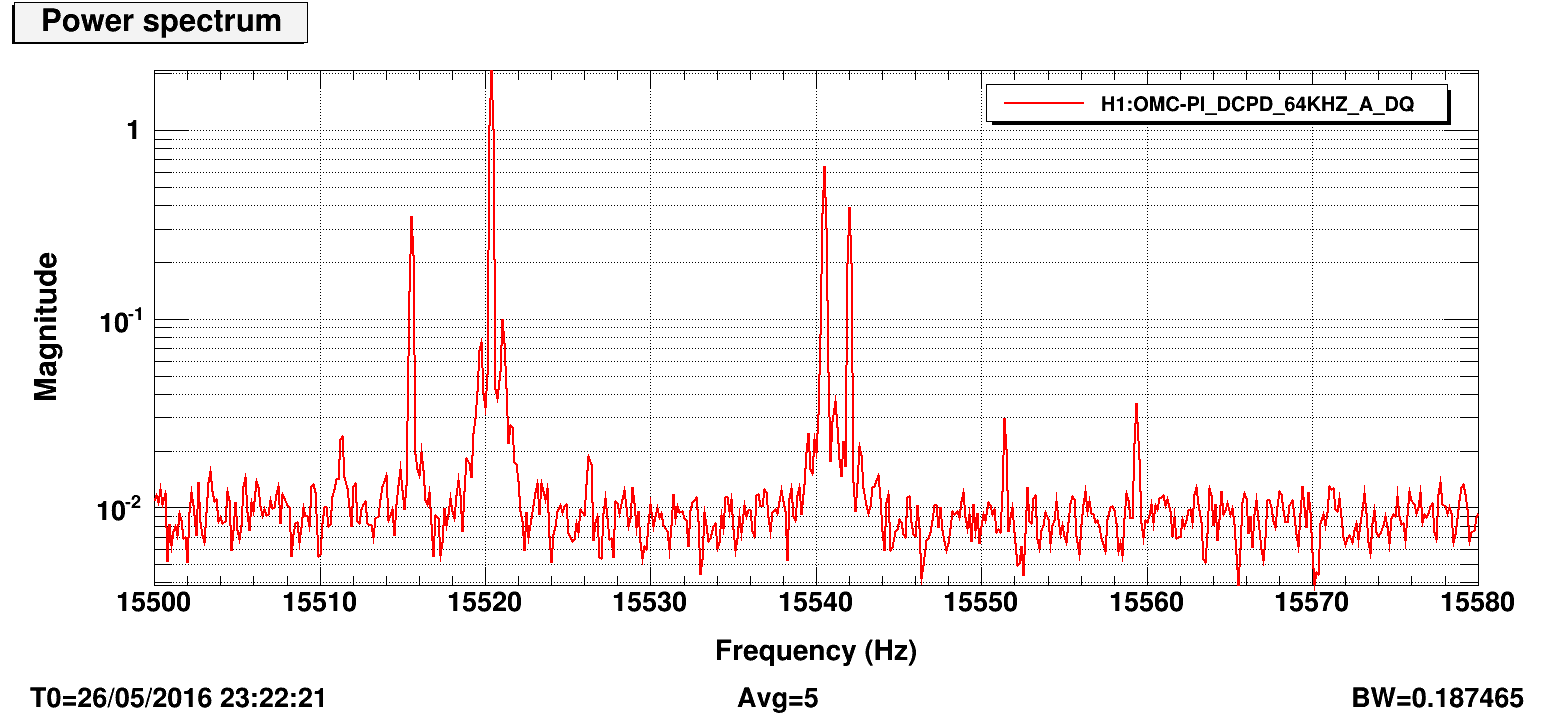
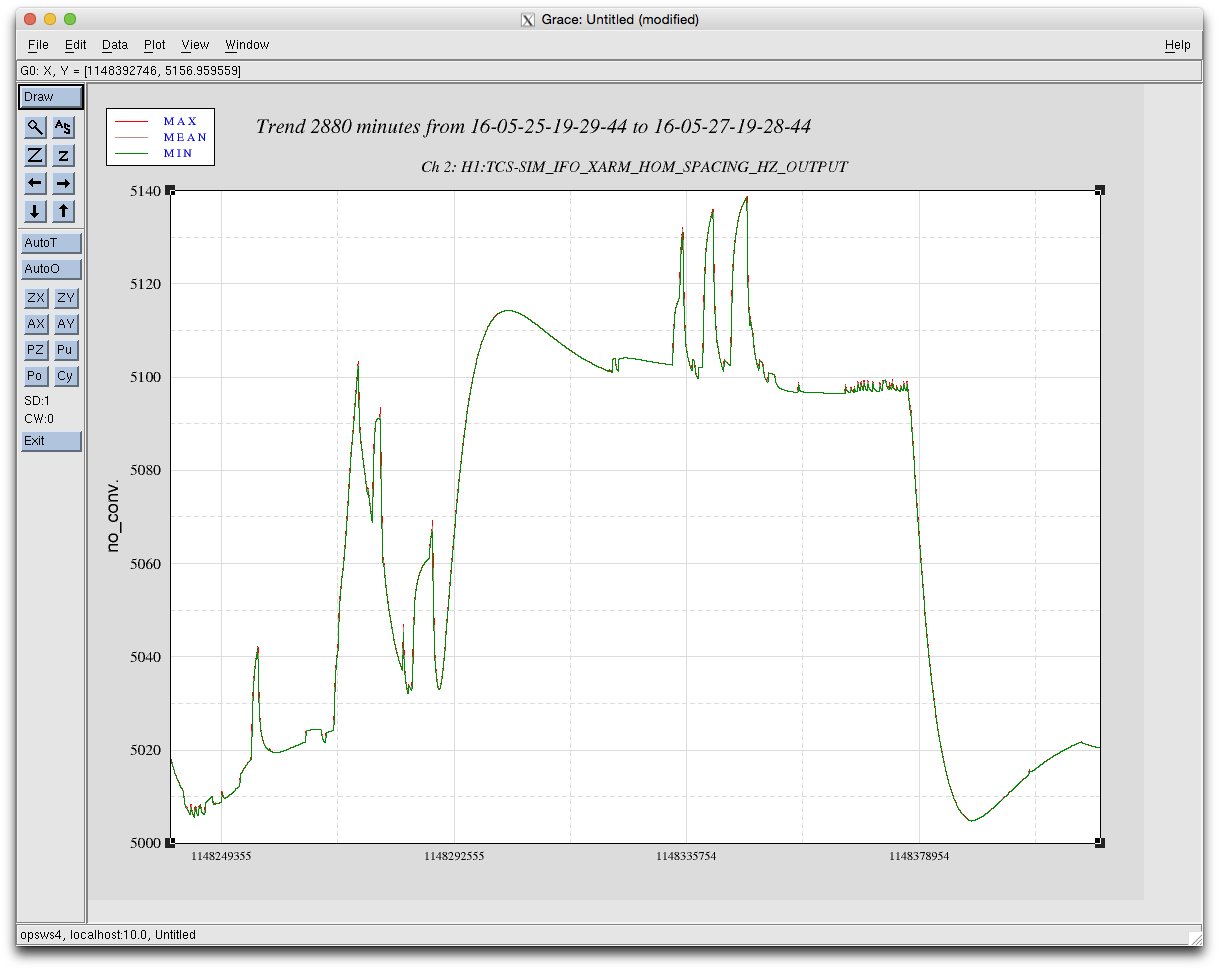
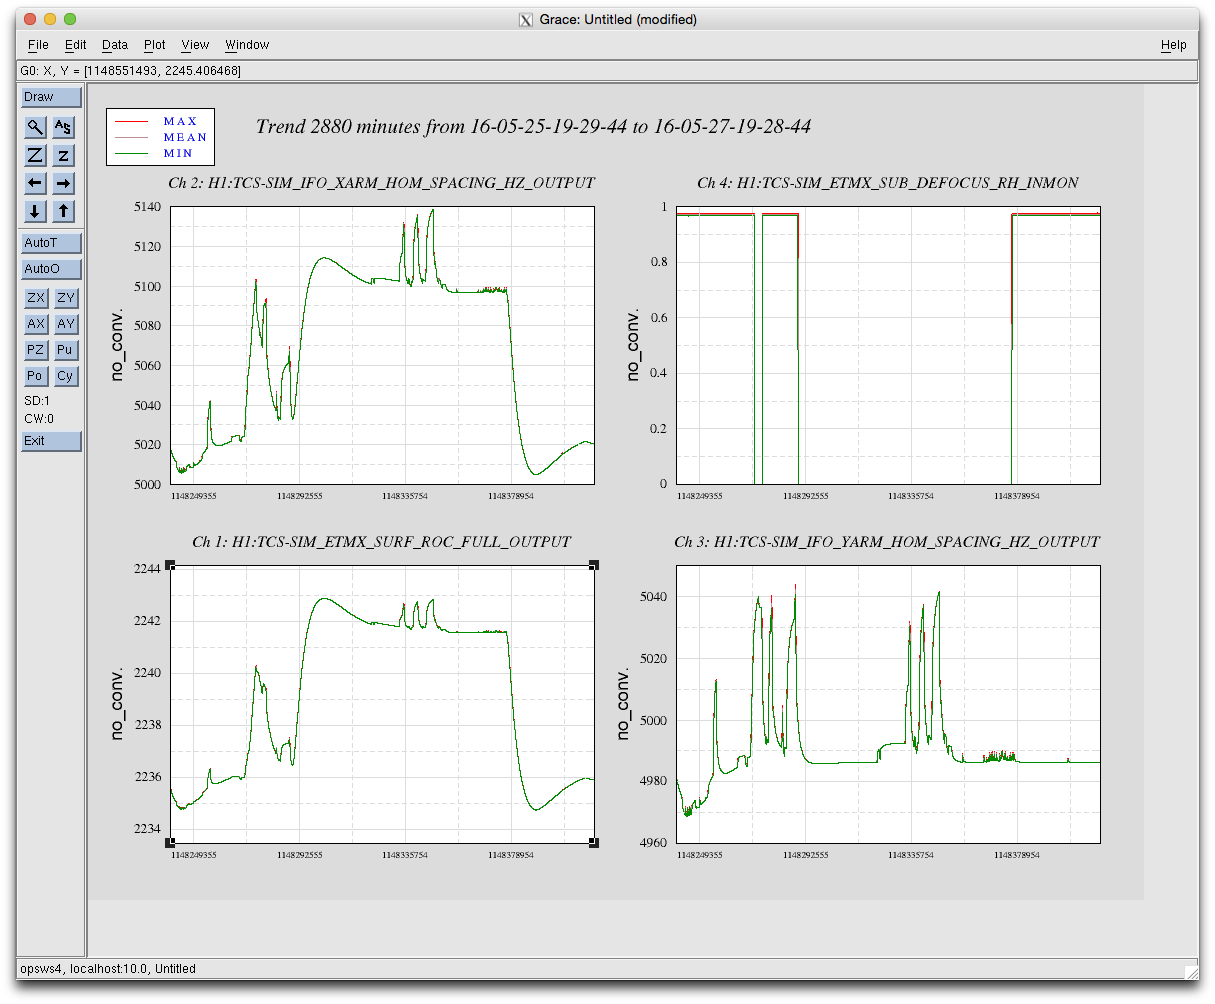
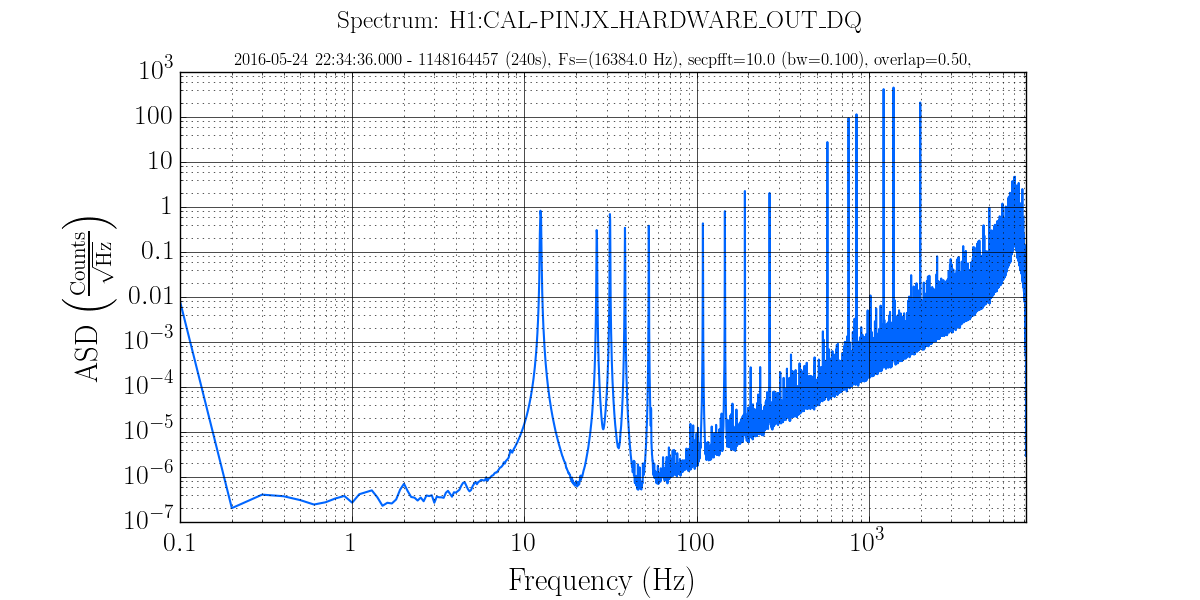
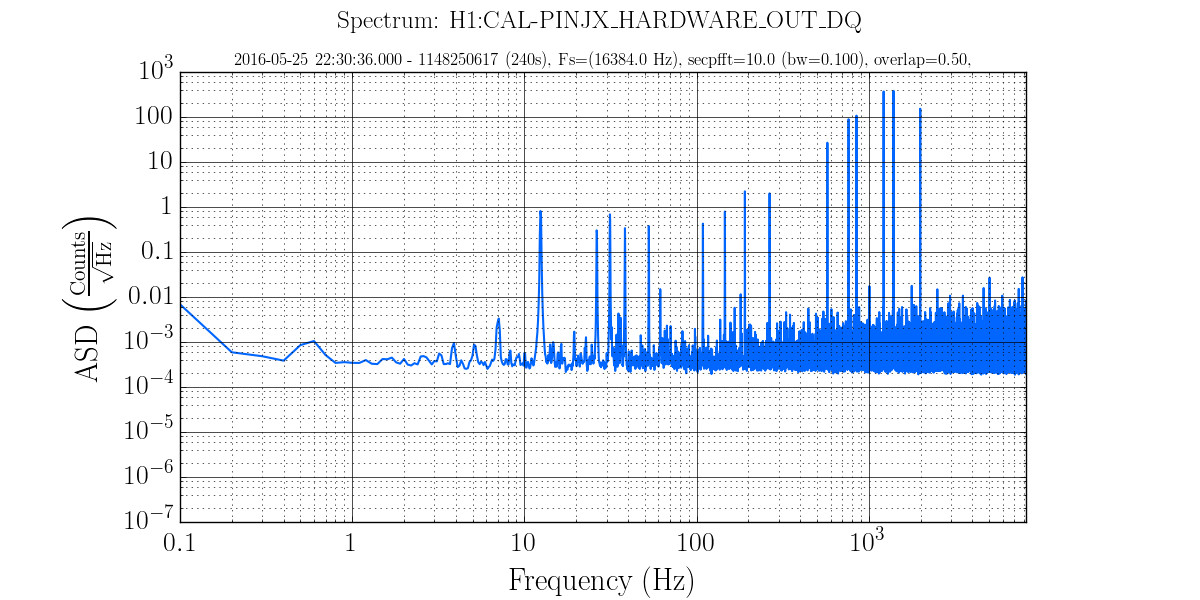
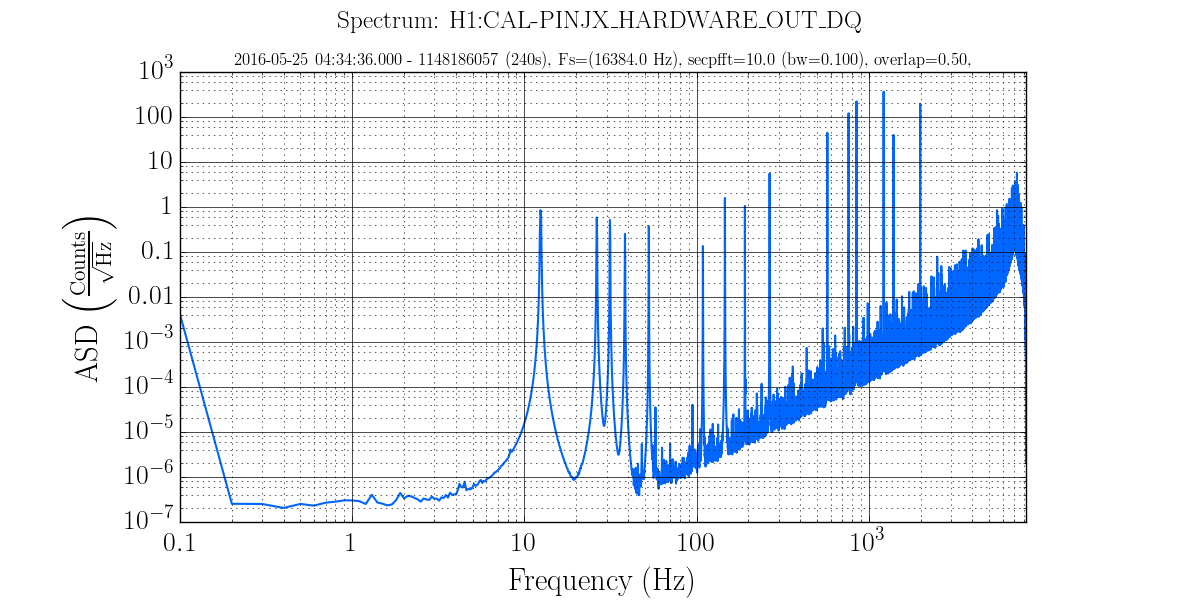
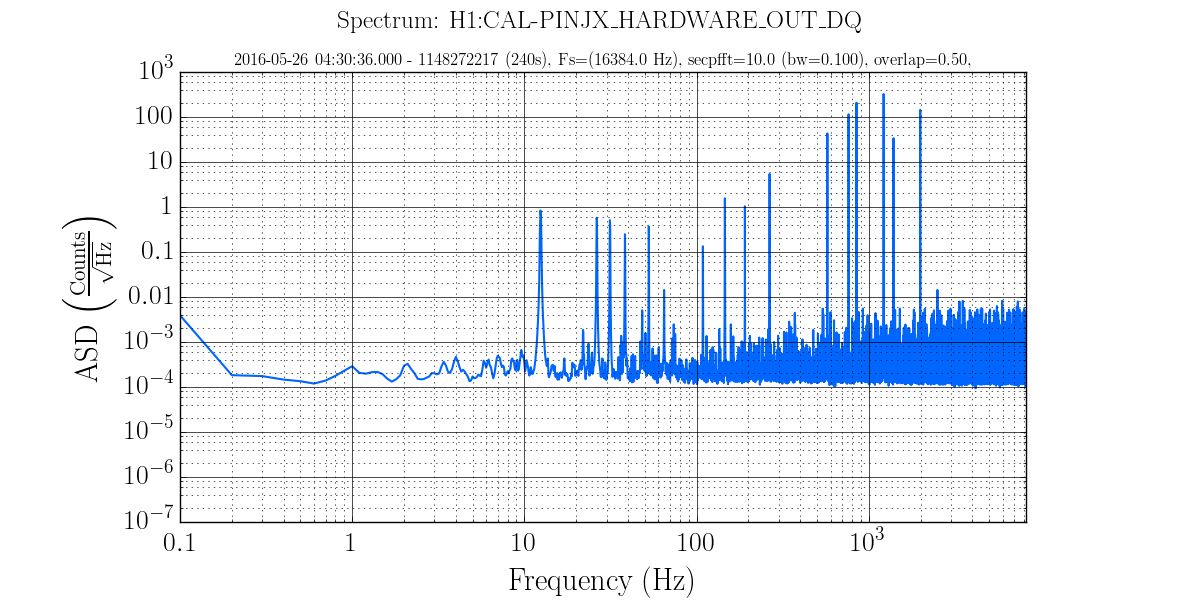
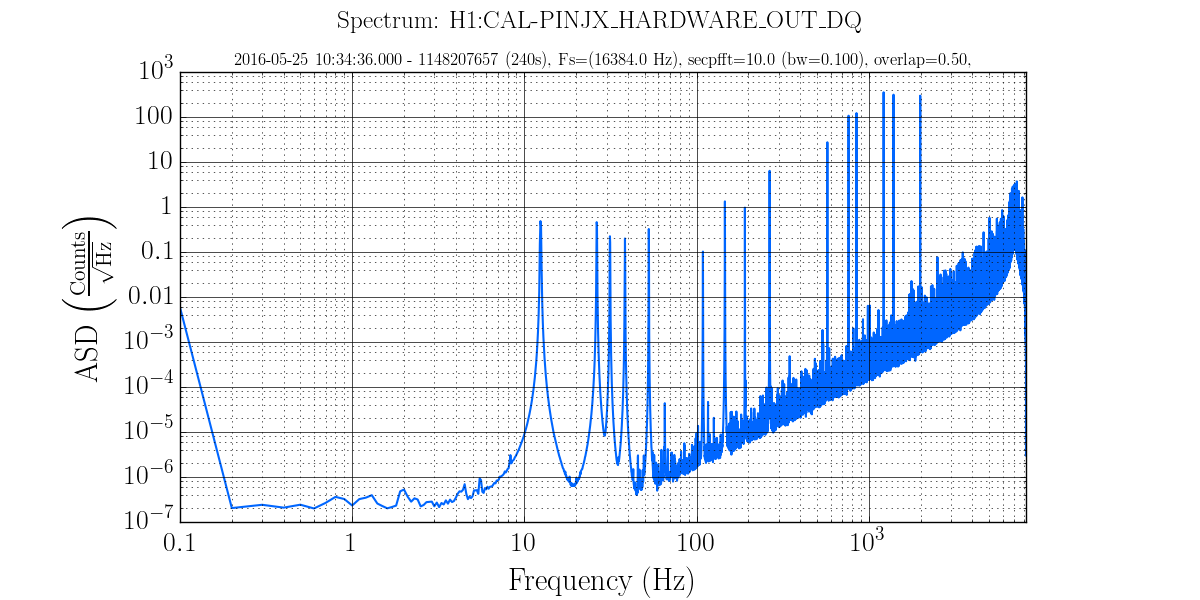
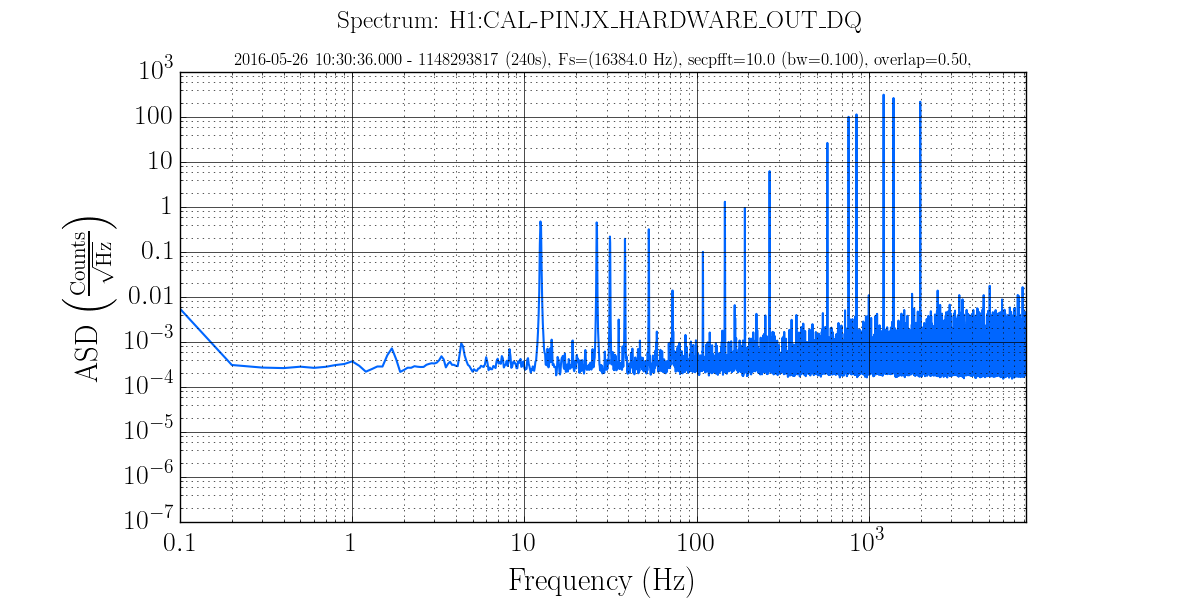
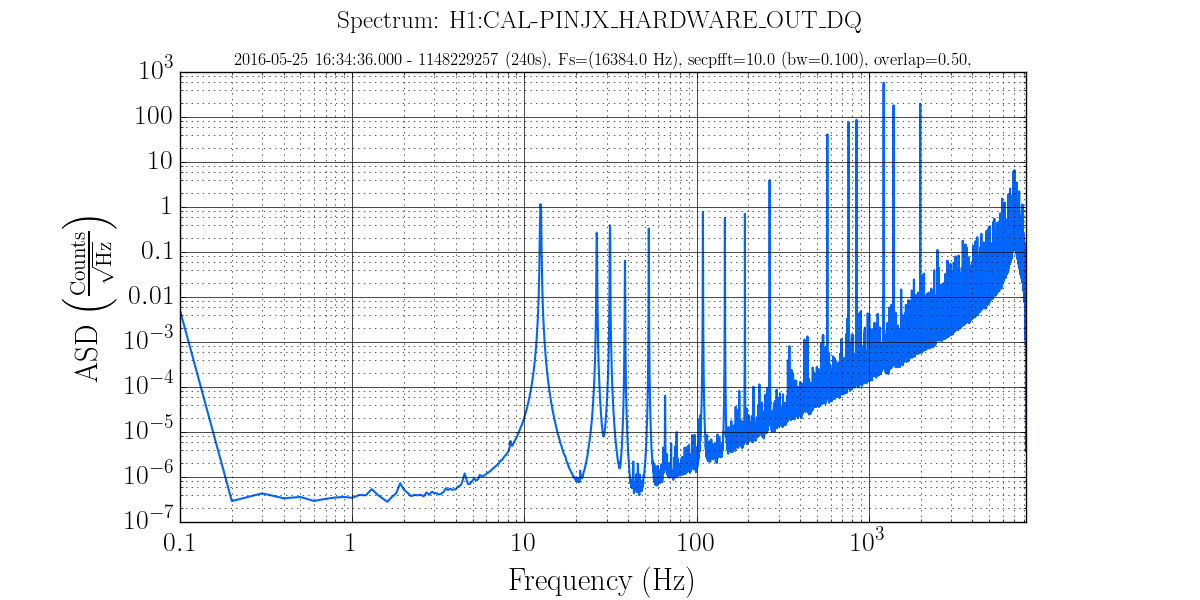
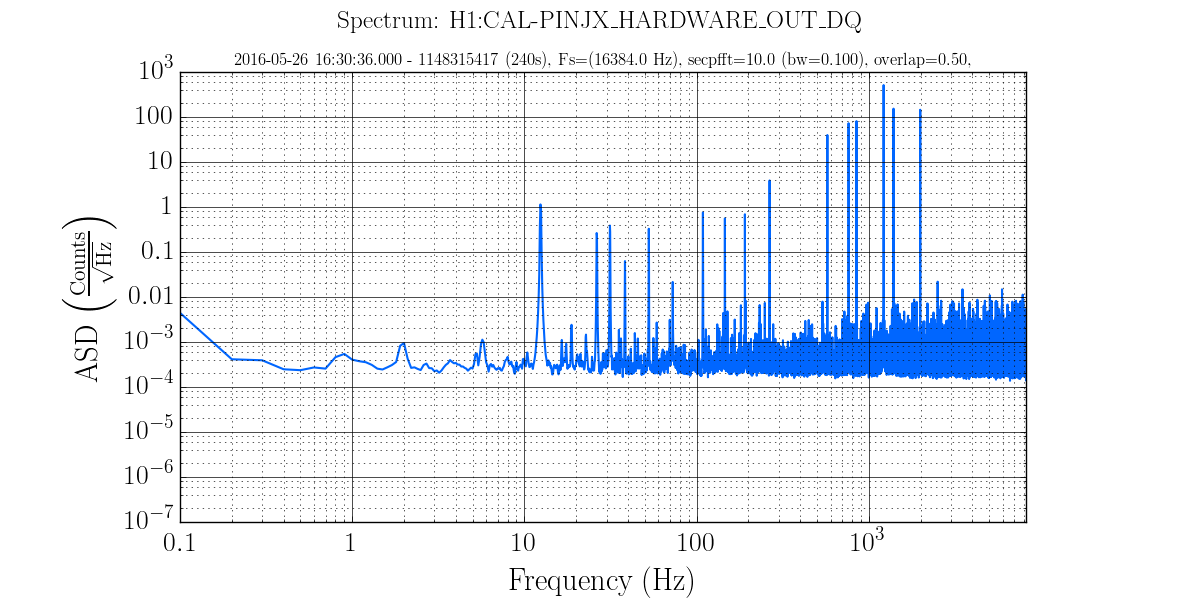
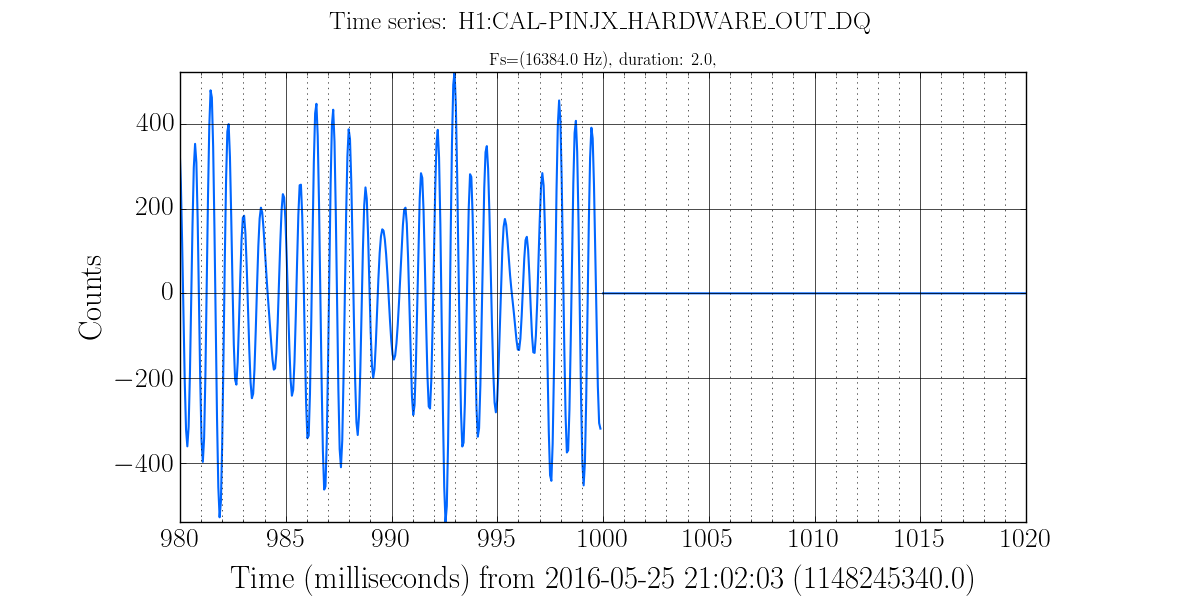
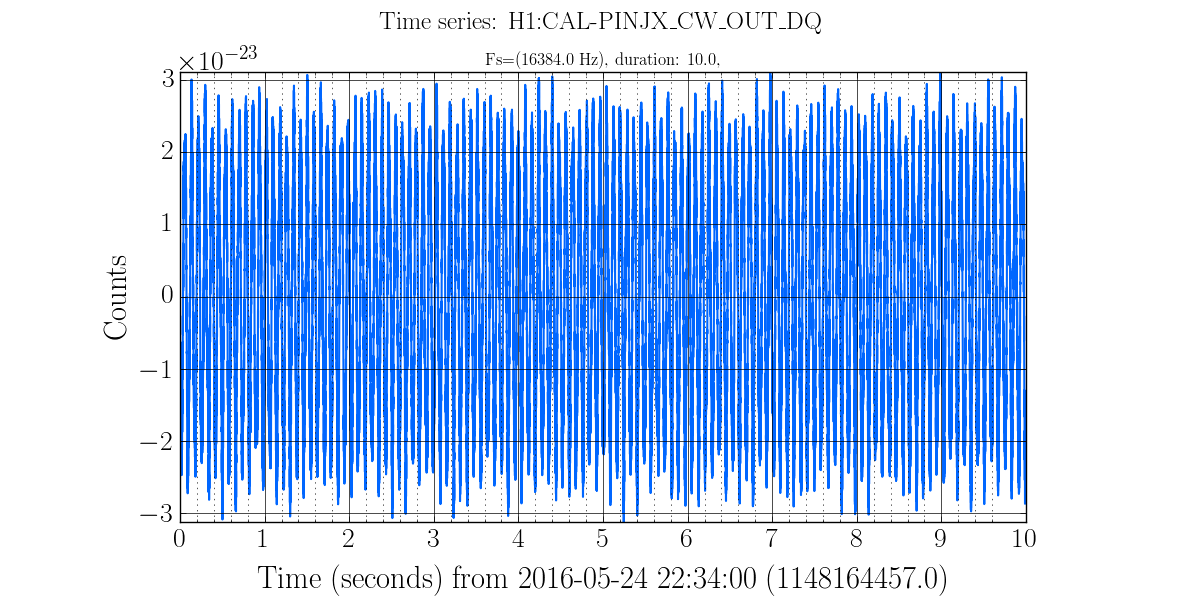
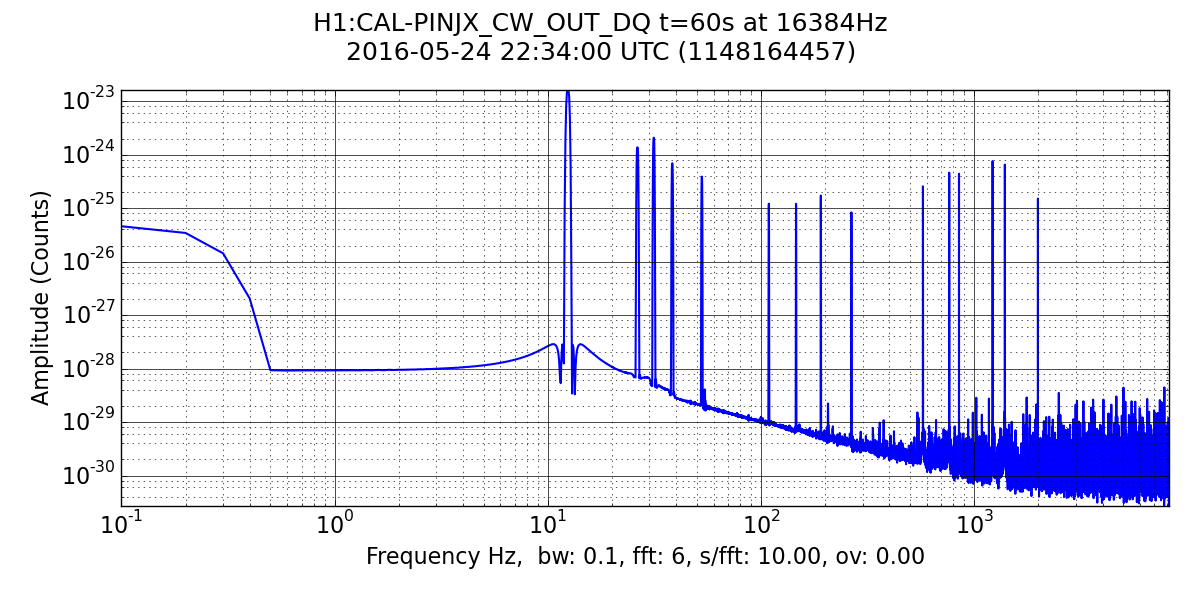
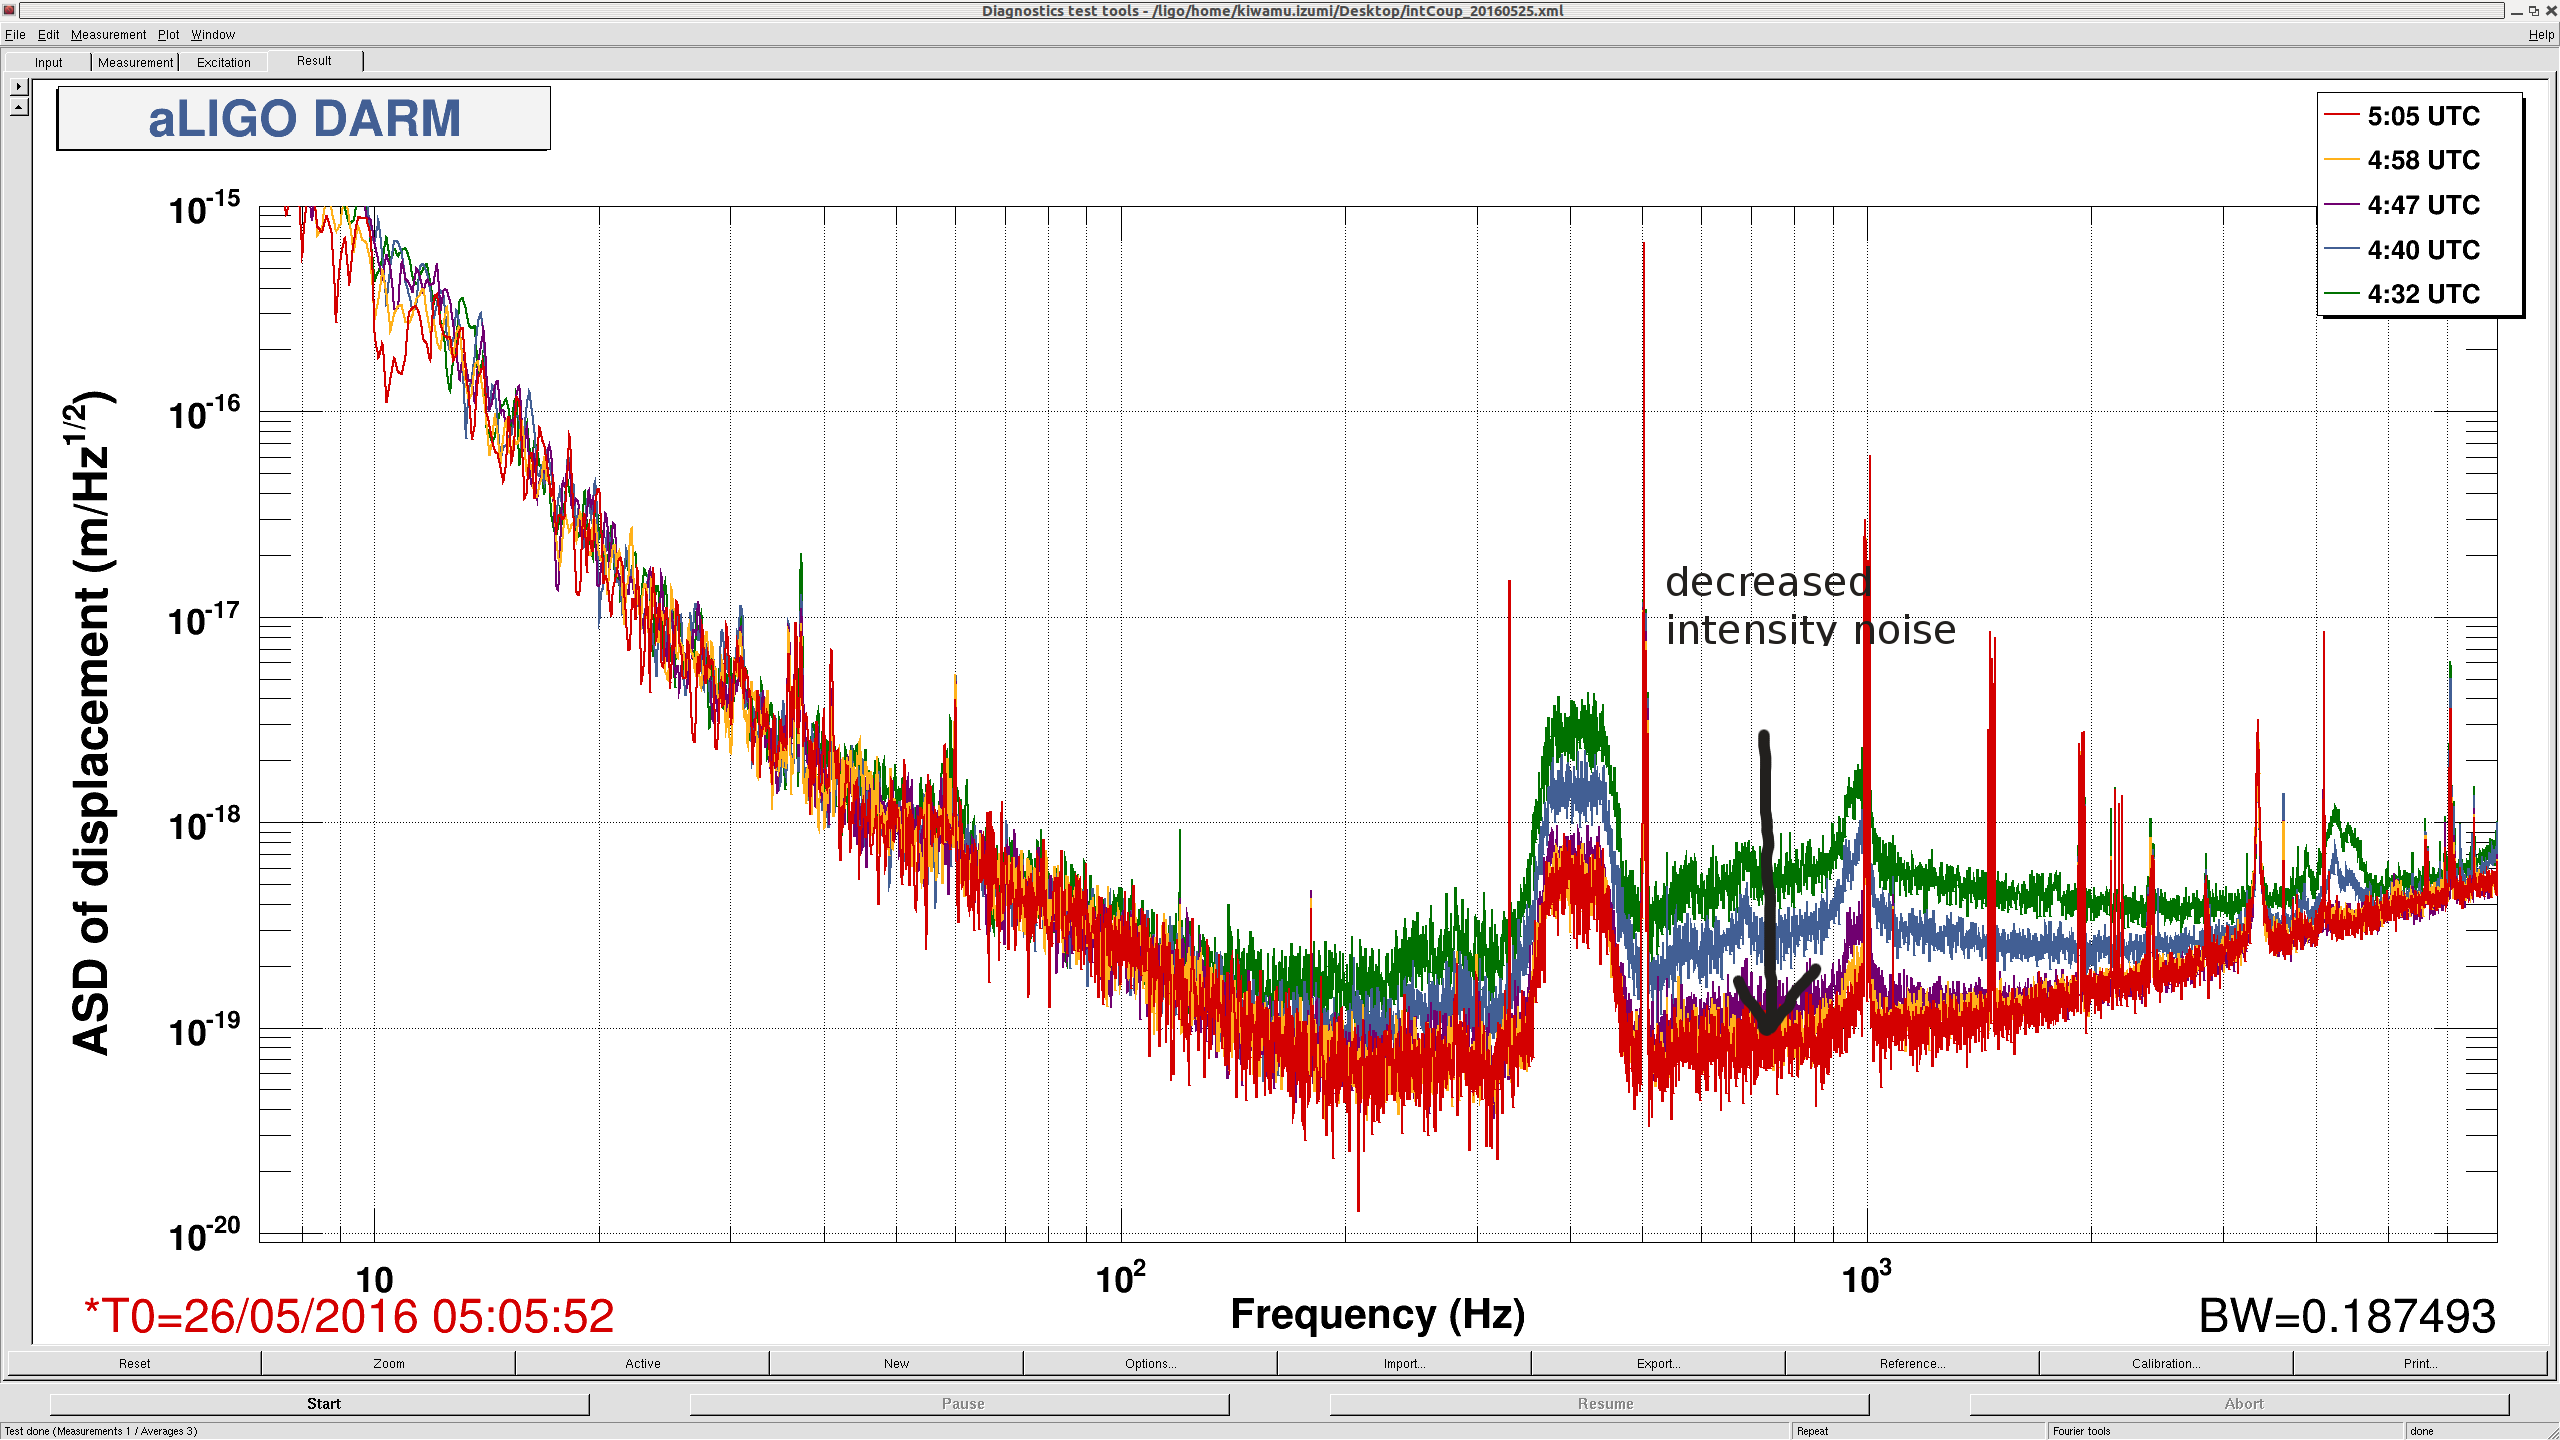
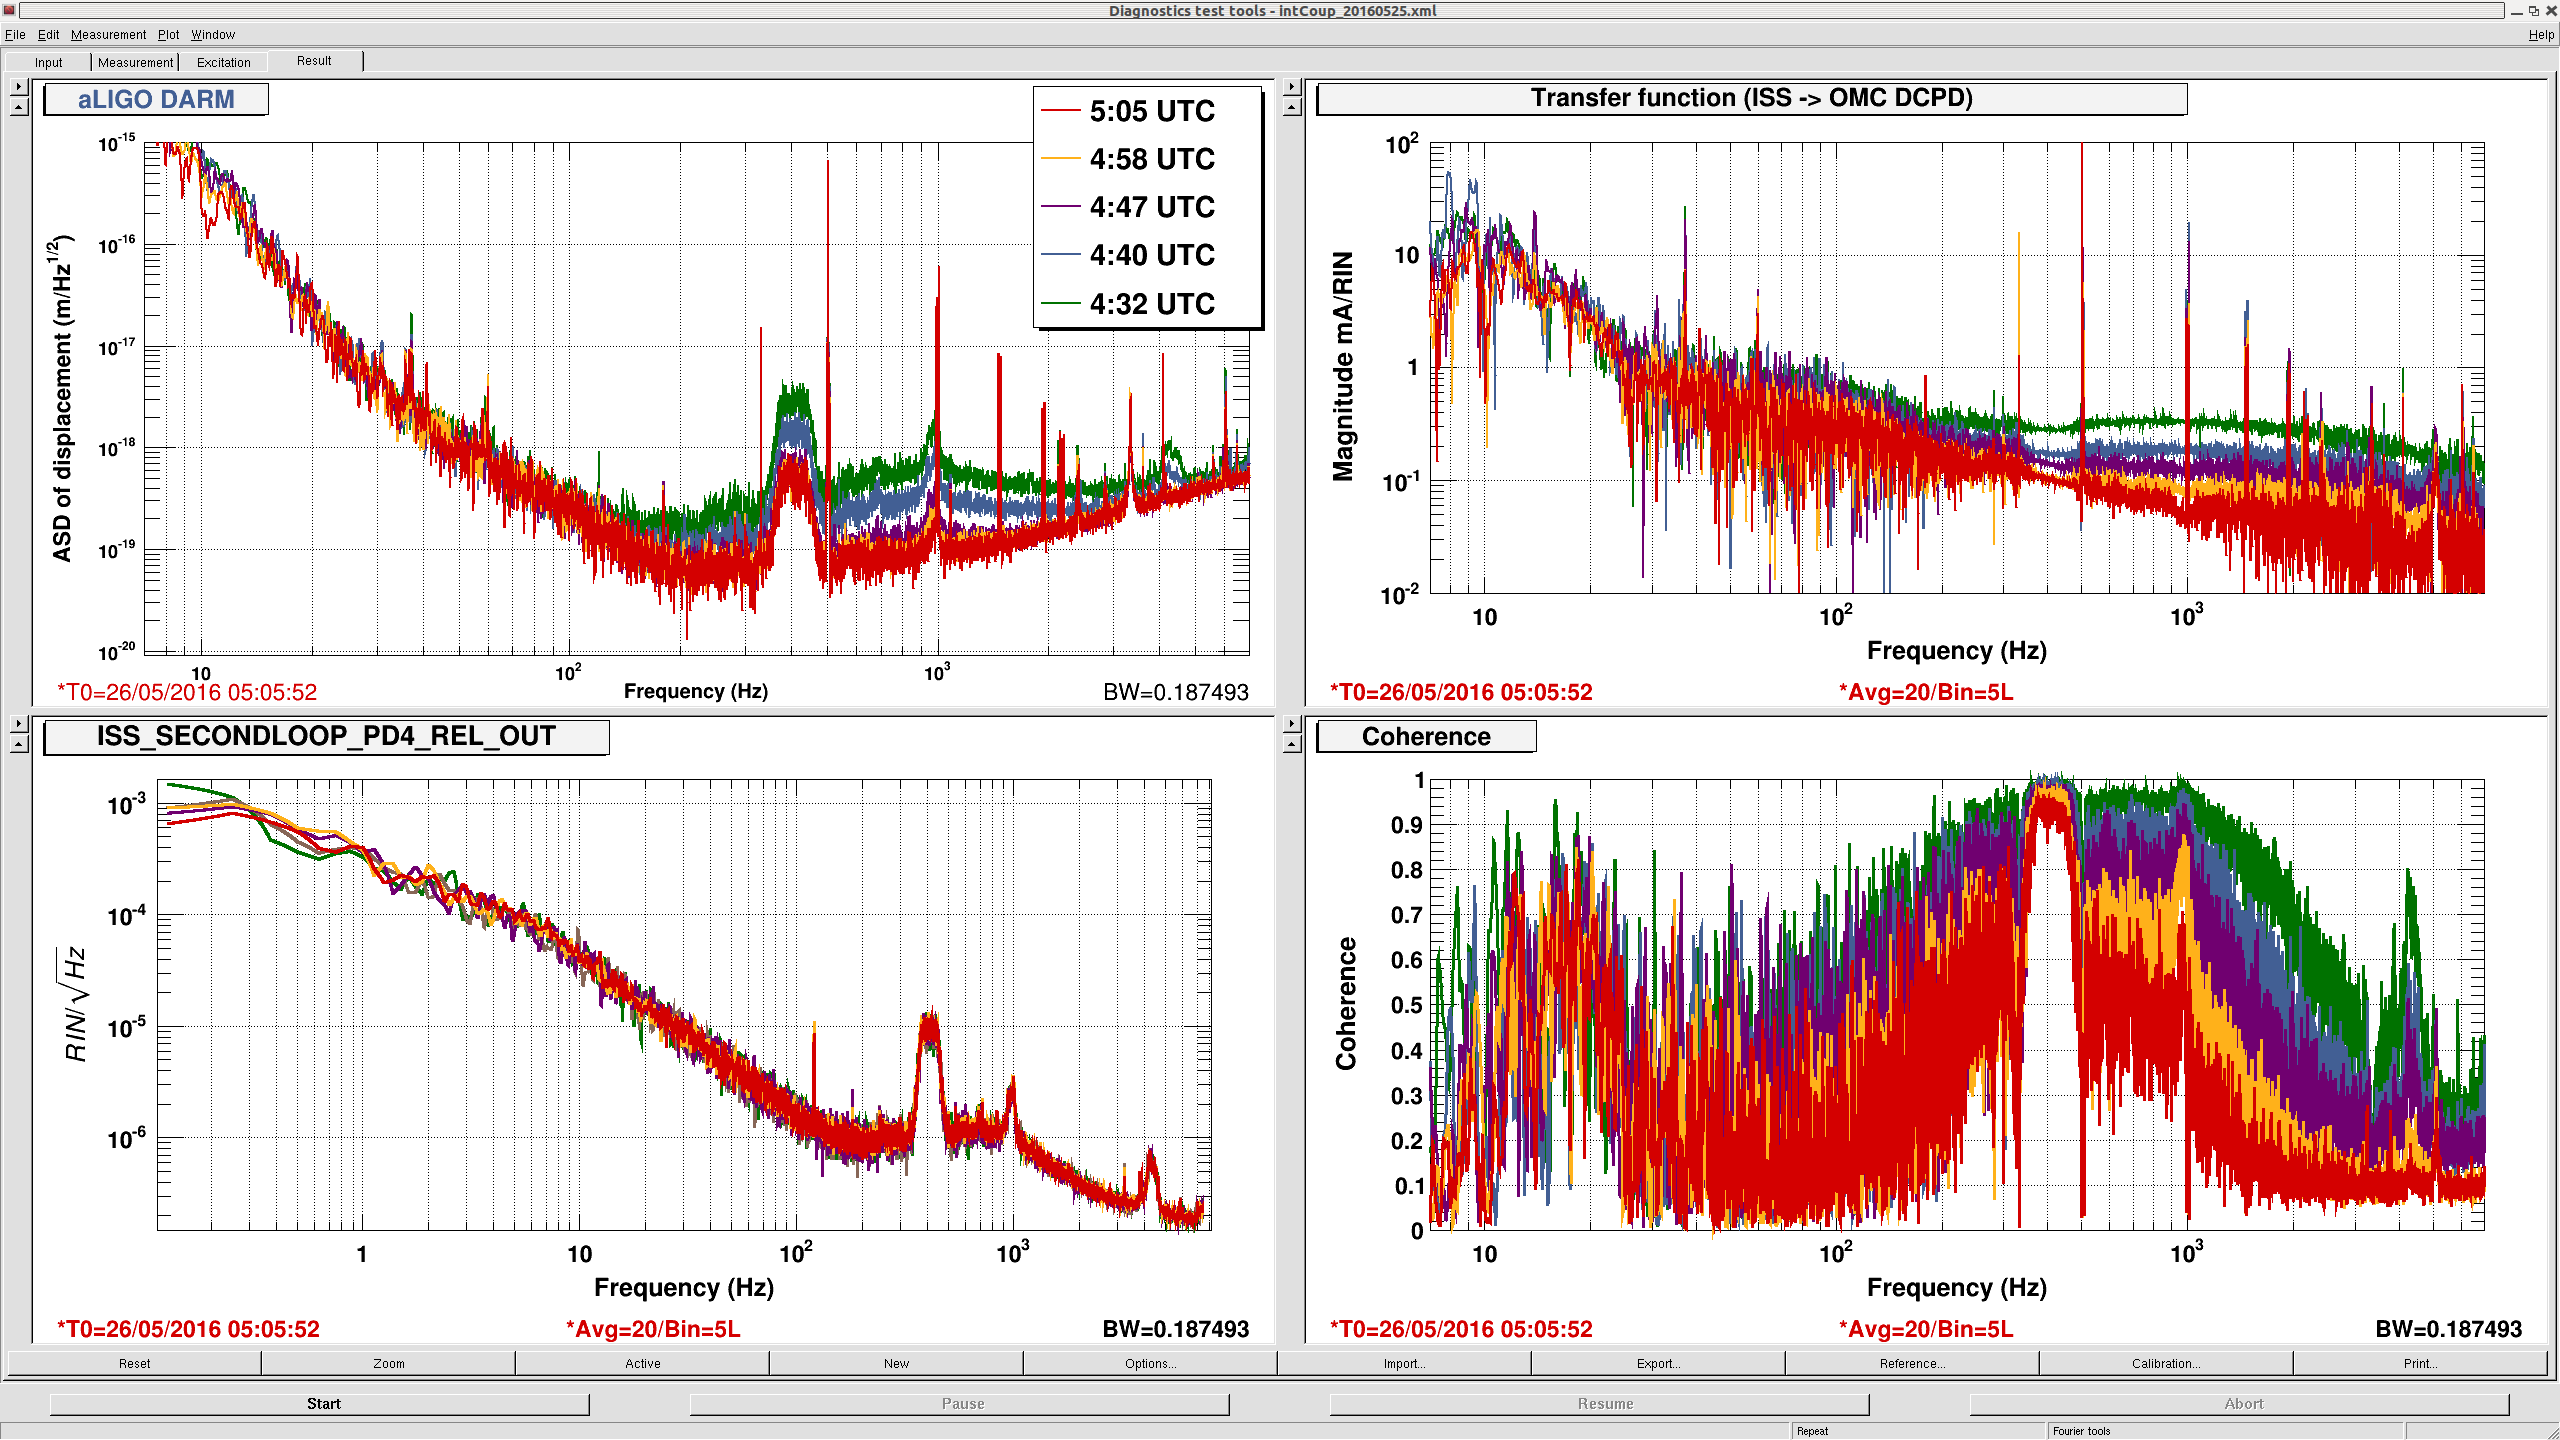
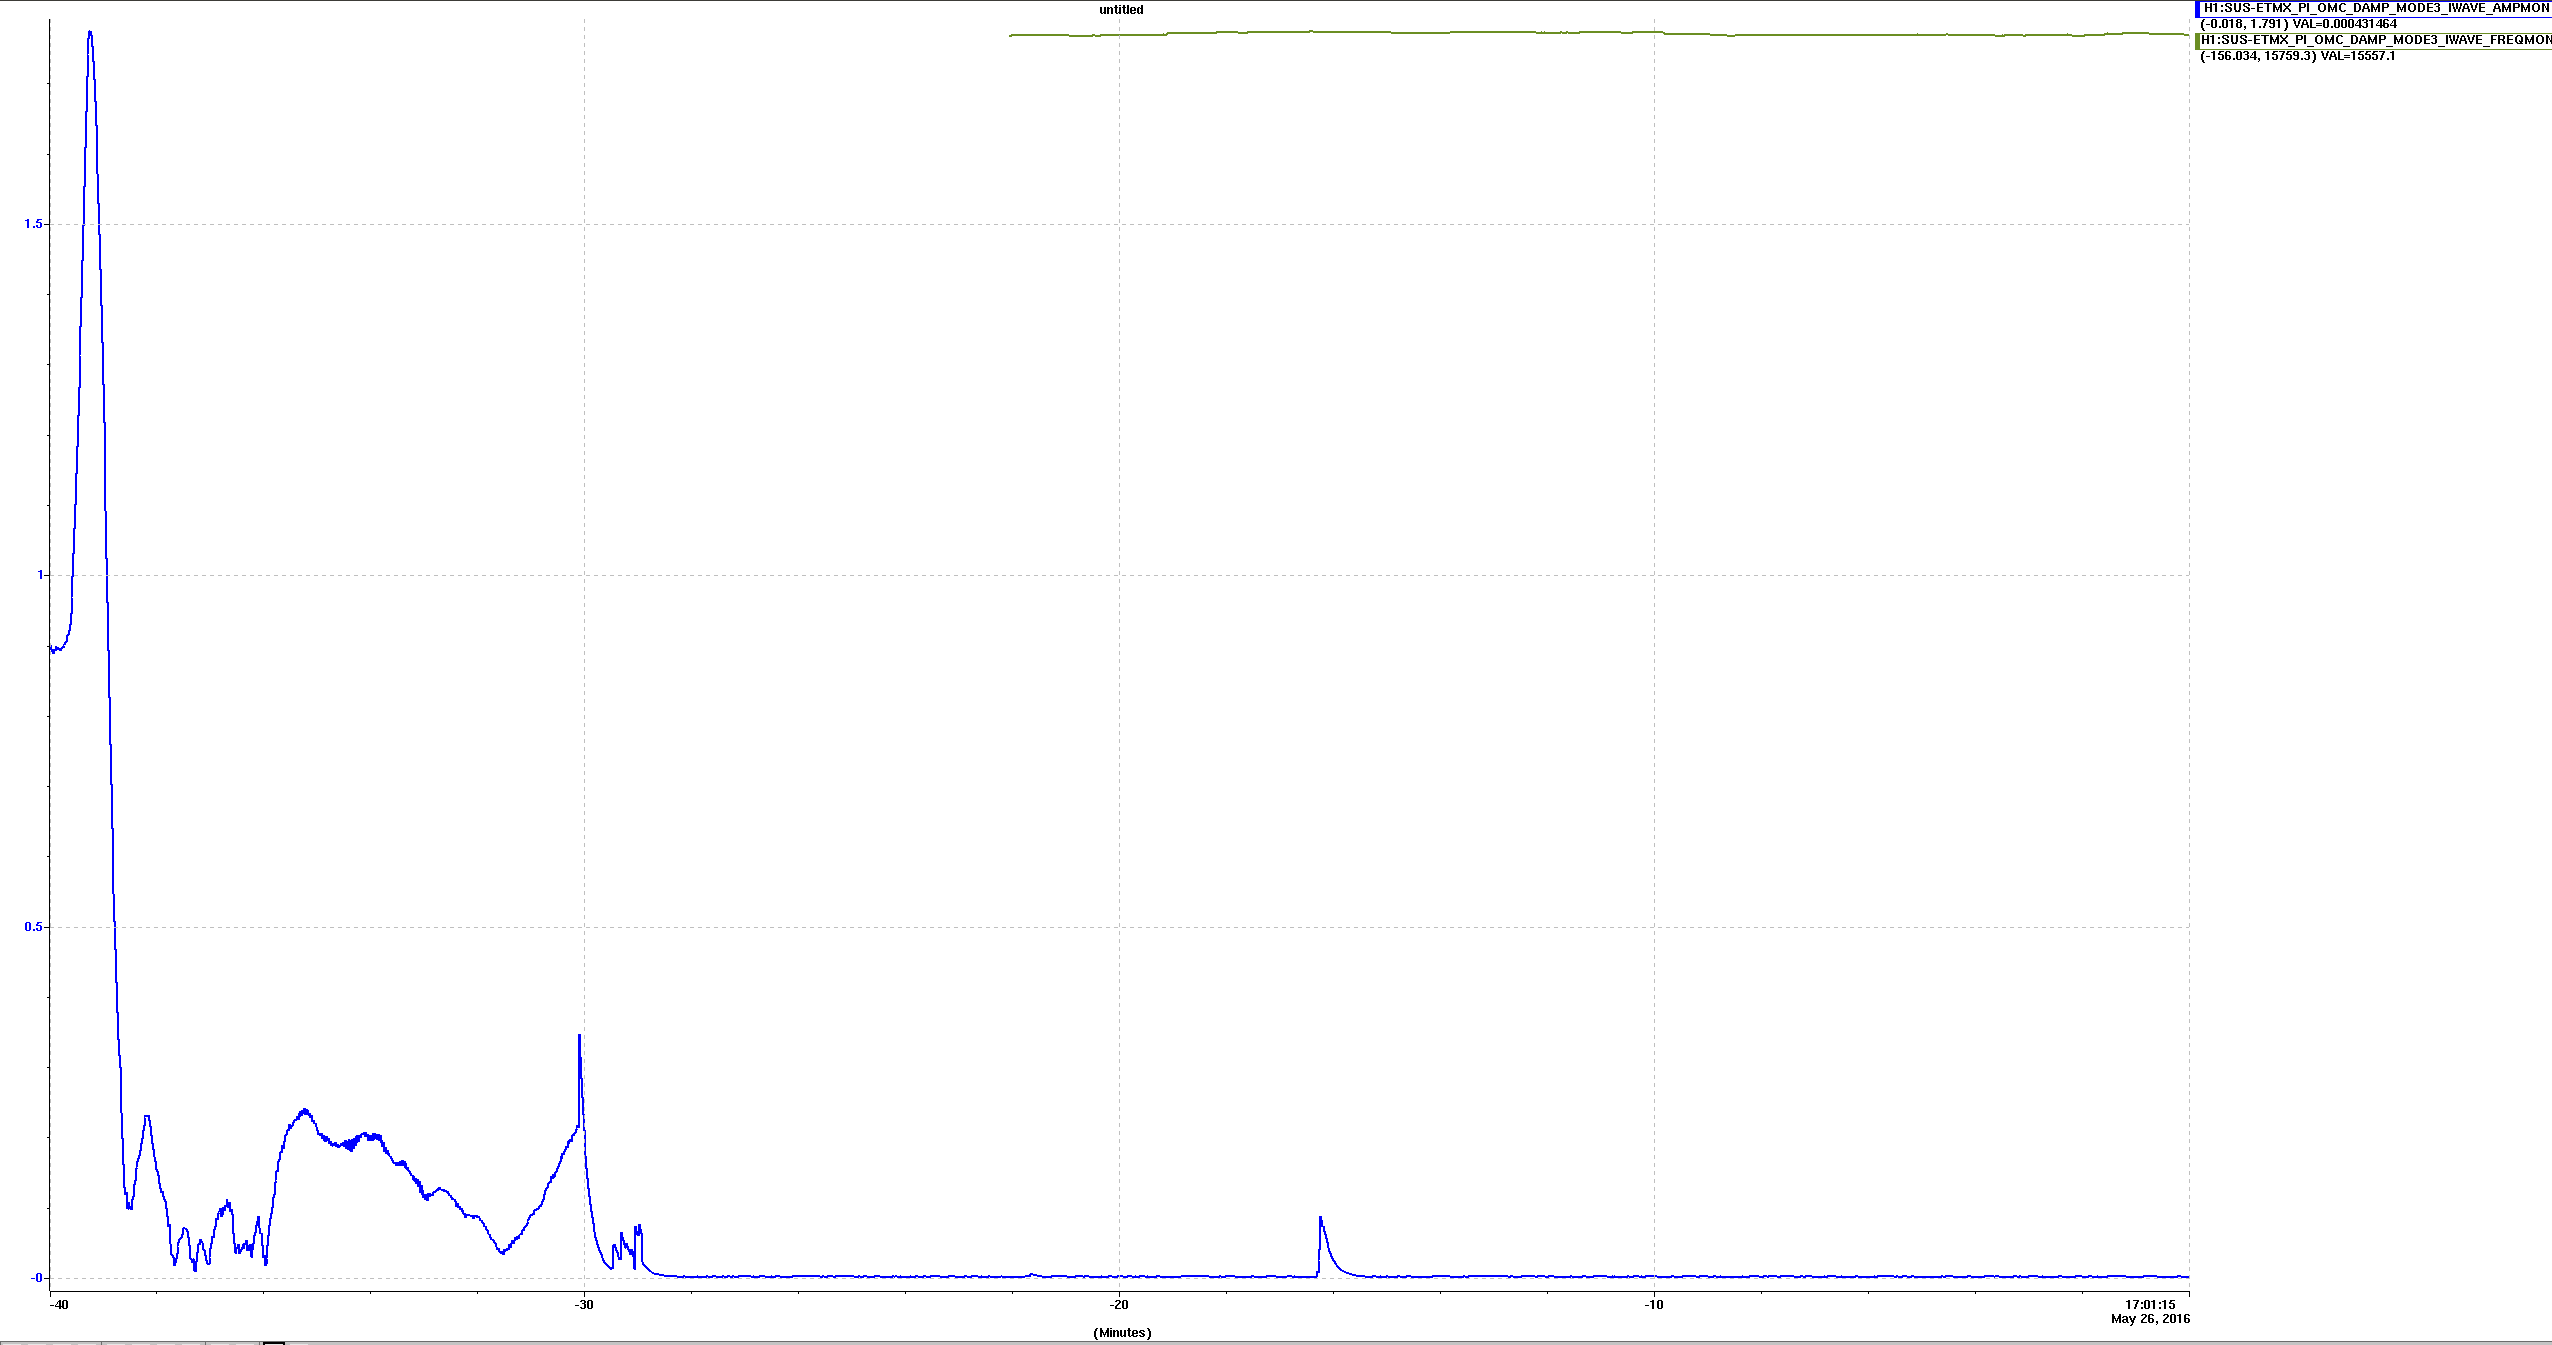
Below we tracked the amplitude of the ~15540.6 Hz mode. Leftmost action is the important part: first we briefly manually rang it up (gain -1000) before switching the gain sign (gain +500) to rapidly damp. Attached images show power spectrum before damping and immediately after. We had planned to ring up and down again to get a better idea of the gain settings, but with the newly low magnitude peak, the line tracker got confused with another peak ~1 Hz away and then we lost lock shortly after, for unrelated reasons.
Briefly, the damping set up: We grab the mechanical mode signal from the OMC transmission DCPDs (H1:OMC-PI_DCPD_64KHZ_A) and send it to the relevant end station, downconverting before the trip and upconverting after using synced oscillators set approximately to the known mechanical mode. There, the mechanical mode peak is tracked with iWave. Output is run through a damping filter for gain control and finally sent to actuate on the UR and LL quadrant of the ETM LNLV ESD. Overall, we get early detection of PI from the OMC and actuation on the test mass with the exact equal but opposite mechanical mode frequency that is ringing up, enabling damping to happen earlier in the lock aquisition process before PI has as much time to ring up. This is necessary as we increase power yet remain working with relatively low actuation force from the ESDs.
PI at 15520: While working with 15540.6 Hz, we witnessed a mode at 15520 begin to ring up as well. During a second 24W lock, we allowed both to ring up ~15 min; they grew rapidly at similar rates, ultimately producing a strong 20Hz comb and breaking the lock. Will investigate (and attempt to damp) more this weekend.
We didn't get another good lock to test on tonight and we're still working out issues so I've left the damping system in manual mode and have turned the ETMX ring heater back on.