WP5857 Keith, Rolf, Jim, Dave:
Tuesday 3rd May we upgraded the CDS front end systems and the DAQ to RCG3.0.2
The order of build-install was:
-
Clean out H1.ipc file
-
Compile all models (105 models)
-
Install all models into target area
-
Take down DAQ and recompile all DAQ code, restart DAQ
-
Reboot one SUSAUX FEC to test
-
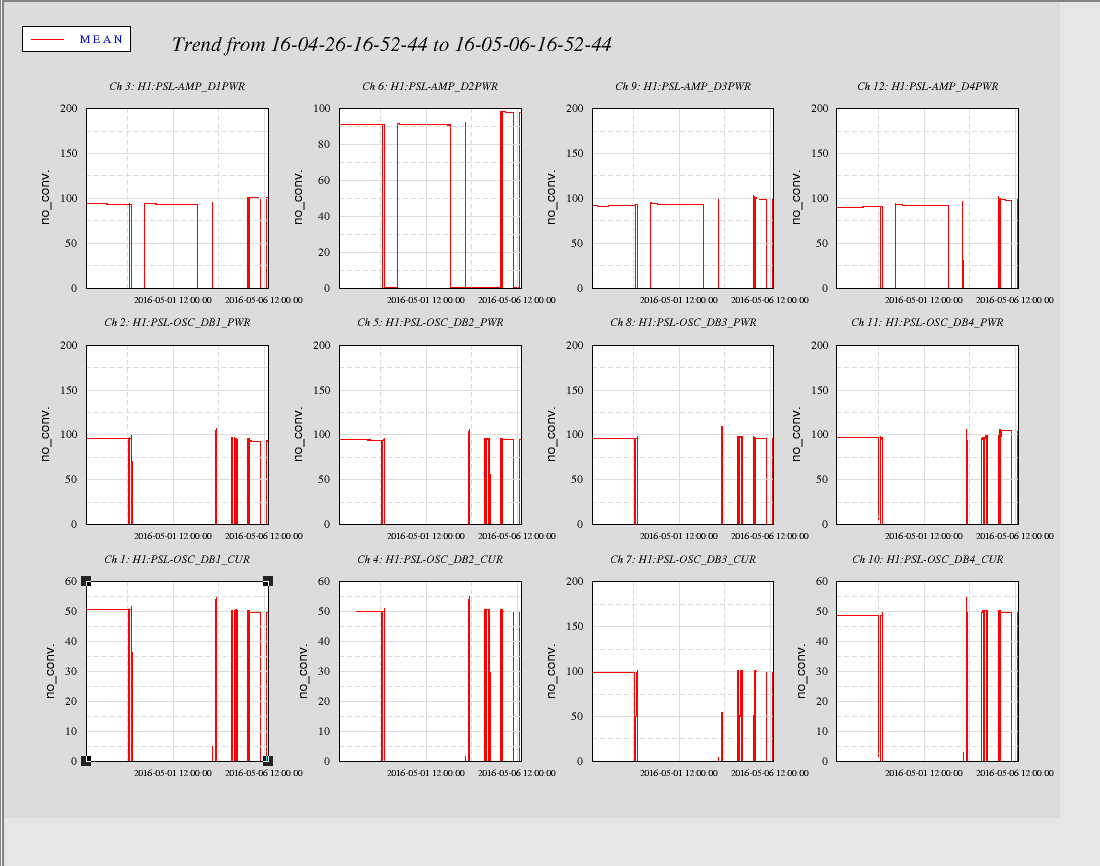
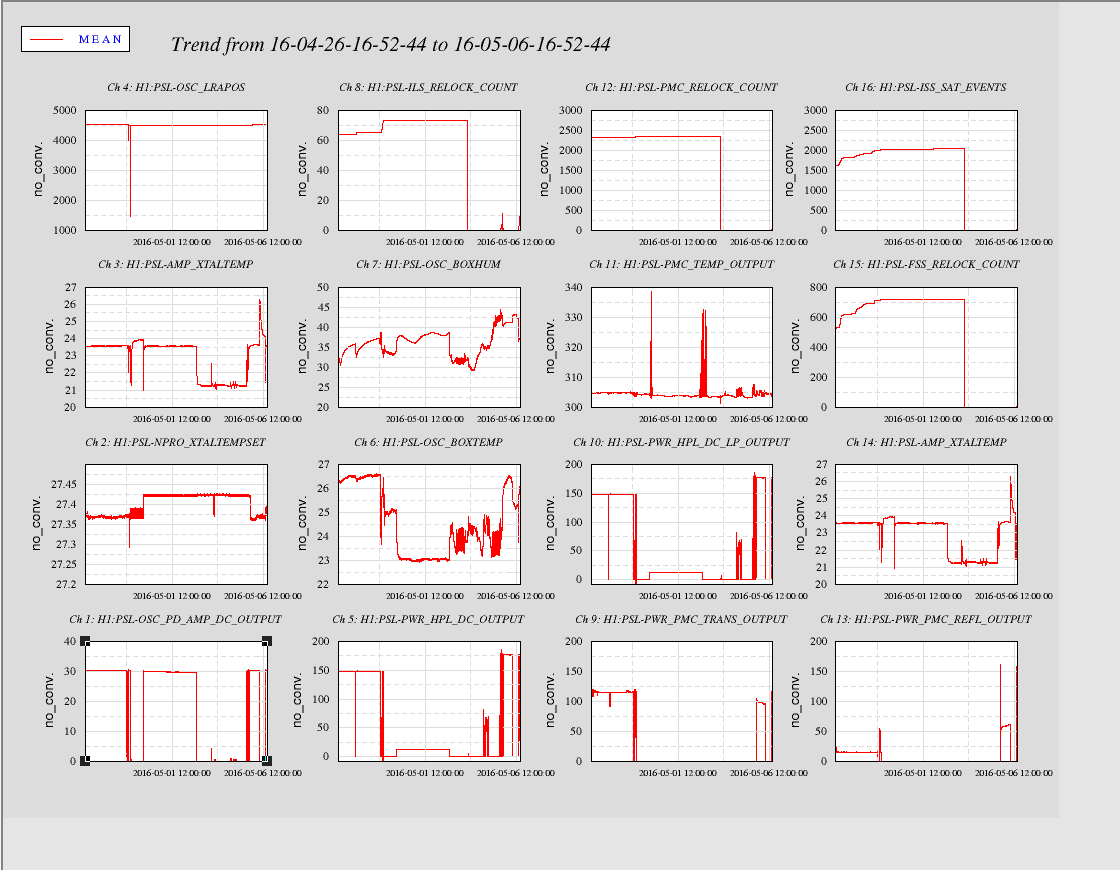
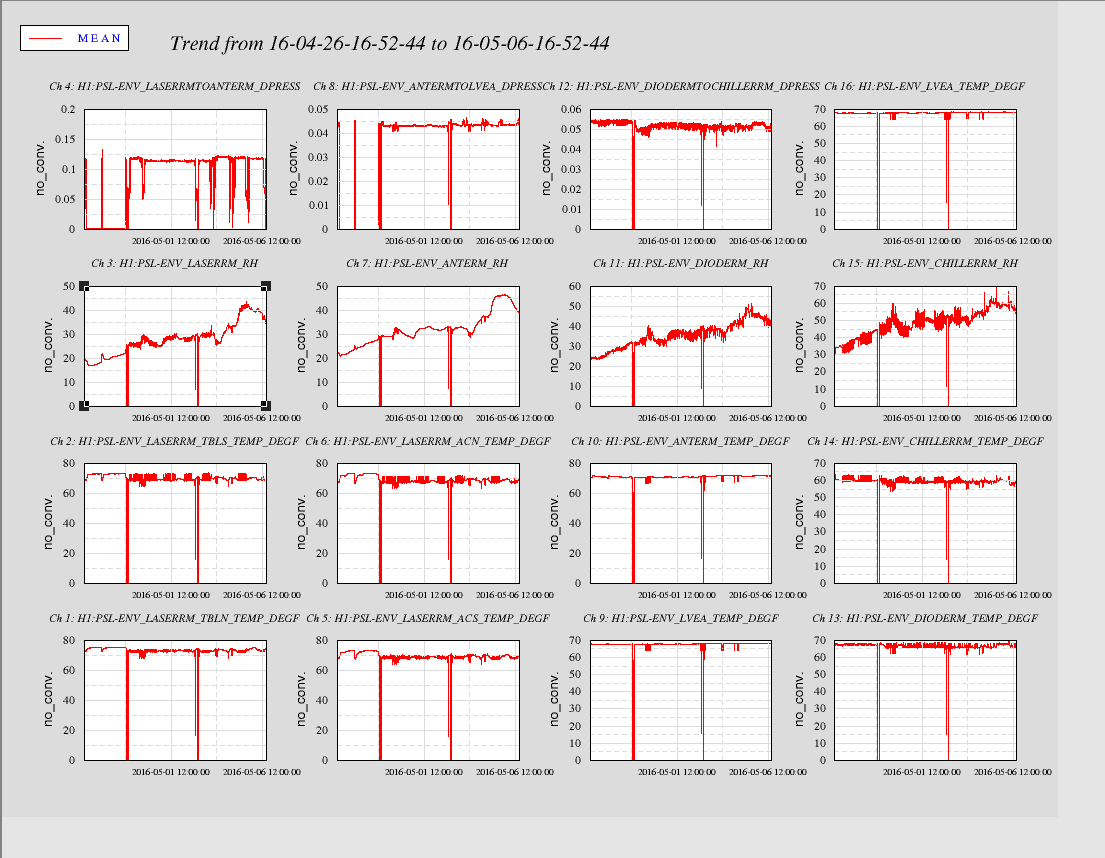
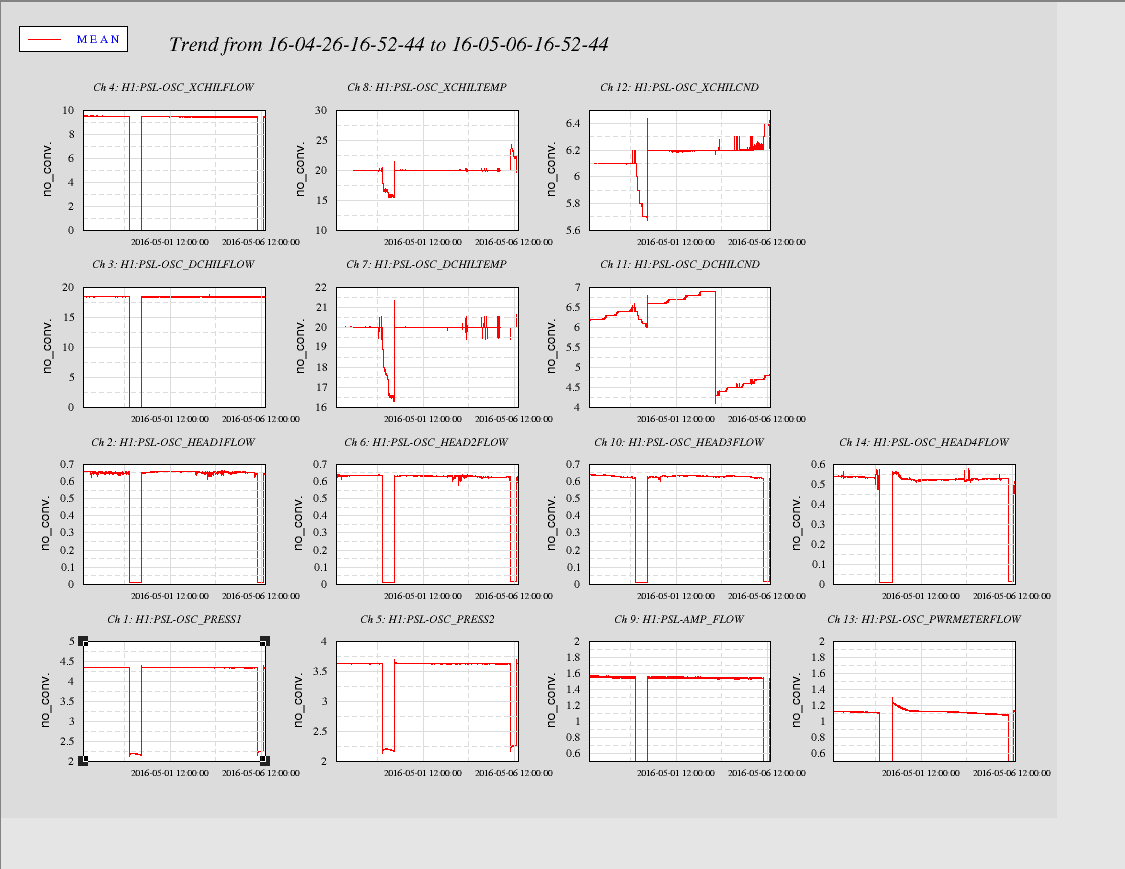
Reboot all non-Dolphin FECs (SUSAUX, PSL, PEM-MIDS)
-
Put Guardian/IFO into safe state
-
Stop all Dolphin FEC models, reboot each computers. h1psl0 and h1seiex lost comms with their IOChassis and needed a power cycle.
During the make installWorld h1fs0 developed a major NFS problem and stopped serving /opt/rtcds file system. We reboot h1fs0, but the NFS service did not start correctly and clients could not umount nor mount the file sytem. We restart kernel-nfs-server daemon and the NFS clients remounted correctly.
I need to change the SUS ITMY and ETMY now the HWWD part is synced to the hardware regarding signal levels (I removed temporary NOT inverters on binary signals).
16:00 h1iscex developed the connTrack Table Full error, new network connections were not permitted. We have to reboot this computer and disrupt the EX Dolphin fabric, requiring all EX models to be restarted (except susaux).
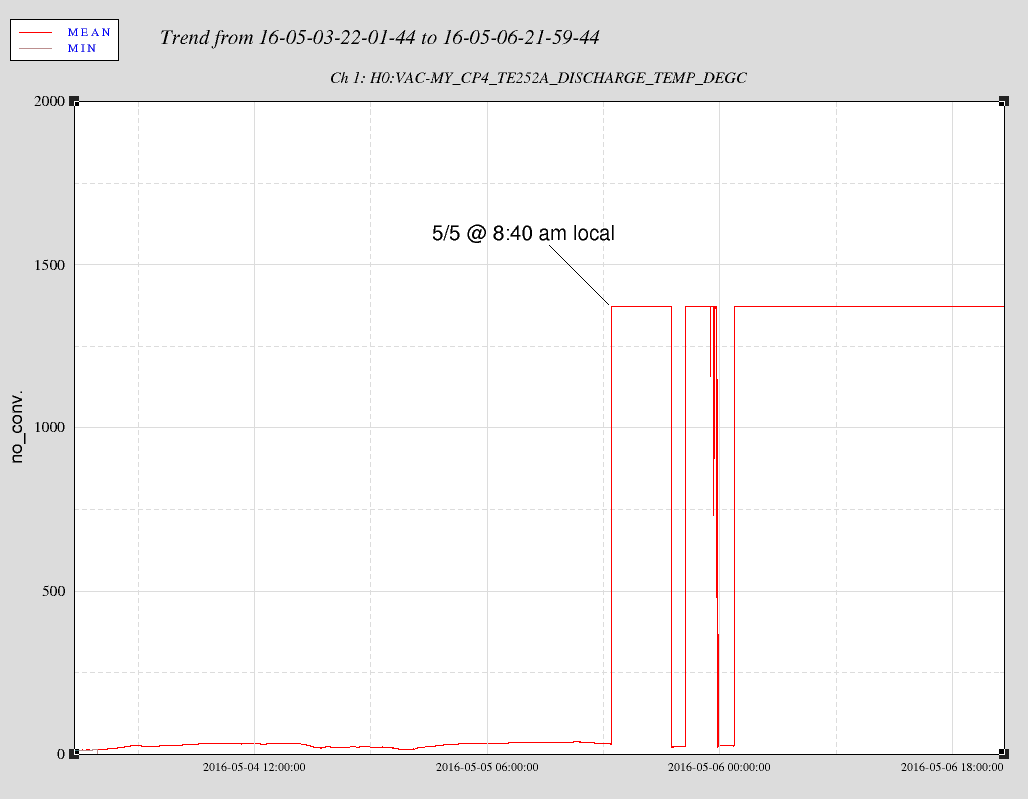
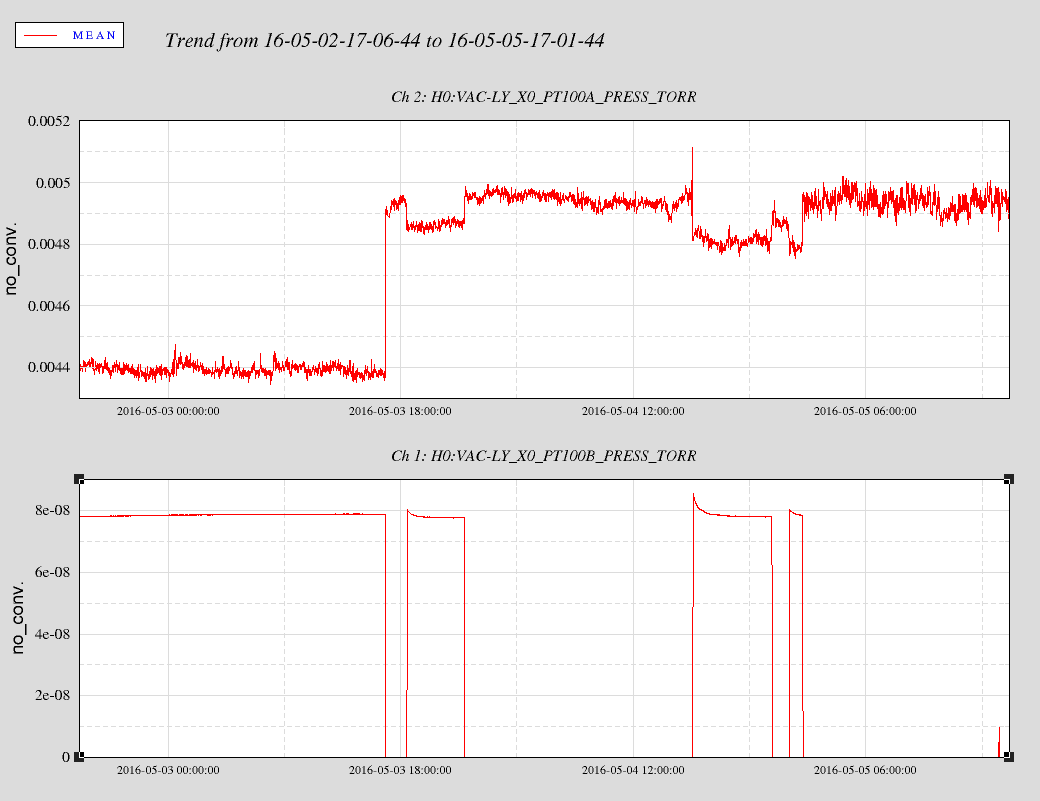
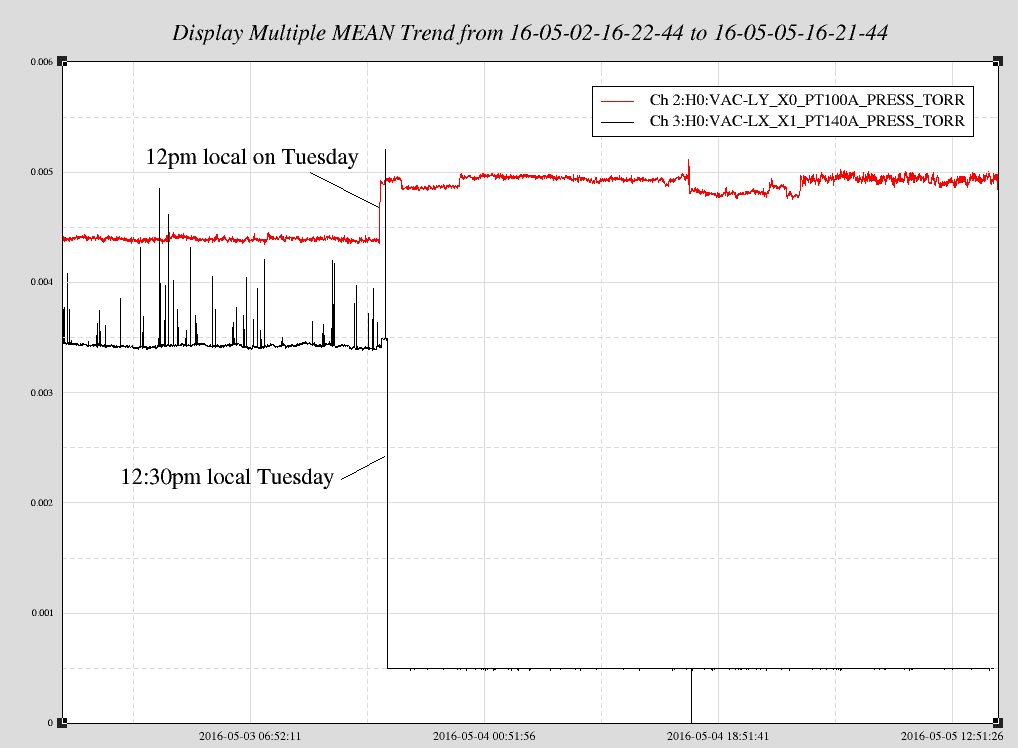
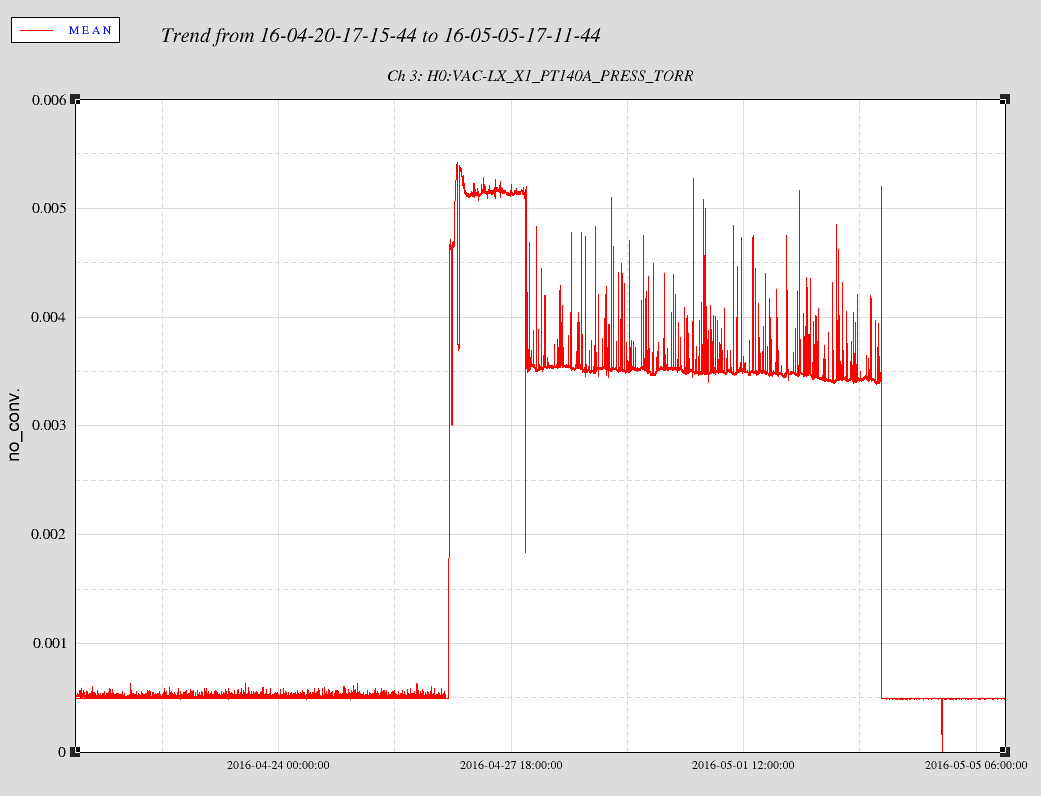
Vacuum controls Beckhoff gauges on BSC7,8 were moved from their temporary slow controls Beckhoff connect to the LX vacuum controls system. This required a name change (H1->H0), minute trends were changed on DAQ.
Upgrade built ISI-HAMS with latest isihammaster.mdl file, but team SEI needed to back out this latest change, so common file was reverse-merged to previous version and all isi-ham rebuilt and restarted.
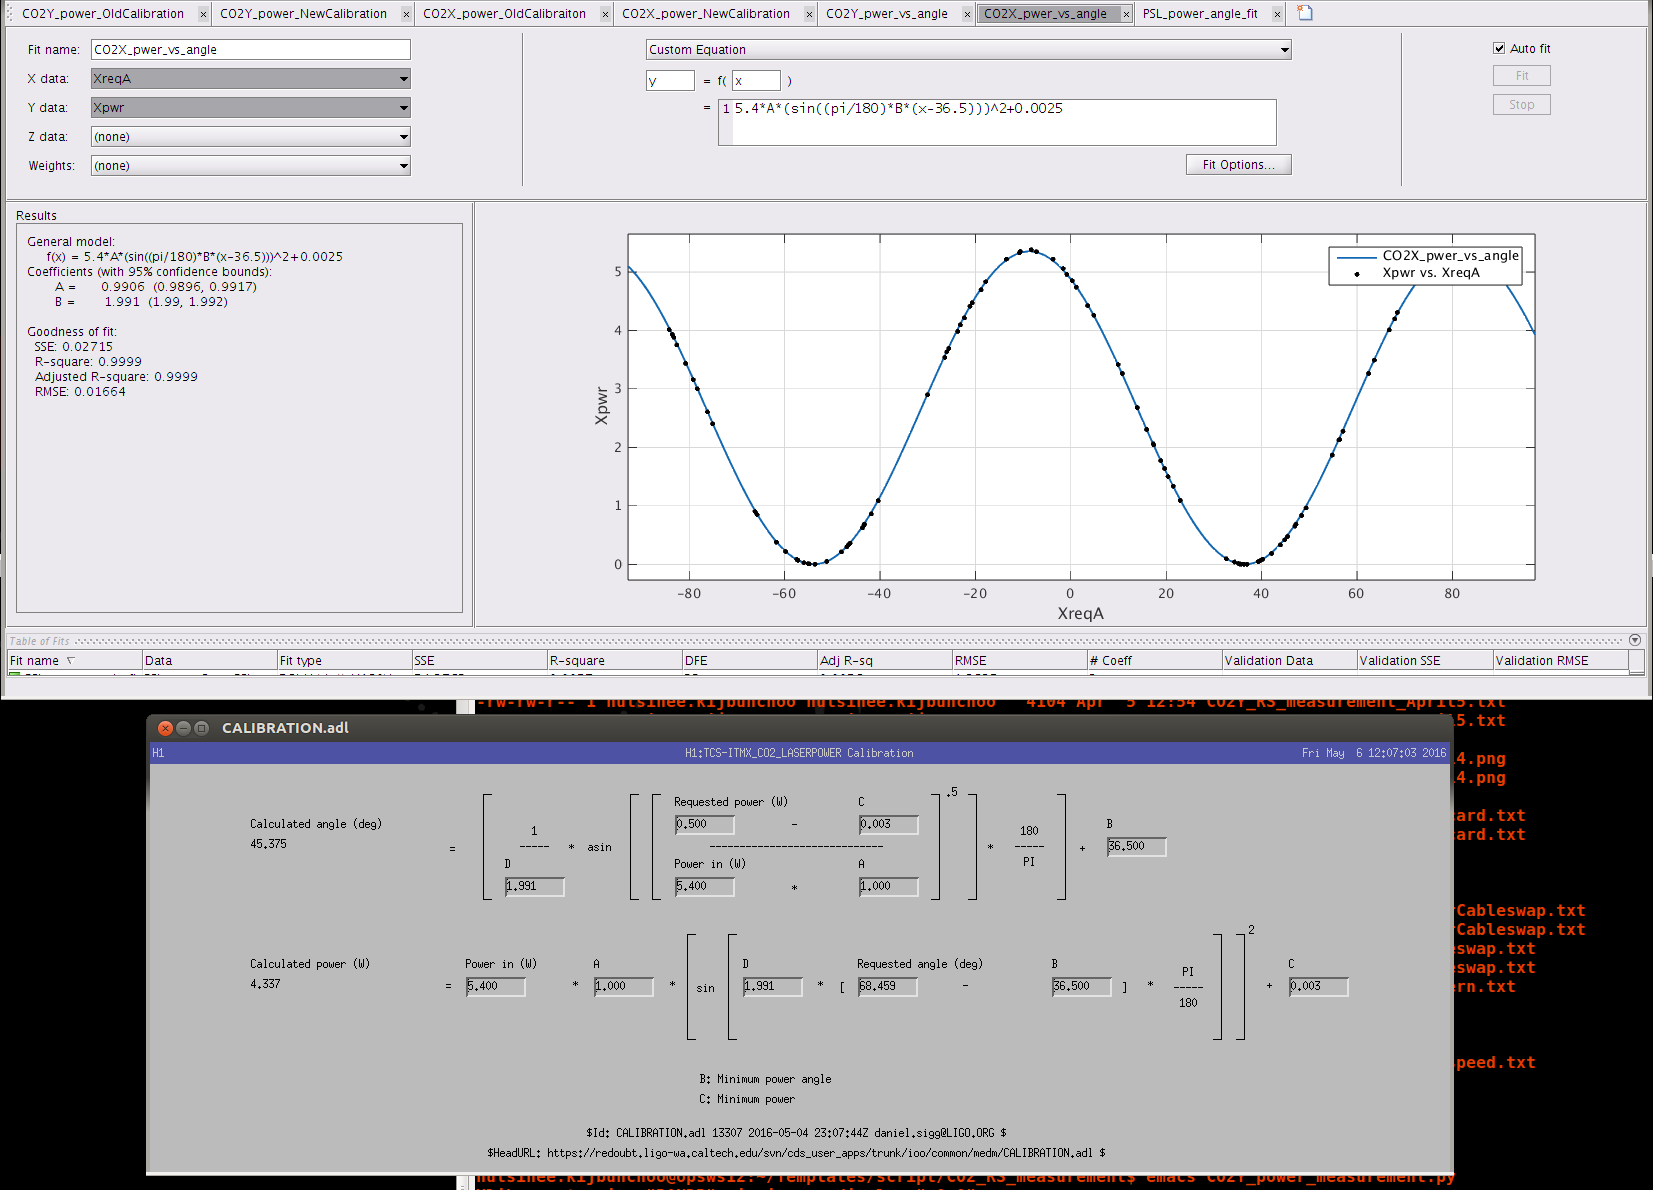
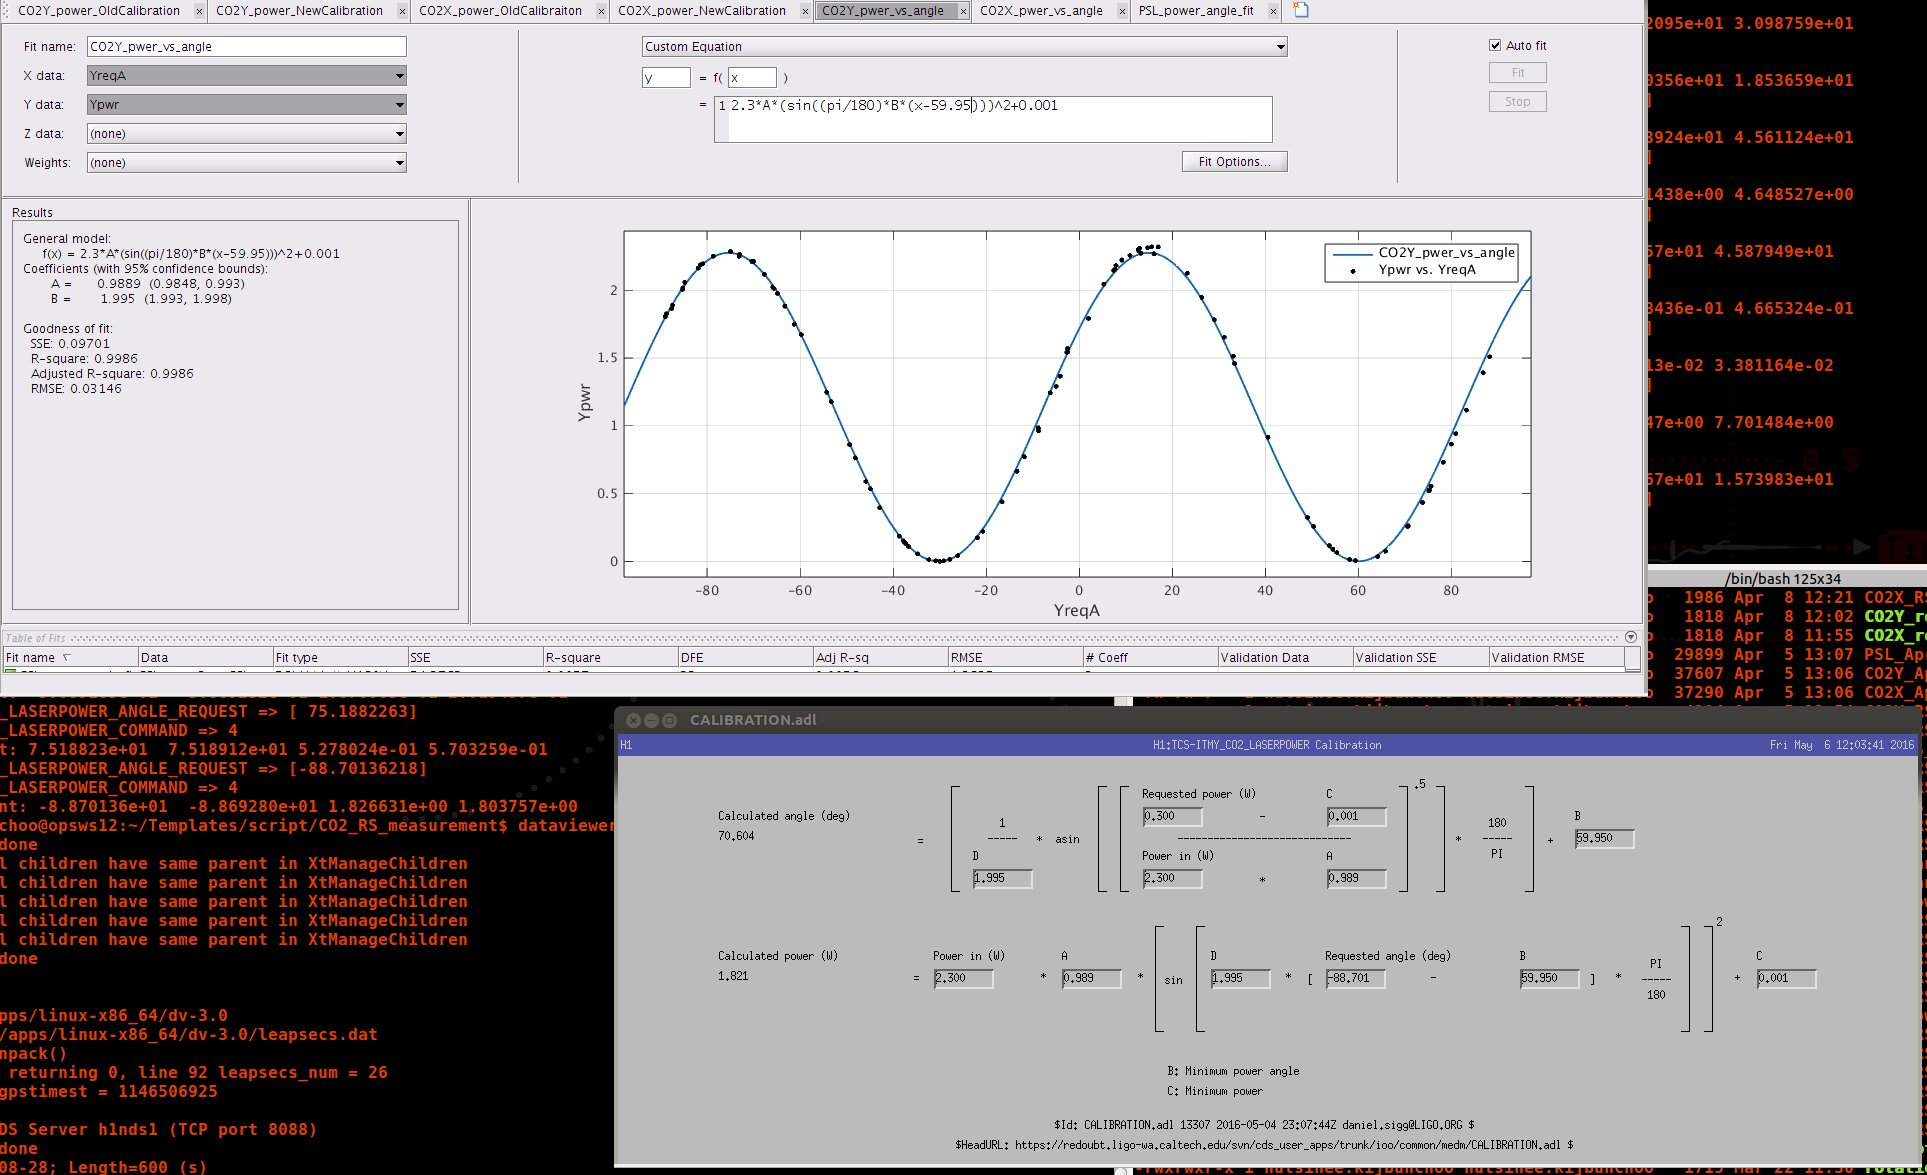
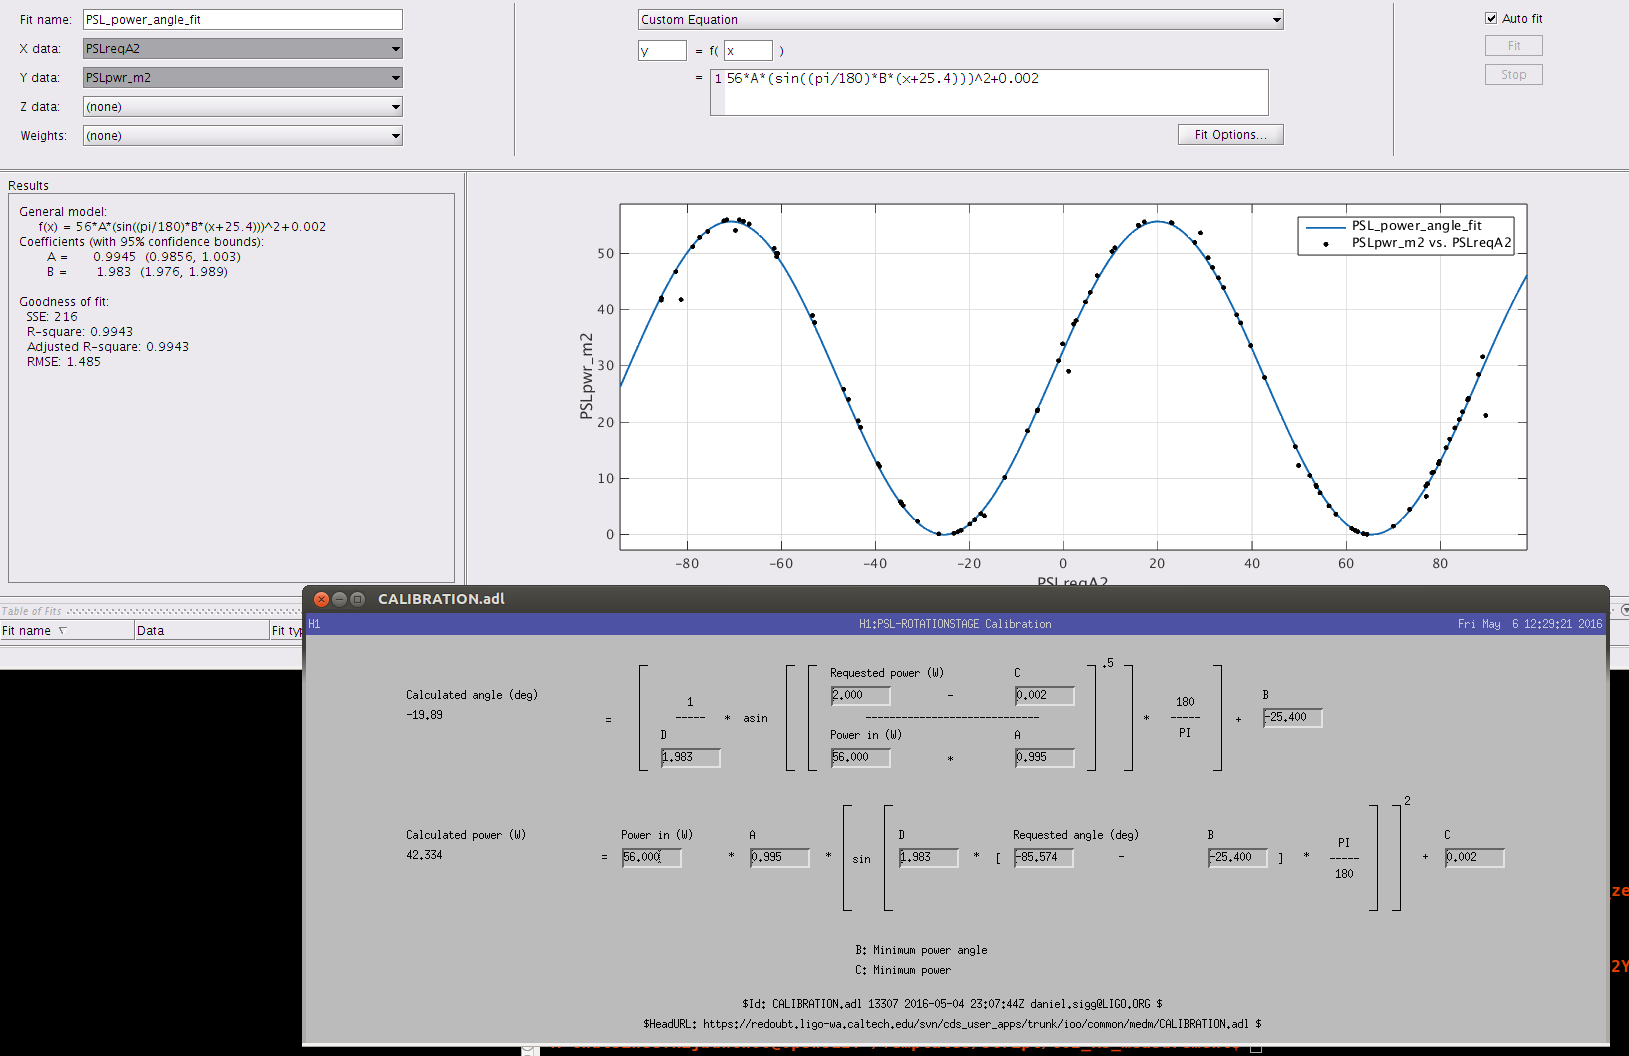
CAL system was modified to remove the Blind Injection data path (h1calcs and h1calex).
Big DAQ restart at end of afternoon: new VE EDCU list, new Slow Controls EDCU LIST, new Dust monitor EDCU list, new susitmy/etmy hwwd code, new isi-ham models, new cal models