thomas.shaffer@LIGO.ORG - posted 23:16, Thursday 28 April 2016 (26829)
Ops Eve Shift Summary
TITLE: 04/29 Eve Shift: 23:00-07:00 UTC (16:00-00:00 PST), all times posted in UTC
STATE of H1: Planned Engineering
INCOMING OPERATOR: None
SHIFT SUMMARY: Plagued by earthquakes, a bit of wind, and then laser trouble. Wasn't a great night tonight.
SEI note: I struggled to get ISI ITMX to stay in fully_isolated, even after the 0.03-0.1Hz seemed to be back to normal. I'm leaving it fully_isolated with the T240s in Low gain now, but it has fooled me before. Also is there a way for us to tell if one of the sensors is already in low gain? Should it be added to the DIAG to make sure all are in high gain?
LOG:
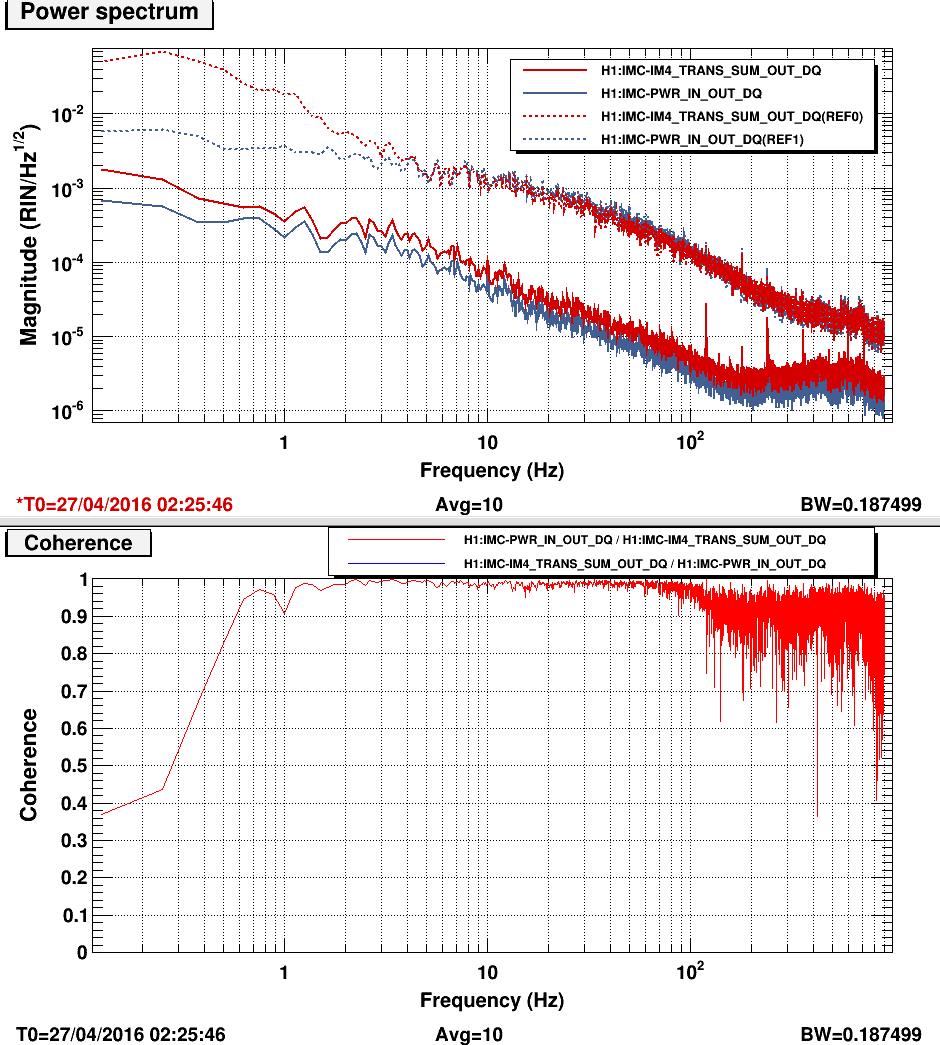
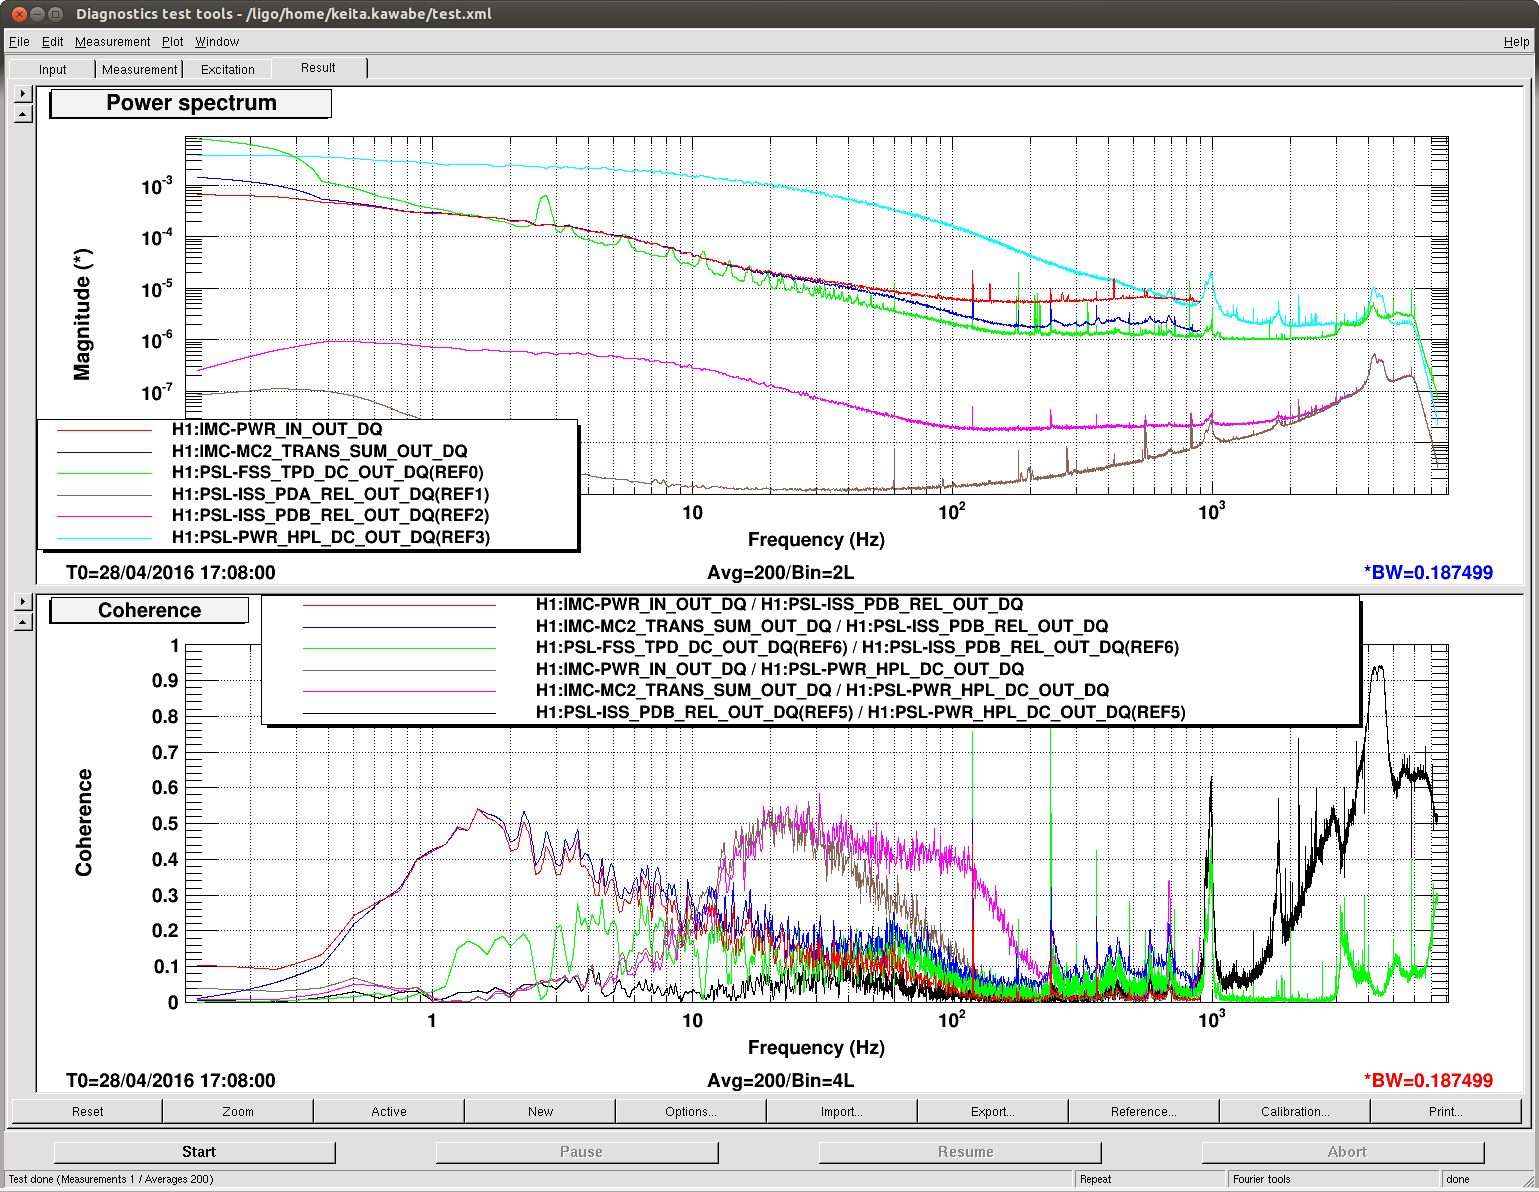
- 23:23 - Rick, Keita to PSL enclosure to make ISS measurement.
- 23:26 - Dale, guest into LVEA for a quick tour.
- 23:47 - Dale, Guest out.
- 00:10 - Evan H to LVEA to PSL rack.
- 00:14 - Evan out.
- 01:52 - Hit with a large earquake (6.9) off the coast of southern Mexico.
- 05:52 - Rick, Keita out for the night.