J. Kissel, S. Dwyer
As identified yesterday (LHO aLOG 26793), we've needed to *re*flip the ESD bias sign in order to resume bringing the accumulated charge on the test masses back down to zero. As such, we have reverted the requested bias voltage to what had been done in February (see LHO aLOG 25575) and performed all of the necessary changes in settings that are ancillary to the change.
Note, there are a few changes / additions in what needs changing from Kiwamu's February flip, so I'll re-list everything here:
[Bias Flip on ETMX]
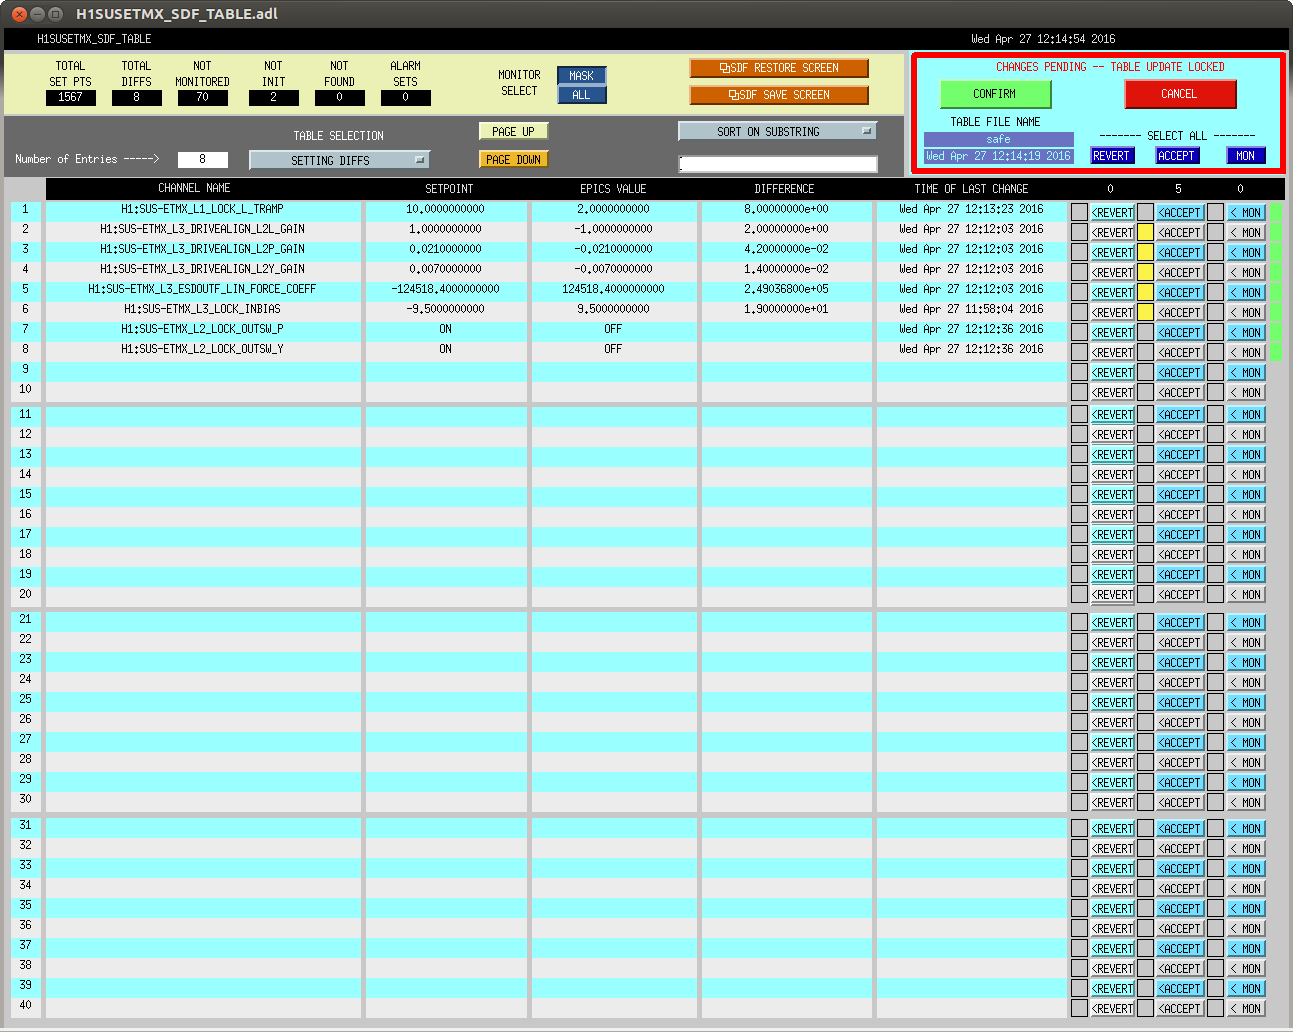
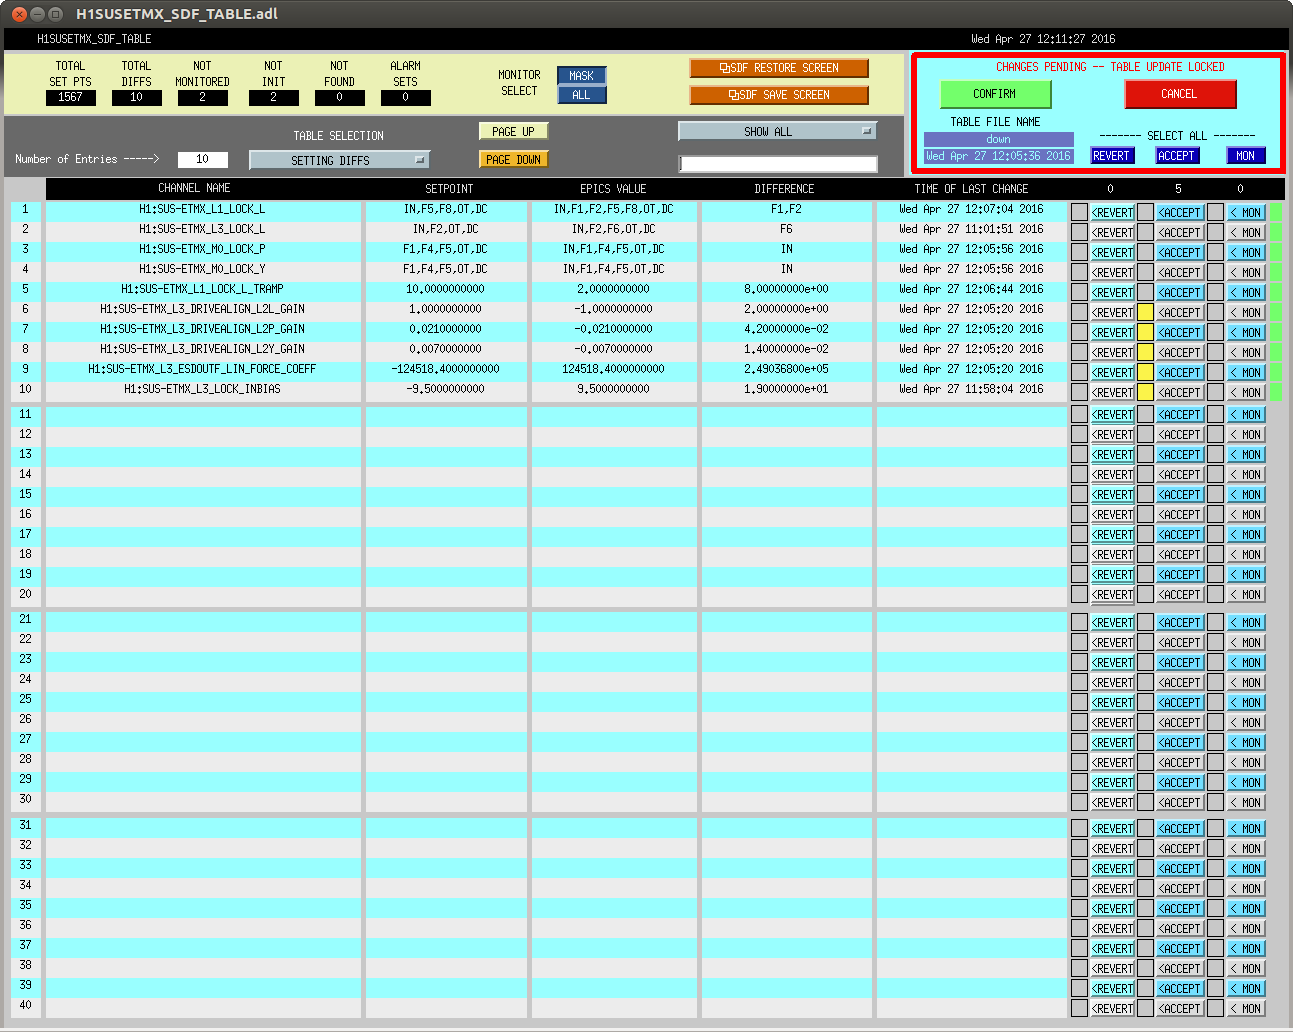
- Changed H1:SUS-ETMX_L3_LOCK_INBIAS from -9.5 to +9.5 [V_DAC]
- (unlike before) The ISC_LOCK guardian (now) takes care of checking the sign of H1:SUS-ETMX_L3_LOCK_INBIAS, and adjusting the sign of
- H1:SUS-ETMX_L3_DRIVEALIGN_L2L_GAIN from +1.000 to -1.000 (fixes the ESD stage longitudinal loop gain to match the bias sign change)
- H1:SUS-ETMX_L3_DRIVEALIGN_L2P_GAIN from +0.021 to -0.021 (fixes the F2P sign)
- H1:SUS-ETMX_L3_DRIVEALIGN_L2Y_GAIN from +0.007 to -0.007(fixes the F2P sign)
- H1:SUS-ETMX_L3_ESDOUTF_LIN_FORCE_COEFF from -124518.4 to +124518.4 (fixes the linearization force coefficient to match the new bias sign)
accordingly. (Note that it's marked as a #FIXME, but these values are hard-coded into the guardian)
- (unlike before) Accepted the new values in *all* SDF snap files,
/opt/rtcds/userapps/release/sus/h1/burtfiles/
- h1susetmx_down.snap
- h1susetmx_safe.snap
by loading in each table and accepting the values I've changed, followed by a commit to the userapps repo.
- This also involved *creating* a copy of the down.snap in the userapps repo, and changing the file in the
target/h1susetmx/h1susetmxepics/burt/ directory to a soft link, as was already the case for the OBSERVE.snap and safe.snap)
- All the changes in settings had been accepted on the OBSERVE snap on the Feb flip, so I didn't need to accept any new values)
- (like before) There's no need to make any further changes in the CAL-CS epics settings, because ETMX is not used in any capacity for calibration.
[Bias Flip on ETMY]
- Changed H1:SUS-ETMY_L3_LOCK_INBIAS from +5.0 to -9.5 [V_DAC]
- (like before) The ISC_LOCK guardian takes care of checking the sign of H1:SUS-ETMY_L3_LOCK_INBIAS, and adjusting the sign of
- H1:SUS-ETMY_L3_DRIVEALIGN_L2L_GAIN from +30.0 to -30.0
- Note that previously, this check had been in the ISC_LOCK state of just before "NOMINAL LOW NOISE" which seemed too late, so we moved this check into the DOWN state just under where it's checked for ETMX.
- (like before) there are no off-diagonal L3 DRIVEALIGN coefficients in use (and L2P / L2Y or P2L / Y2L), but if they were, we would have needed to flip those signs too.
- (unlike before), I've by-hand changed the linearization force coefficient sign,
- H1:SUS-ETMX_L3_ESDOUTF_LIN_FORCE_COEFF from +124518.4 to -124518.4
Even though linearization is not used in nominal low-noise (not even during charging measurements), I think it's important to be consistent during these flips lest it bite us later if someone wishes to turn on the linearization.
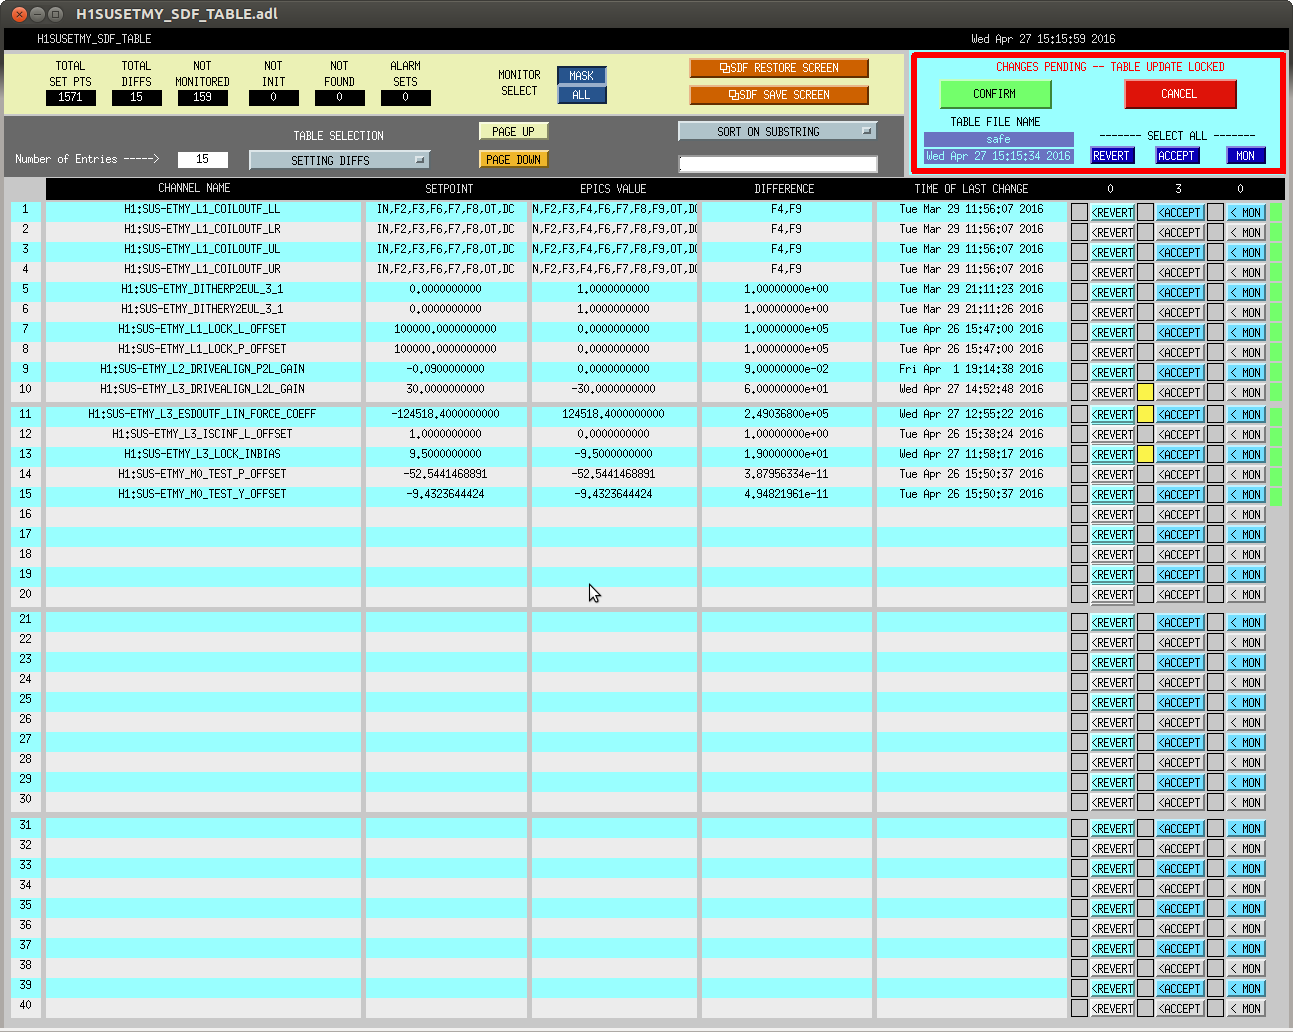
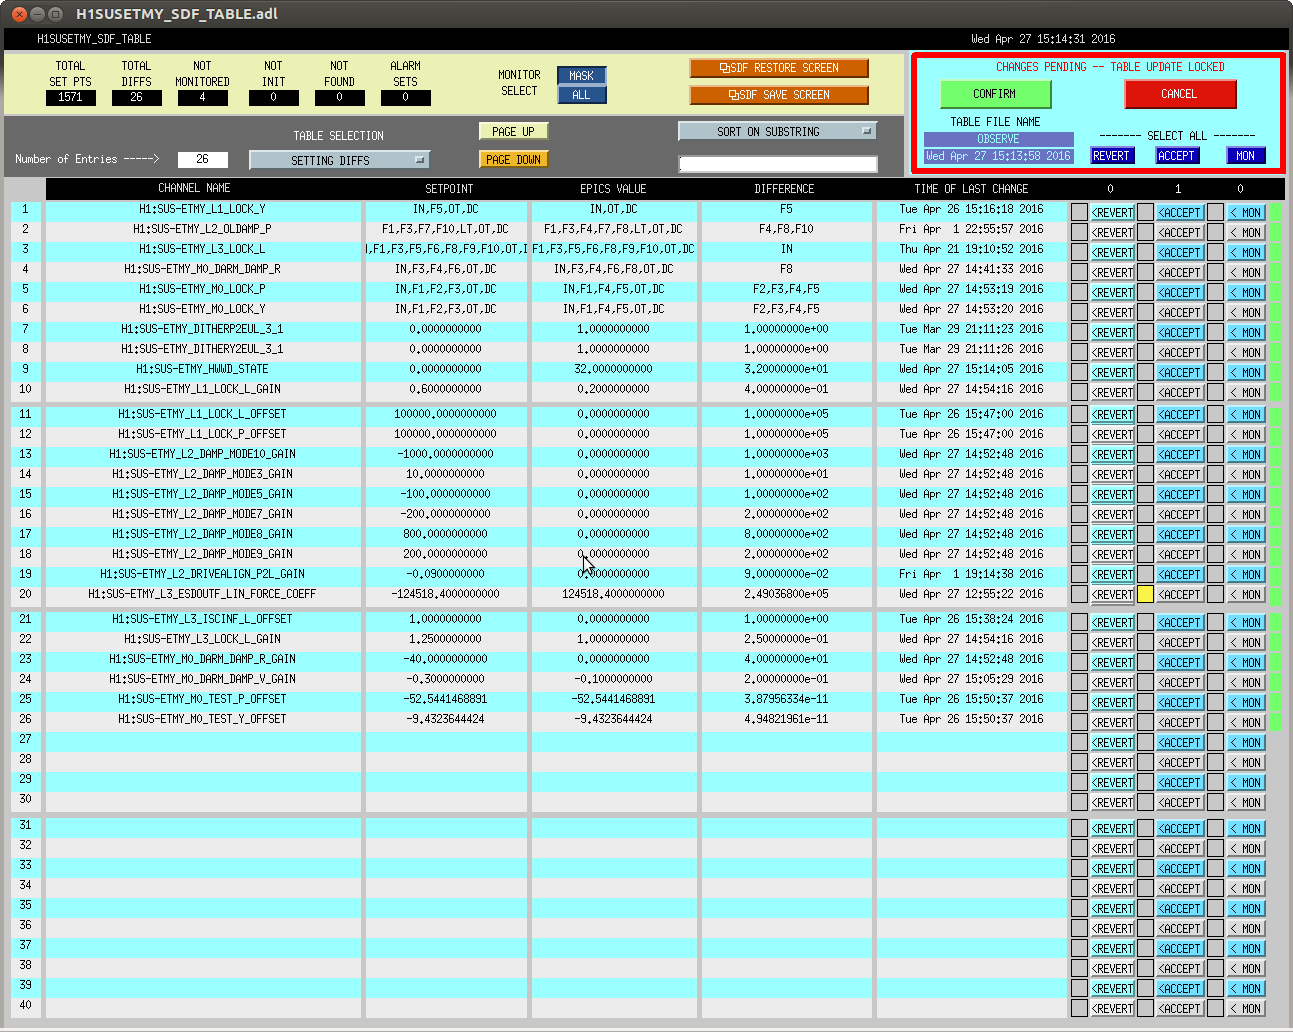
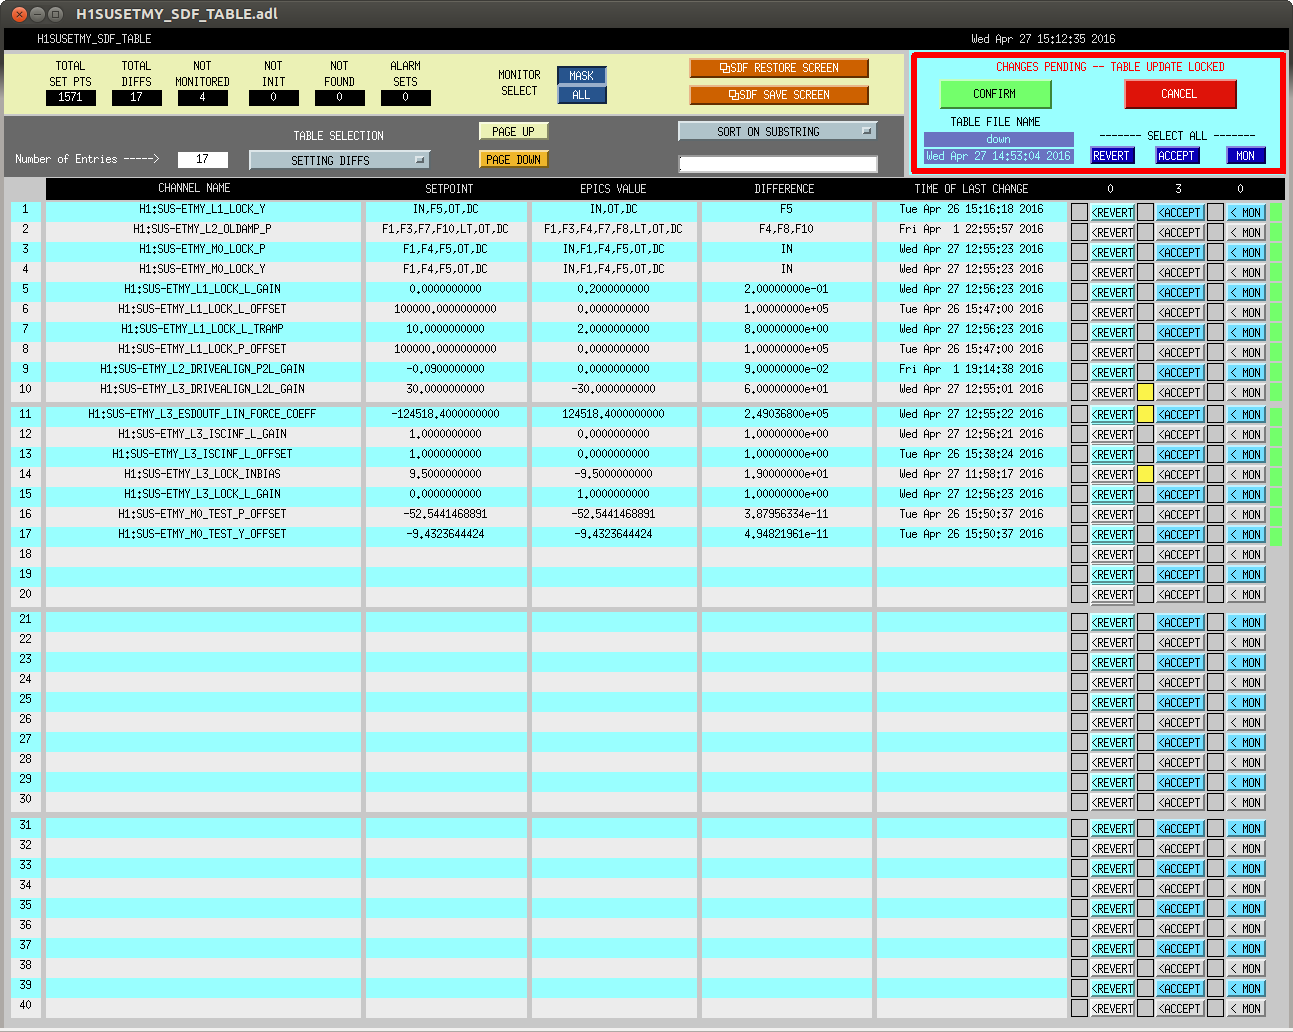
- (unlike before) Accepted the new values in *all* SDF snap files,
/opt/rtcds/userapps/release/sus/h1/burtfiles/
- h1susetmy_down.snap
- h1susetmy_observe.snap
- h1susetmy_safe.snap
by loading in each table and accepting the values I've changed, followed by a commit to the userapps repo.
(This also involved *creating* a copy of the down.snap in the userapps repo, and changing the file in the
target/h1susetmy/h1susetmyepics/burt/ directory to a soft link, as was already the case for the OBSERVE.snap and safe.snap)
[Making sure Calibration is unaffected]
- (like before) We must make sure that the CAL-CS replica of the ETMY actuation matches the SUS ETMY digital signal chain. However, because the CAL-CS model had not been restarted, and its SDF system had been kept up-to-date it did not lose the appropriate settings, so the settings for
- H1:CAL-CS_DARM_FE_ETMY_L3_DRIVEALIGN_L2L_GAIN remained -30.0
- H1:CAL-CS_DARM_ANALOG_ETMY_L3_GAIN remained +1.0
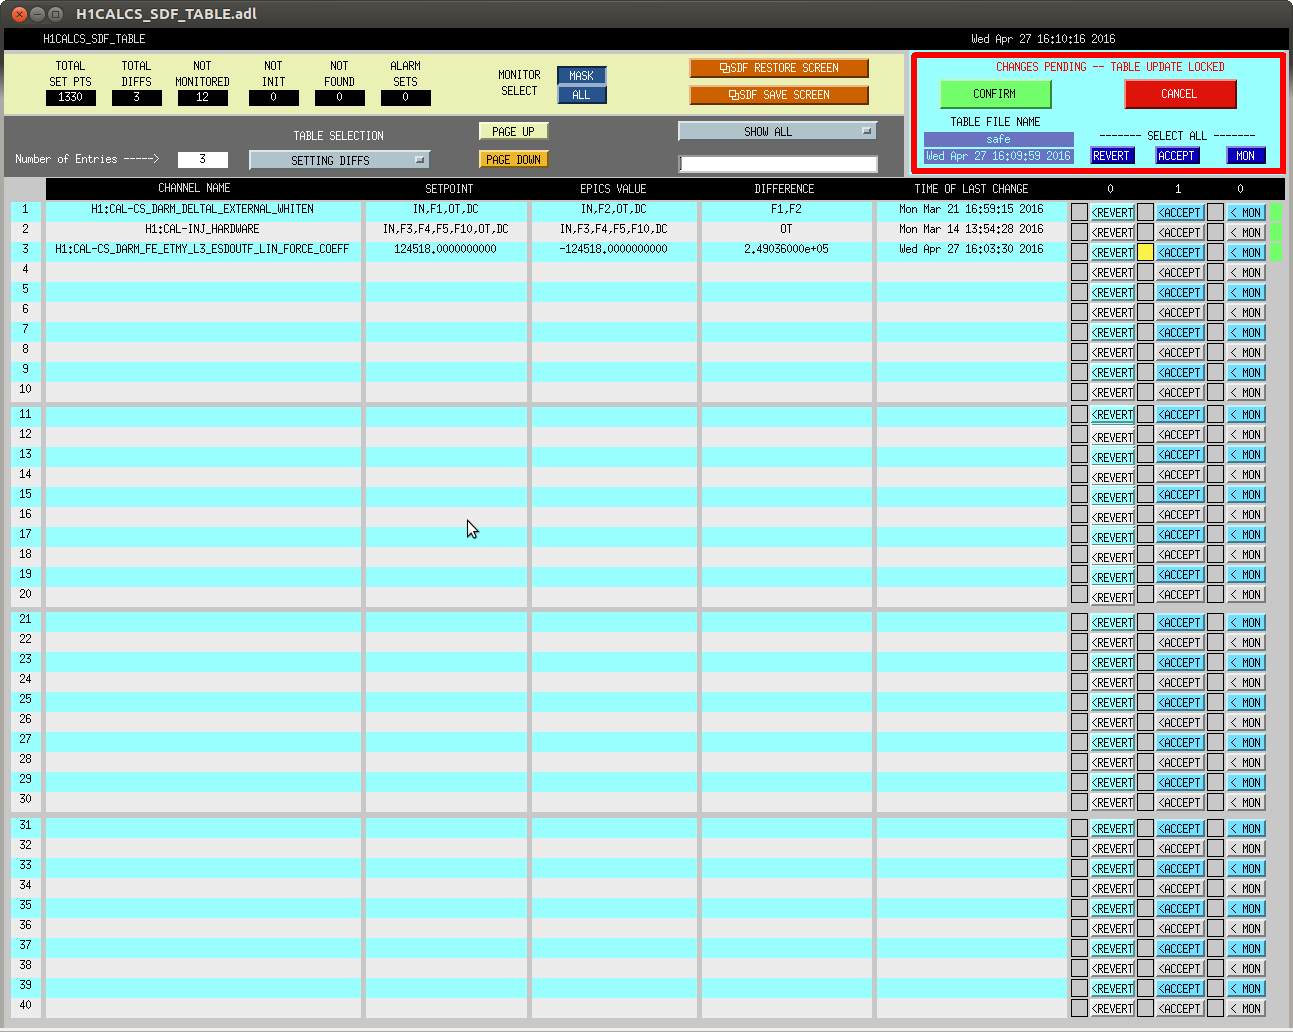
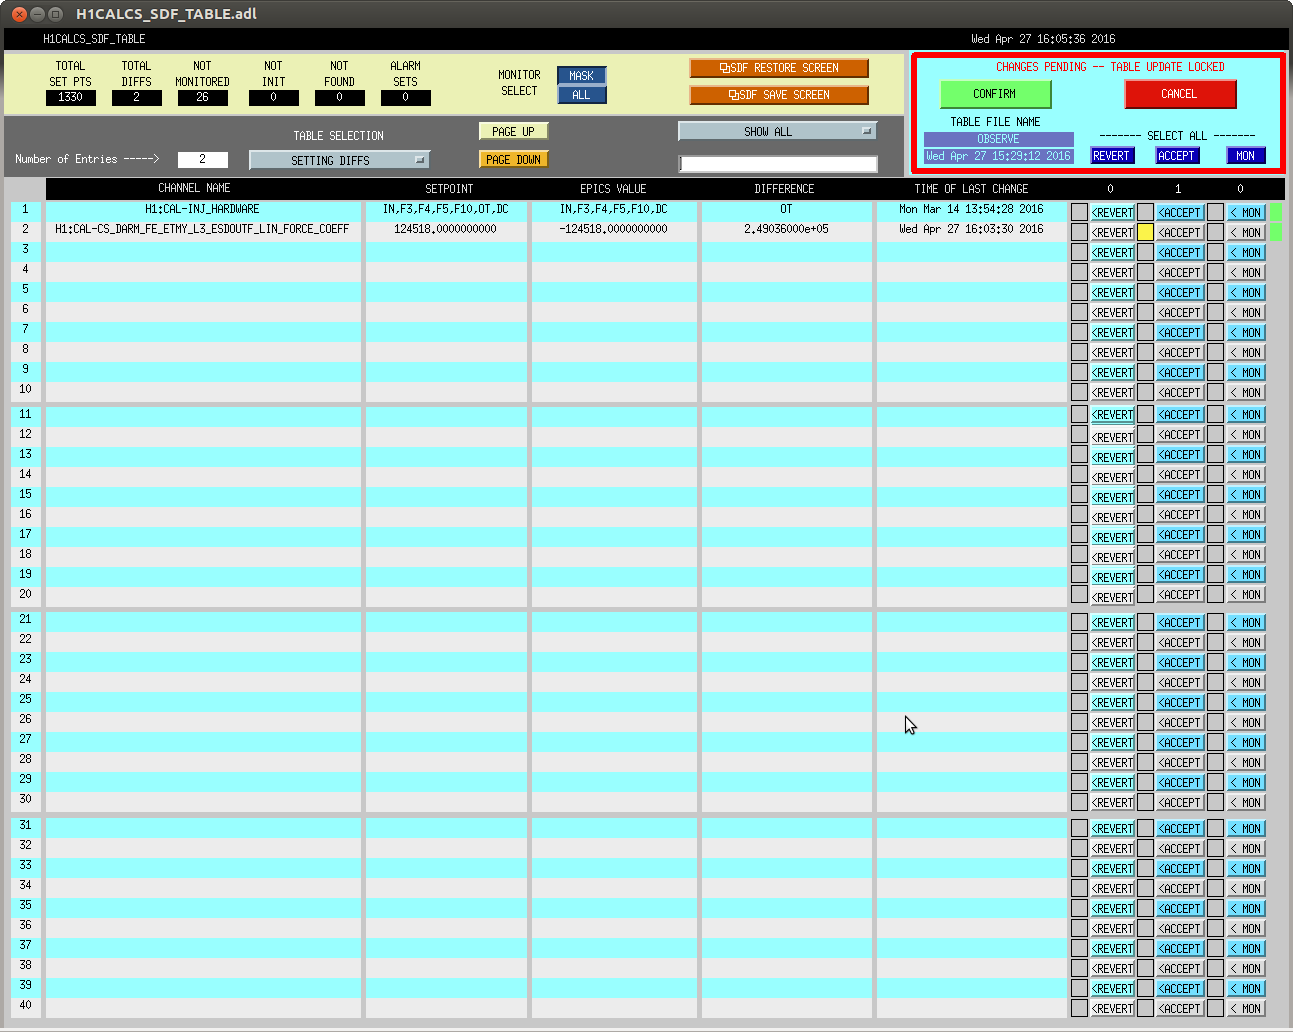
- (unlike before) Again, to be consistent, I've changed the sign of the linearization force coefficient,
- H1:CAL-CS_DARM_FE_ETMY_L3_ESDOUTF_LIN_FORCE_COEFF from +124518.4 to -124518.4
- (unlike before) Accepted the new values in *all* SDF snap files,
/opt/rtcds/userapps/release/sus/h1/burtfiles/
- h1susetmx_observe.snap
- h1susetmx_safe.snap
by loading in each table and accepting the values I've changed, followed by a commit to the userapps repo.
(Since there is no change between the "down" and "observation" state, a "down" .snap doesn't and need not exist.)
Back in the day, Joe Betz had the idea of writing some guardian code that would keep the CAL-CS model up-to-date with the SUS model's digital settings. That would make this last step unnecessary. I'll ask what the status is on that. It still good to check all of these things anyways, though.
I attach a bunch of screenshots which should what I've accepted in each SDF file for future reference.
Sadly, because we've not locked the IFO on ETMY for quite some time, we cannot check the DARM open loop gain to confirm that all is well with the calibration. Further, the actuation strength will have likely changed and we're going to remeasure it anyways prior to ER9, so there's little point in double checking the actuation strength. So there's no further things to do this time around. However, if and when we do have a viable calibration, I'll remind you of the steps, which are at the bottom of LHO aLOG 22135.