patrick.thomas@LIGO.ORG - posted 16:23, Monday 25 April 2016 - last comment - 16:44, Monday 25 April 2016(26776)
PSL Weekly Report
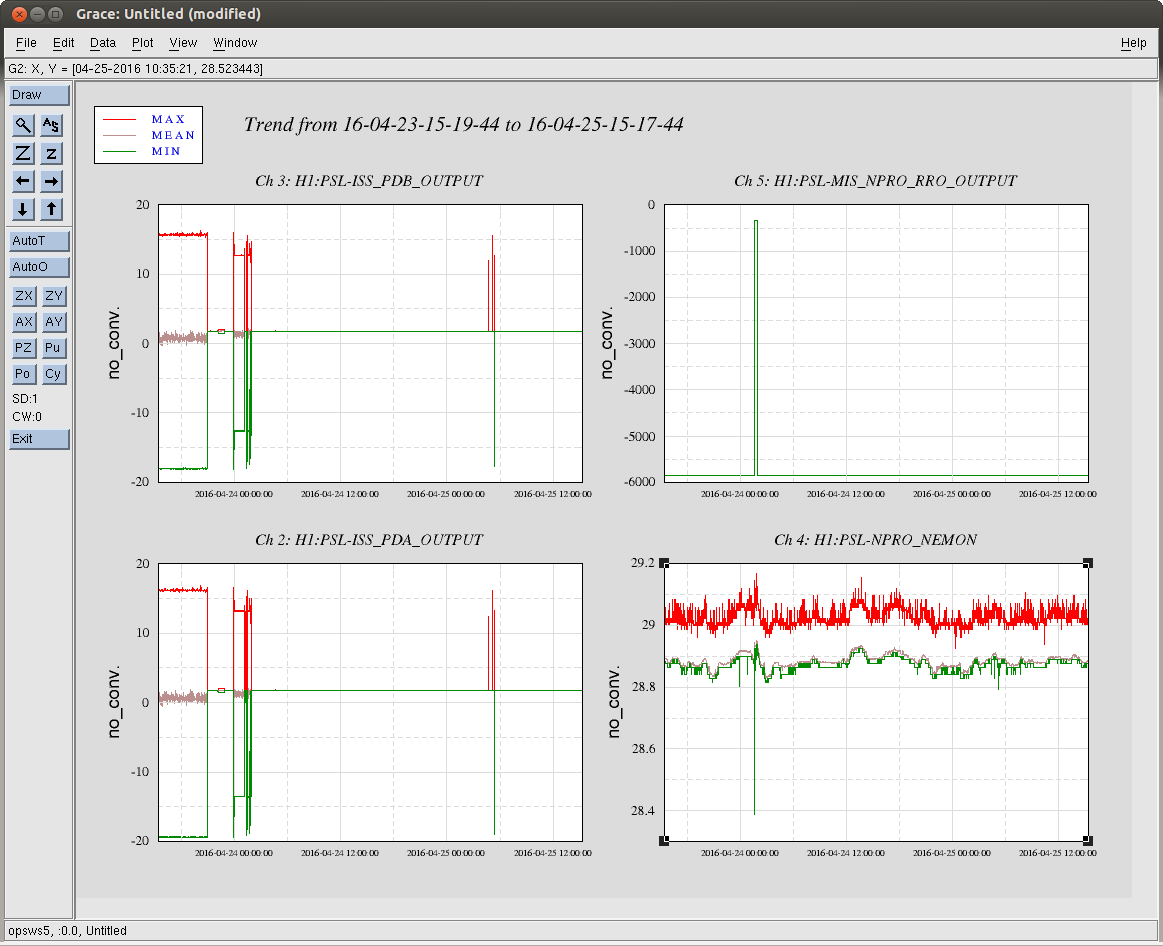
Laser Status:
SysStat is good
Front End power is 30.32 W (should be around 30 W)
Frontend Watch is GREEN
HPO Watch is GREEN

PMC:
It has been locked 1.0 day(s) 21.0 hour(s) and 31.0 minute(s) (should be days/weeks)
Reflected power is 15.98 W and PowerSum is 120.3 W

FSS:
It has been locked 0.0 day(s) 2.0 hour(s) and 13.0 minute(s) (should be days/weeks)
TPD[V] = 3.935 V (minimum 0.9 V)

ISS:
The diffracted power is around 29.4% (should be 5-9%)
Last saturation event was 0.0 day(s) 2.0 hour(s) and 14.0 minute(s) ago (should be days/weeks)
Comments related to this report