kyle.ryan@LIGO.ORG - posted 17:03, Thursday 10 March 2016 (25995)
Kyle monitoring CP8 level from home tonight
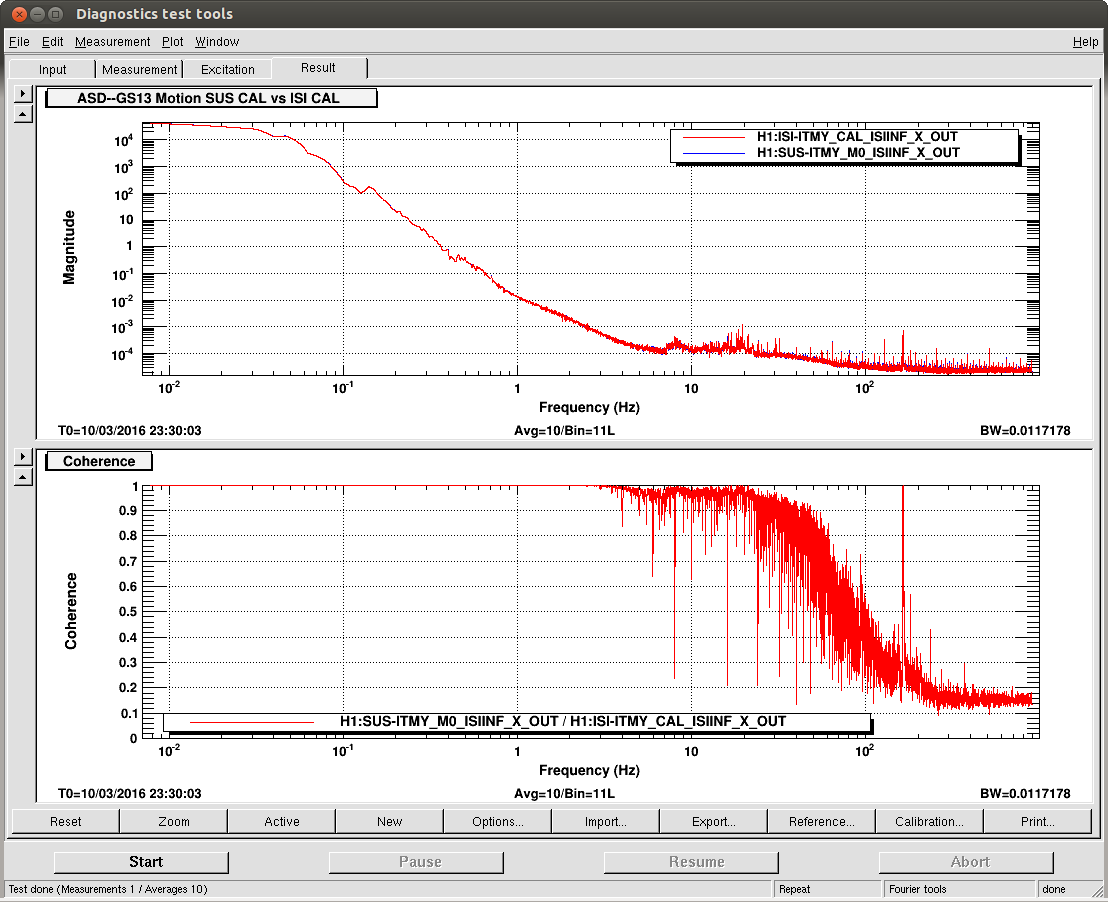
Re ISI offloading SUS ISI M0 motion calibration--Looks like it works just fine
As the SUS model is running at 16khz and the ISI is running at 4khz, thought it best to confirm the calibration filters are easily ported to the other model. The CAL filter running on the ISI (just ITMY for the moment) is just a copy of the SUSpension Cal filter. Gratefully, the SUS filter bank had a 4k to 16khz filter to process the GS13 data coming from the ISI.
Spectra shows the comparision with solid coherence out to 100hz whereafter it falls off by a few 100s of hz. Well that is only true with a 1hz bw. When I do a .01bw spectra, the coherence starts to falter around 4hz. The .01hz spectra is attached.
TITLE: 03/10 day Shift: 16:00-00:00 UTC (08:00-16:00 PST), all times posted in UTC
STATE of H1: Planned Engineering
INCOMING OPERATOR: Nutsinee
SHIFT SUMMARY:'Mainly stayed locked on DRMI all day
LOG:
15:58 Jeff B out to LVEA for parts.
16:23 Jeff out o LVEA
16:26 Christina moving pallets around:into highbay and over to warehouse.
16:52 Christina/Karen finished moving pallets
16:58 Kyle out to EX
17:02 Notification: "ISI_RINGUP: ETMY ISI ringing up"
17:30 Jeff out to LVEA to terminate dust monitor plumbing.
17:40 PEM ISC Timing slave power supply swap starts -Fil
17:45 Robert out to EY
17:48 Fil out of LVEA; Jim rebooting PEM ISC
18:00 Begin initial alignment. Jim working on stability blends due to increasin winds; Sheila restoring a bad safe.snap inhibiting IMC
18:35 Kyle back from EX
 21:25 Jeff B to End Station Compressor rooms
22:15 Jeff back from Ends
[Cao, Aidan]
We have restarted the code on both HWS. We'd like to having them running continously right now. The ITMY HWS is aligned to the Spot 1 position in alog 25905.
I've set the ITMY magnification to a nominal value of 7.5x, per T1400686
Filiberto, Jim, Brynley, Vinny

We powered down the CS-EBAY LSC IO Chassis, and changed the power supply to the timing card to an alternative 12V power supply. It will be left this way while we check if this reduced the 0.5Hz combs in DARM.
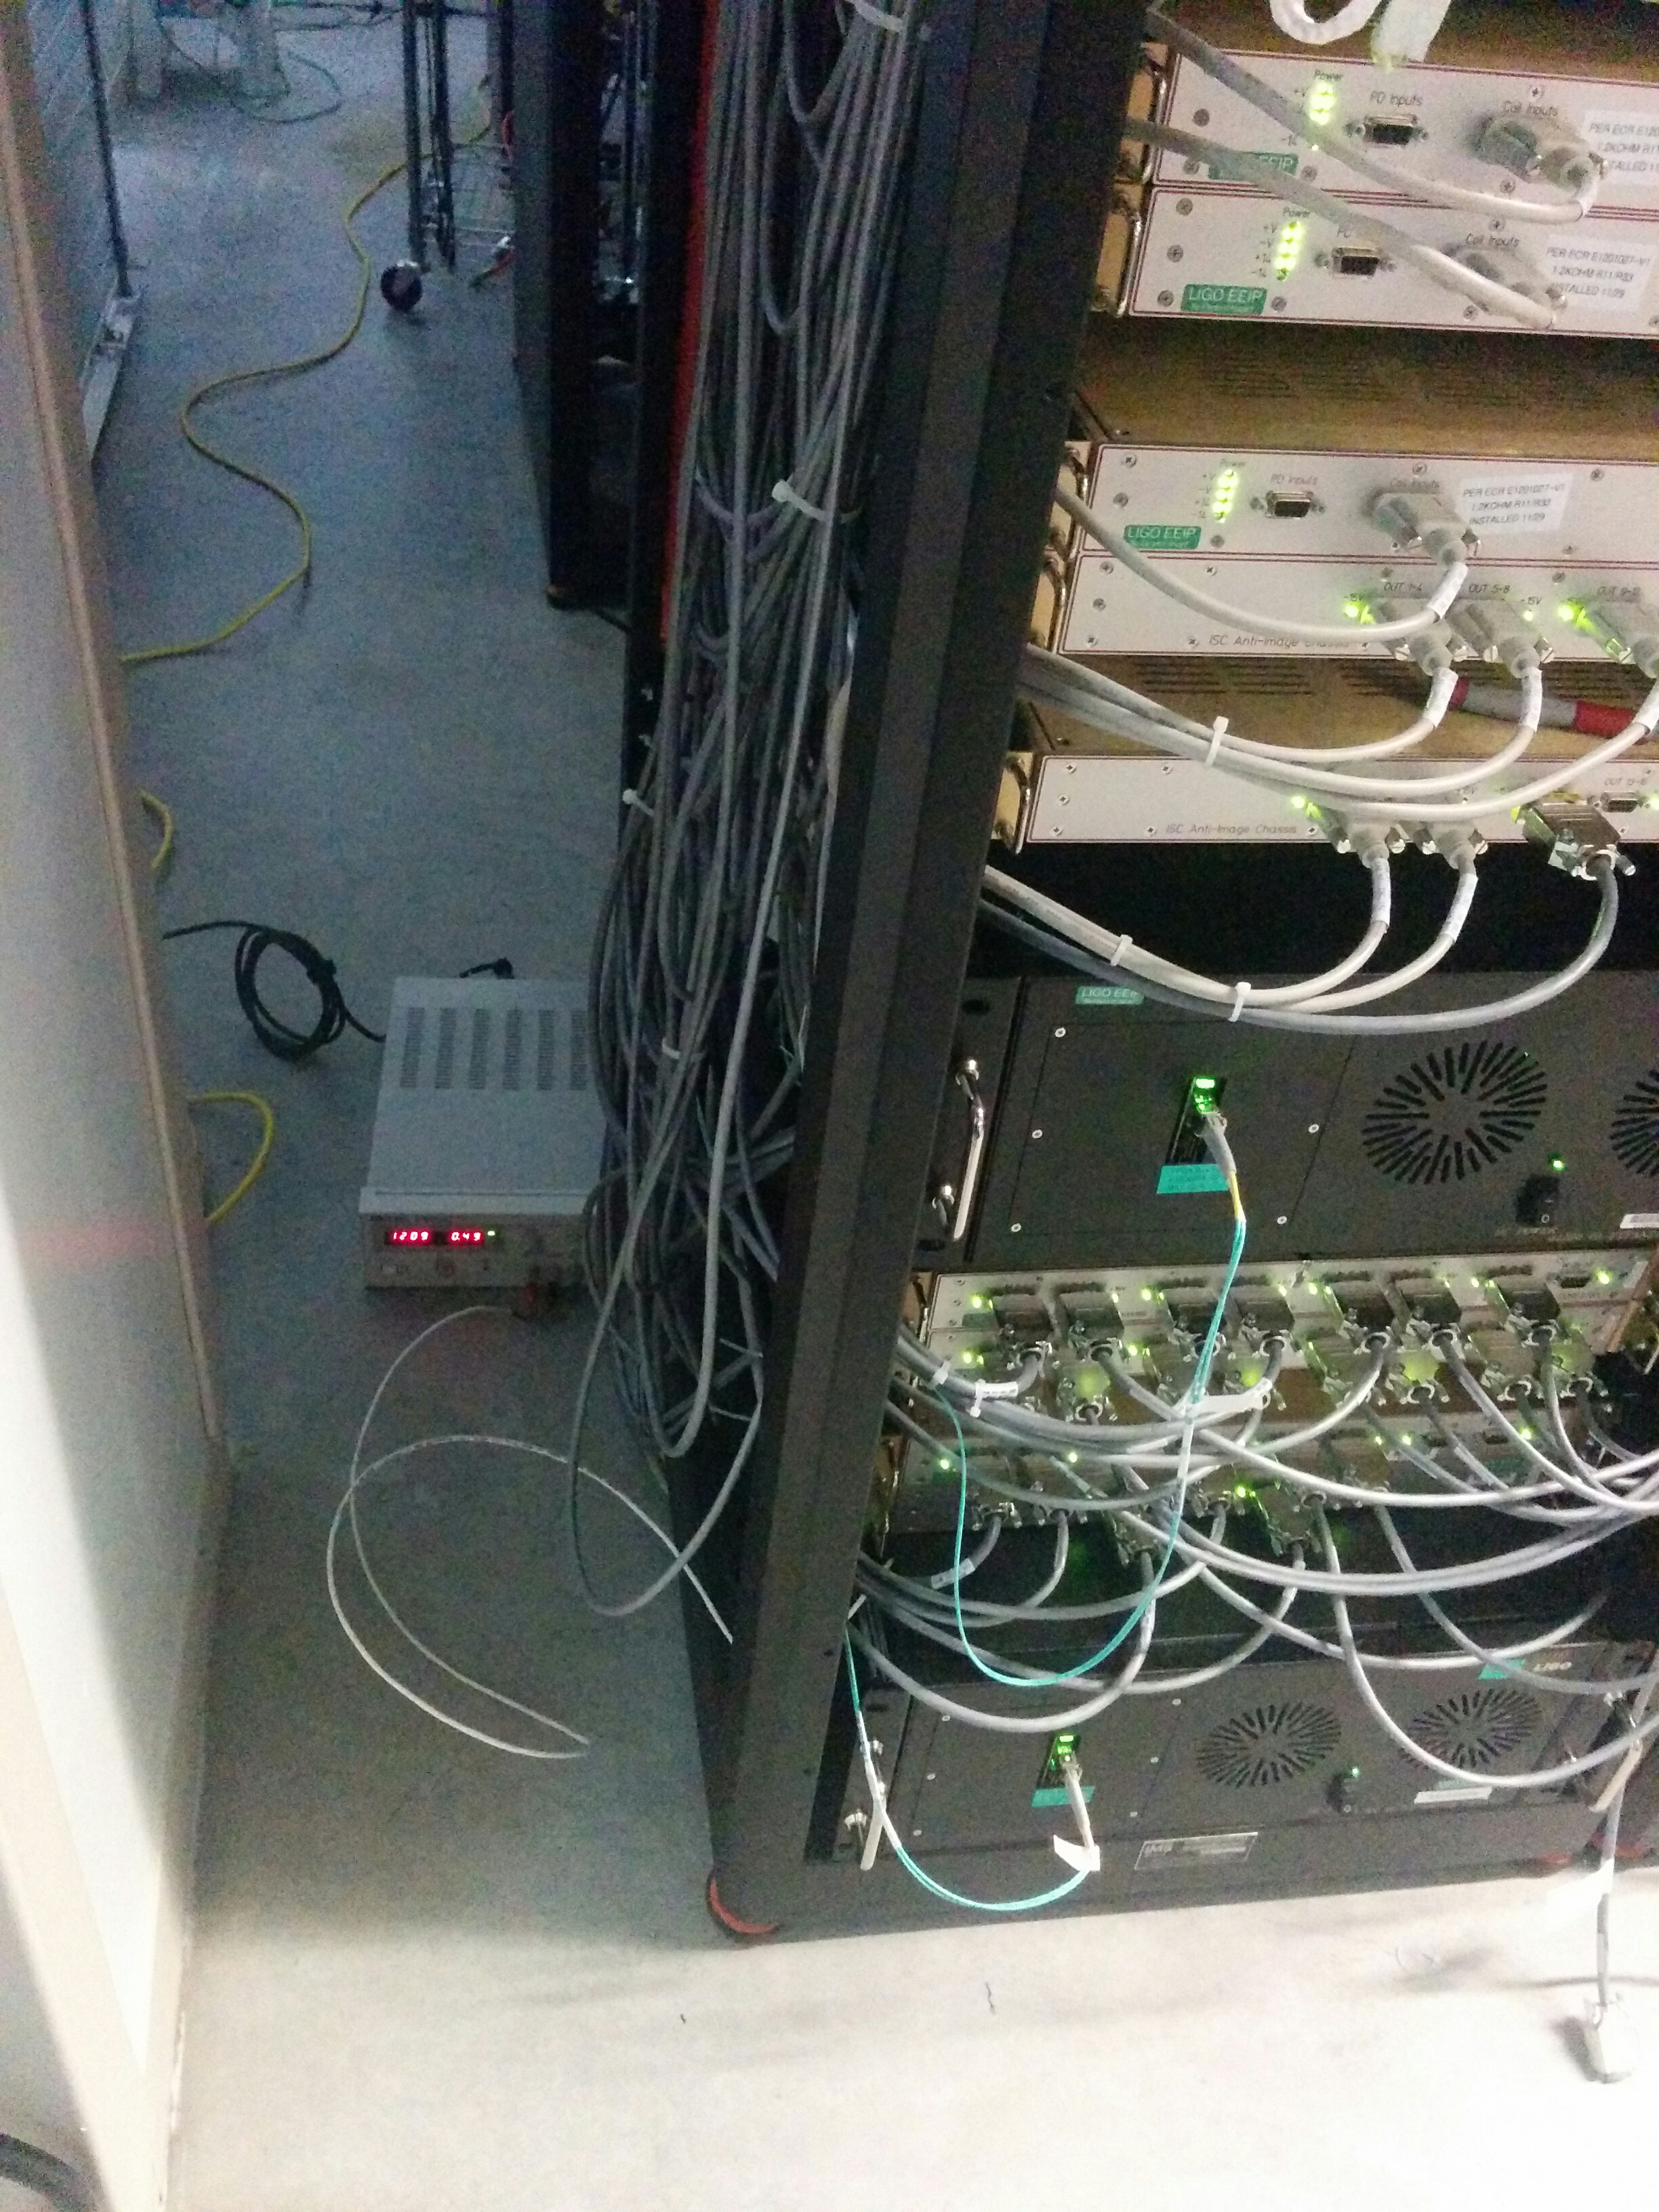
WP 5770

Power down h1lsc0 computer to allow modification of timing slave power in I/O chassis.
h1lsc0 powered back up, no glitches, timing is normal.
[Aidan, Cao]
In the online TCS simulation, I updated the absorption coefficients for ITMX, ETMX and ETMY to reflect actual measured values: https://dcc.ligo.org/LIGO-T1400685
Additionally, I rescaled the TR_X and TR_Y values to reflect the arm powers, courtesy of some calibration work from Cao.
I have a script (copied below) I've been using to update these values as this allows me to store references to measurements and calibrations.
load_IFO_SIM_COEFFICIENTS.sh
caput H1:TCS-SIM_IFO_XARM_LENGTH 3994.47 # aLOG 20149
caput H1:TCS-SIM_IFO_YARM_LENGTH 3994.47
caput H1:TCS-SIM_IFO_SILICA_REF_INDEX 1.44963 #Suprasil 3001, "Heraeus reports 1.44963 as the index at 1064", GLB email Sept 5, 2014
caput H1:TCS-SIM_XARM_POWER_WATTS_PER_INPUT_UNIT 2.606 # estimate of peak value of 105.9kW in arms (needs ref) between 1141200000 and 1141300000 coupled with measurements of TR
_X
caput H1:TCS-SIM_YARM_POWER_WATTS_PER_INPUT_UNIT 2.378
caput H1:TCS-SIM_IFO_cdsMuxMatrix1_1_1 0.5
caput H1:TCS-SIM_IFO_cdsMuxMatrix1_1_2 0.5
caput H1:TCS-SIM_IFO_cdsMuxMatrix1_2_1 1.0
caput H1:TCS-SIM_IFO_cdsMuxMatrix1_2_2 -1.0
# PRC BLOCK
caput H1:TCS-SIM_IFO_PRC_ITM_R3 24.3931 #T0900043-v11, Table 1
caput H1:TCS-SIM_IFO_PRC_R3_R2 16.1558
caput H1:TCS-SIM_IFO_PRC_R2_RM 16.6037
caput H1:TCS-SIM_IFO_PRC_R3_ROC 36.021 # https://galaxy.ligo.caltech.edu/optics/ PR3-01
caput H1:TCS-SIM_IFO_PRC_R2_ROC -4.543 # https://galaxy.ligo.caltech.edu/optics/ PR2-04
caput H1:TCS-SIM_IFO_PRC_RM_ROC -10.948 # https://galaxy.ligo.caltech.edu/optics/ PRM-04
# SRC BLOCK
caput H1:TCS-SIM_IFO_SRC_ITM_R3 24.1176 #T0900043-v11, Table 1
caput H1:TCS-SIM_IFO_SRC_R3_R2 15.4607
caput H1:TCS-SIM_IFO_SRC_R2_RM 15.726
caput H1:TCS-SIM_IFO_SRC_R3_ROC 36.013 # https://galaxy.ligo.caltech.edu/optics/ SR3-02
caput H1:TCS-SIM_IFO_SRC_R2_ROC -6.424 # https://galaxy.ligo.caltech.edu/optics/ SR2-04
caput H1:TCS-SIM_IFO_SRC_RM_ROC -5.638 # https://galaxy.ligo.caltech.edu/optics/ SRM-05 ????? - CHECK
# SPRING CONSTANTS
caput H1:TCS-SIM_IFO_YARM_PEND_SPR_CNST 1.0 # ??????
caput H1:TCS-SIM_IFO_XARM_PEND_SPR_CNST 1.0 # ??????
# ACOS PRC BLOCK
caput H1:TCS-SIM_IFO_ACOS_PRC_A_D_OFFSET 0.87
caput H1:TCS-SIM_IFO_ACOS_PRC_A_D_A0 0.5155940062460905
caput H1:TCS-SIM_IFO_ACOS_PRC_A_D_A1 -2.0281847857870914
caput H1:TCS-SIM_IFO_ACOS_PRC_A_D_A2 -3.6292076586482307
caput H1:TCS-SIM_IFO_ACOS_PRC_A_D_A3 -14.378615634122346
caput H1:TCS-SIM_IFO_ACOS_PRC_A_D_A4 -69.29856186065047
caput H1:TCS-SIM_IFO_ACOS_PRC_A_D_A5 -373.821577053177
# ACOS SRC BLOCK
caput H1:TCS-SIM_IFO_ACOS_SRC_A_D_OFFSET 0.87
caput H1:TCS-SIM_IFO_ACOS_SRC_A_D_A0 0.5155940062460905
caput H1:TCS-SIM_IFO_ACOS_SRC_A_D_A1 -2.0281847857870914
caput H1:TCS-SIM_IFO_ACOS_SRC_A_D_A2 -3.6292076586482307
caput H1:TCS-SIM_IFO_ACOS_SRC_A_D_A3 -14.378615634122346
caput H1:TCS-SIM_IFO_ACOS_SRC_A_D_A4 -69.29856186065047
caput H1:TCS-SIM_IFO_ACOS_SRC_A_D_A5 -373.821577053177
# ACOS YARM BLOCK
caput H1:TCS-SIM_IFO_ACOS_XARM_SQRT_G_OFFSET 0.87
caput H1:TCS-SIM_IFO_ACOS_XARM_SQRT_G_A0 0.5155940062460905
caput H1:TCS-SIM_IFO_ACOS_XARM_SQRT_G_A1 -2.0281847857870914
caput H1:TCS-SIM_IFO_ACOS_XARM_SQRT_G_A2 -3.6292076586482307
caput H1:TCS-SIM_IFO_ACOS_XARM_SQRT_G_A3 -14.378615634122346
caput H1:TCS-SIM_IFO_ACOS_XARM_SQRT_G_A4 -69.29856186065047
caput H1:TCS-SIM_IFO_ACOS_XARM_SQRT_G_A5 -373.821577053177
# ACOS XARM BLOCK
caput H1:TCS-SIM_IFO_ACOS_YARM_SQRT_G_OFFSET 0.87
caput H1:TCS-SIM_IFO_ACOS_YARM_SQRT_G_A0 0.5155940062460905
caput H1:TCS-SIM_IFO_ACOS_YARM_SQRT_G_A1 -2.0281847857870914
caput H1:TCS-SIM_IFO_ACOS_YARM_SQRT_G_A2 -3.6292076586482307
caput H1:TCS-SIM_IFO_ACOS_YARM_SQRT_G_A3 -14.378615634122346
caput H1:TCS-SIM_IFO_ACOS_YARM_SQRT_G_A4 -69.29856186065047
caput H1:TCS-SIM_IFO_ACOS_YARM_SQRT_G_A5 -373.821577053177
# OPTICS gains
caput H1:TCS-SIM_ITMX_SUB_DEFOCUS_RH_GAIN -9.0E-6
caput H1:TCS-SIM_ITMY_SUB_DEFOCUS_RH_GAIN -9.0E-6
caput H1:TCS-SIM_ETMX_SUB_DEFOCUS_RH_GAIN -9.0E-6
caput H1:TCS-SIM_ETMY_SUB_DEFOCUS_RH_GAIN -9.0E-6
caput H1:TCS-SIM_ITMX_SUB_DEFOCUS_CO2_GAIN 62.3E-6
caput H1:TCS-SIM_ITMY_SUB_DEFOCUS_CO2_GAIN 62.3E-6
caput H1:TCS-SIM_ITMX_SUB_DEFOCUS_SELF_GAIN 4.8709E-4
caput H1:TCS-SIM_ITMY_SUB_DEFOCUS_SELF_GAIN 4.8709E-4
caput H1:TCS-SIM_ETMX_SUB_DEFOCUS_SELF_GAIN 3.8577E-4
caput H1:TCS-SIM_ETMY_SUB_DEFOCUS_SELF_GAIN 3.8577E-4
caput H1:TCS-SIM_ITMX_SURF_DEFOCUS_RH_GAIN 1.066E-6
caput H1:TCS-SIM_ITMY_SURF_DEFOCUS_RH_GAIN 1.066E-6
caput H1:TCS-SIM_ETMX_SURF_DEFOCUS_RH_GAIN 1.066E-6
caput H1:TCS-SIM_ETMY_SURF_DEFOCUS_RH_GAIN 1.066E-6
caput H1:TCS-SIM_ITMX_SURF_DEFOCUS_SELF_GAIN -3.652E-5
caput H1:TCS-SIM_ITMY_SURF_DEFOCUS_SELF_GAIN -3.652E-5
caput H1:TCS-SIM_ETMX_SURF_DEFOCUS_SELF_GAIN -2.931E-5
caput H1:TCS-SIM_ETMY_SURF_DEFOCUS_SELF_GAIN -2.931E-5
caput H1:TCS-SIM_ITMX_SURF_ROC_NOM 1939.3
caput H1:TCS-SIM_ITMY_SURF_ROC_NOM 1939.2
caput H1:TCS-SIM_ETMX_SURF_ROC_NOM 2241.54
caput H1:TCS-SIM_ETMY_SURF_ROC_NOM 2238.9
caput H1:TCS-SIM_ITMX_SUB_DEFOCUS_STATIC -1.2467E-5
caput H1:TCS-SIM_ITMY_SUB_DEFOCUS_STATIC 1.7479E-6
caput H1:TCS-SIM_ITMX_SURF_ABSORPTION 520E-9 # alog 16578
caput H1:TCS-SIM_ITMY_SURF_ABSORPTION 250E-9
caput H1:TCS-SIM_ETMX_SURF_ABSORPTION 160E-9 # aLOG 19867
caput H1:TCS-SIM_ETMY_SURF_ABSORPTION 253E-9 # aLOG 19835
TITLE: 03/10 day Shift: 16:00-00:00 UTC (08:00-16:00 PST), all times posted in UTC
STATE of H1: Planned Engineering
OUTGOING OPERATOR: None
QUICK SUMMARY: Nothing IFO unlocked; wind speeds <20mph; .1-.3 uSei hovering between 1-2um/s; DIAG_MAIN showing, "OPLEV_SUMS:SR3 sum is low"
[Kiwamu, AIdan, Elli, Cao]
Following from alog 25905, we attempted to realign the beam spot, which is suspected to be the beam reflected from the HR surface of ITMY onto Hartmann sensor. In order to do this:
1. Turn off CAGE SERVO, misalign the SR3 to the PITCH and YAW values:
PITCH: 1458
YAW: -216.9
2. Since this beam is most far off from the nominal values in PITCH, we start walking the SR3 PITCH back to the nominal value (563.4. At the nominal value, a beam is centered onto HWS, which we suspected it to be the one refleced from AR surface). The walking is done in in increment:
- Decrease the PITCH of SR3 until the beam of interest moves up sightly off the amera active surface.
- Start decreasing the PITCH of the upper periscope, then decrease the PITCH of the lower periscope to compensate. This essentially translate the beam upward, bringing the beam of interest back down into the image frame of HWS.
3. After moving 400 radians in PITCH closer to nominal value, the SLED beam was clipped on the upper periscope mirror (2'' mirror). Initially prior to adjusting the periscope mirror, the beam was at the center. Therefore, a change in 1/sqrt(2) inch helps achieving a change of 400 rad in PITCH. At this point, the green beam in also close to upper edge of th upper periscope mirror. We then moved the upper periscope upward by 0.7 inch order to accomodate another 400 rad change in PITCH of SR3 to move closer to nominal value.
4. After reposition upper periscope mirror, we repeated the similar process of walking SR3 back to nominal values and tilting the upper periscope mirror. However, once achieving SR3 PITCH of 880, we started seeing clipping. Using IR viewer to look into the viewport, Kiwamu identified that the the beam is cipping on the top edge of the in vacuum lens (which was also the wong lens installed). We noticed that the green beam was at the bottom of the upper periscope mirror. We wondered if there was any separation between SLED beam and the green beam of the case of ITMY HWS, considering the y beams pass through SR2 and a wrong in-vacuum lens. We will need to check with Aidan for some ray-tracing model to investigate this.
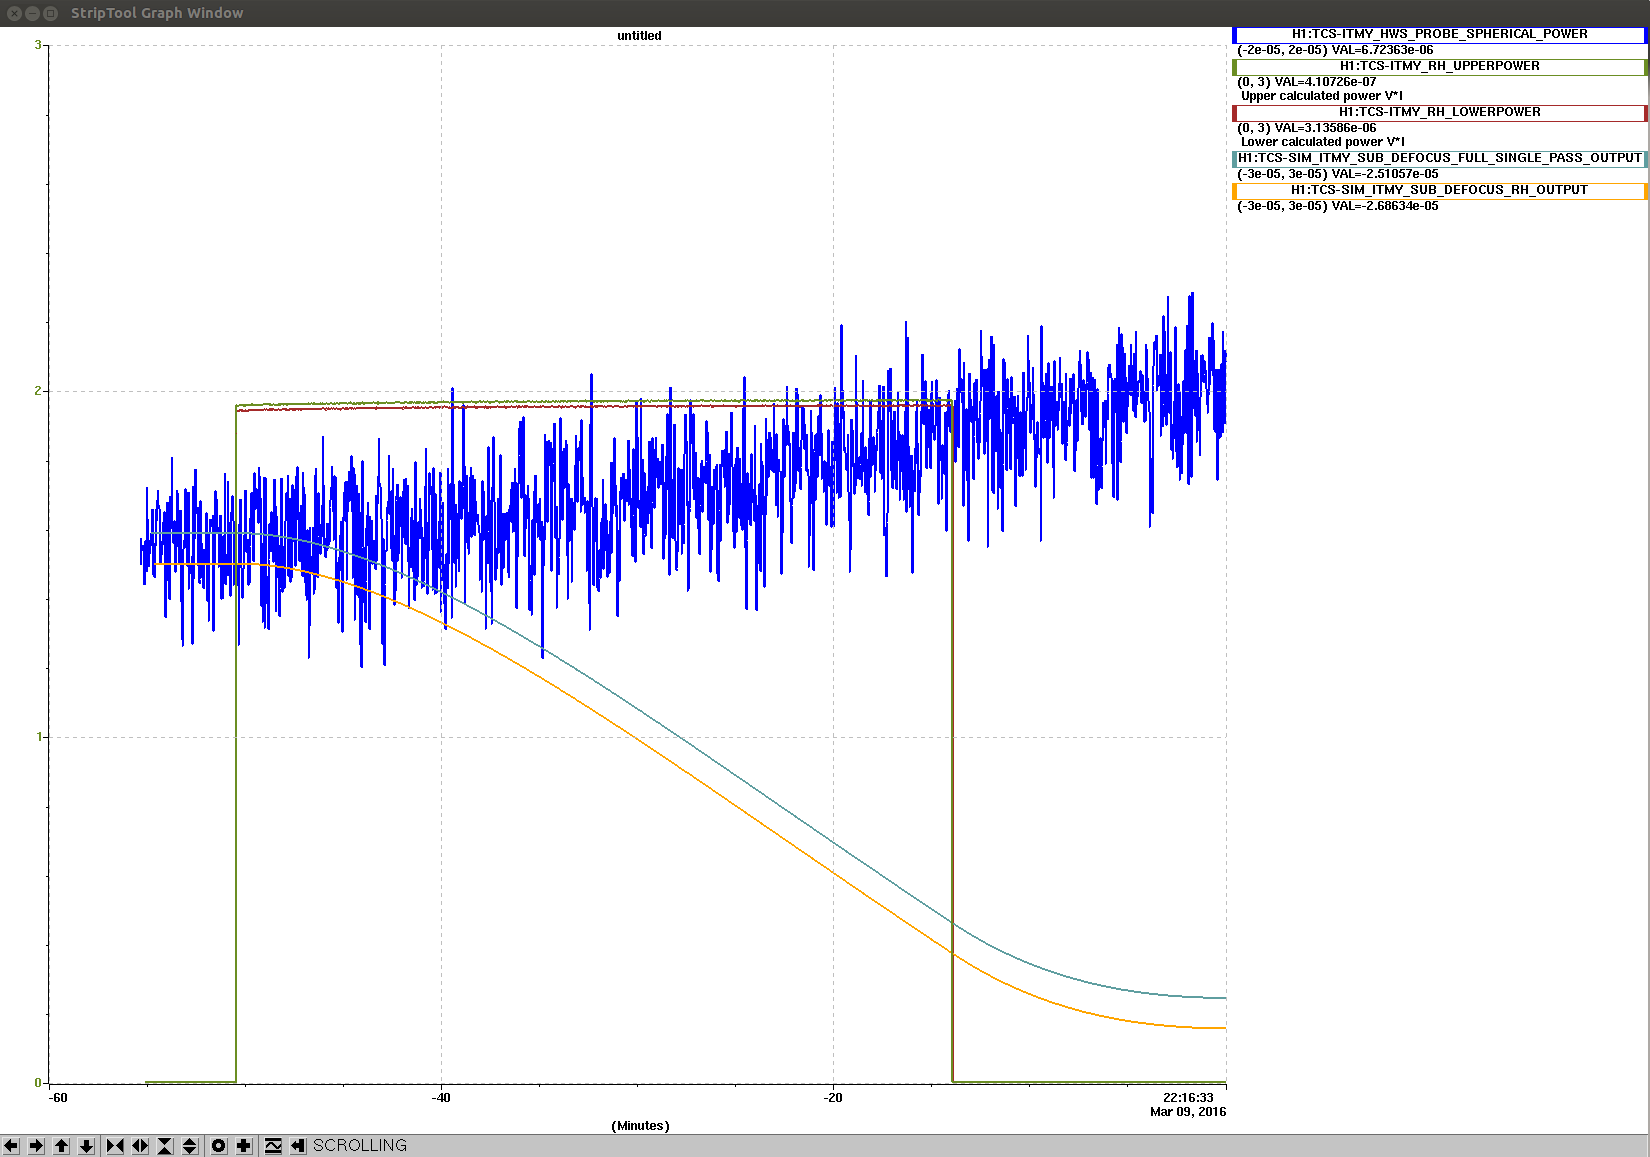
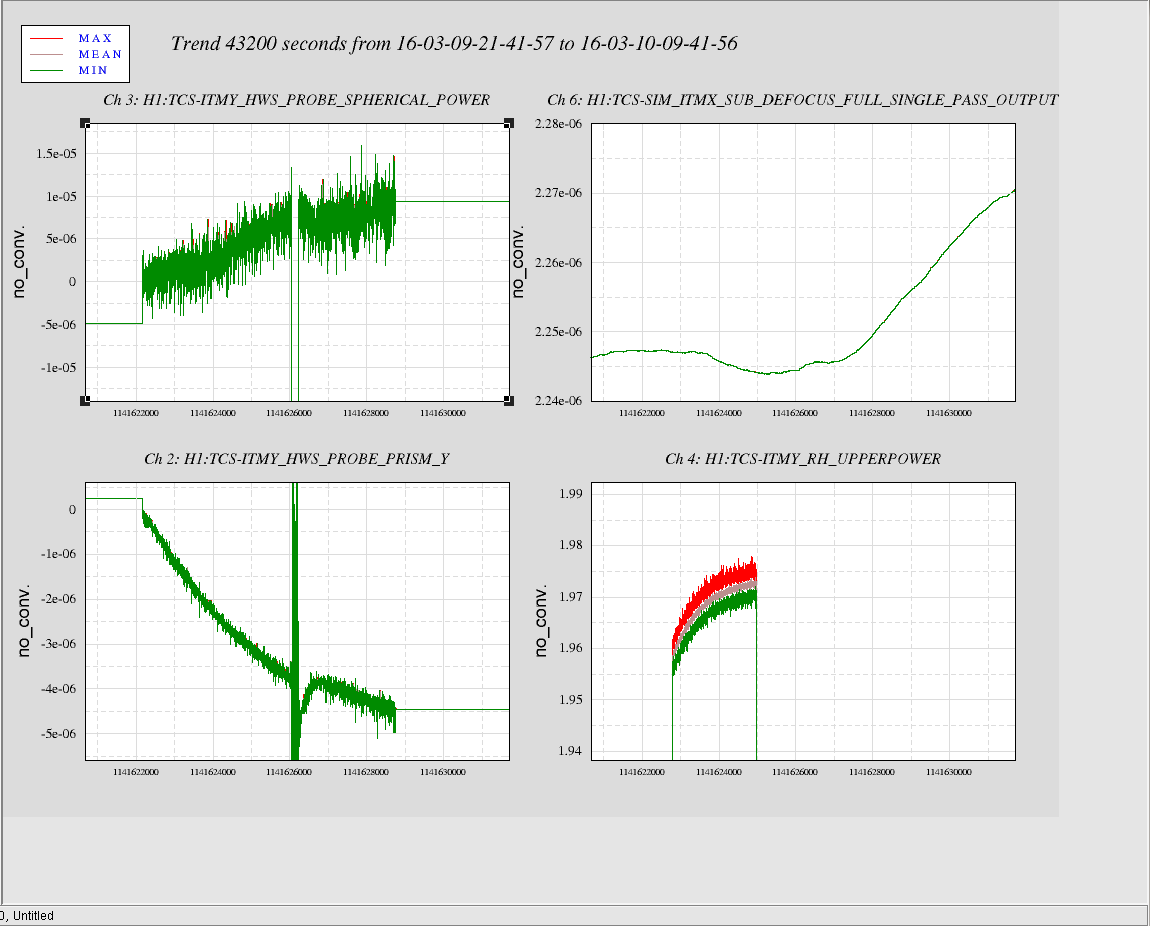
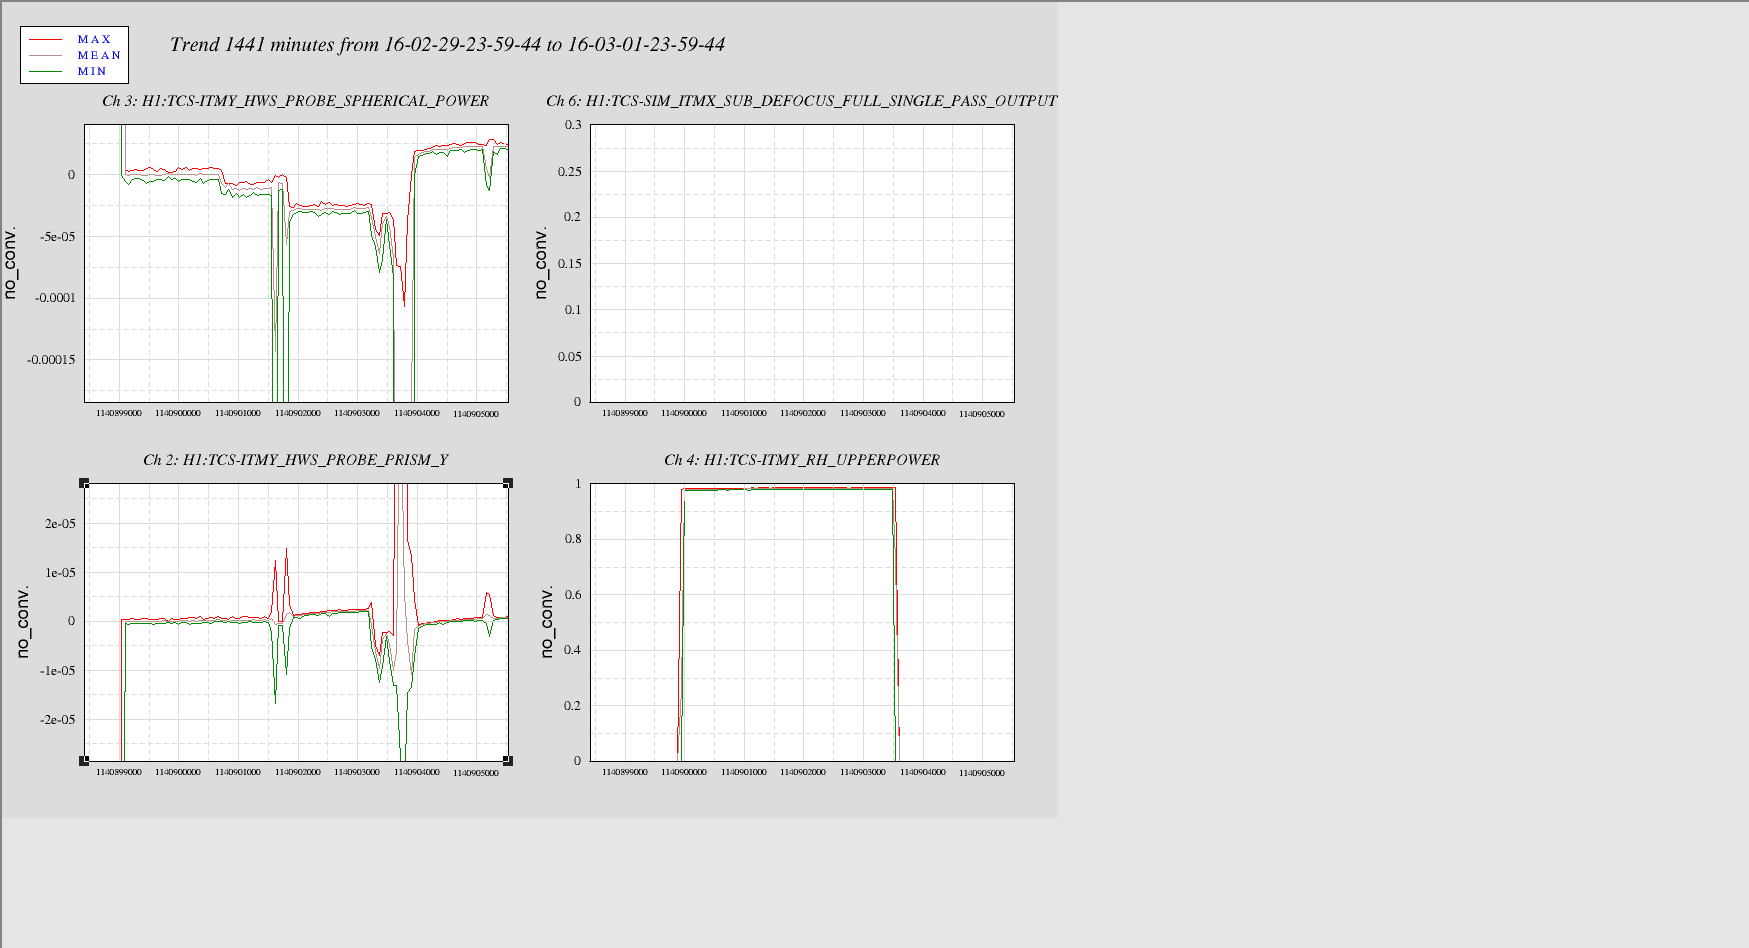
5. Due to this clipping,we could not proceed walking the desired beam onto HWS at SR3 nominal PITCH and YAW values. We then moved the upper periscope downward to initial position, misalign SR3 such that the HR beam candidate was centered onto the HWS and started the ring heater test. Each RH segment were turned on to 2W and we observed the measured spherical power from the HWS, compared to the simulation. This was indeed the first beam that we observed changes when RH is applied. However, looking at image RH_ITMY_9Mar.png , we noticed the trend of change did not follow what we expected from the simuation:
i. When RH is on,we expected the spherical power to decrease, what observed was the opposite in which the spherical power measured increased with time.
ii. The rate of increase in spherical power was much lower than the simulated rate of decrease. Whereas in my recent study of the RH model for X-arm, the magnitude of spherical power simulated is much smaller than measured data.
iii. The measurement of spherical power was very noisy.
For the first two points, I suspected it's either:
1/ The beam may not be centerd on the test mass but off slightly to one side and what we're getting is an artefact .
2/ The magnification and the change to a concave lens (the wrong in-vaccuum lens) have not been accounted for correctly, thus resulting in a flip of wavefront, giving rise to increase in spherical power measured.
Either way, I will have a look at the gradient plot tomorrow and see if we can do some ray tracing modelling to identify where the problem comes from.
The attached shows a cartoon of what we think the situation is.
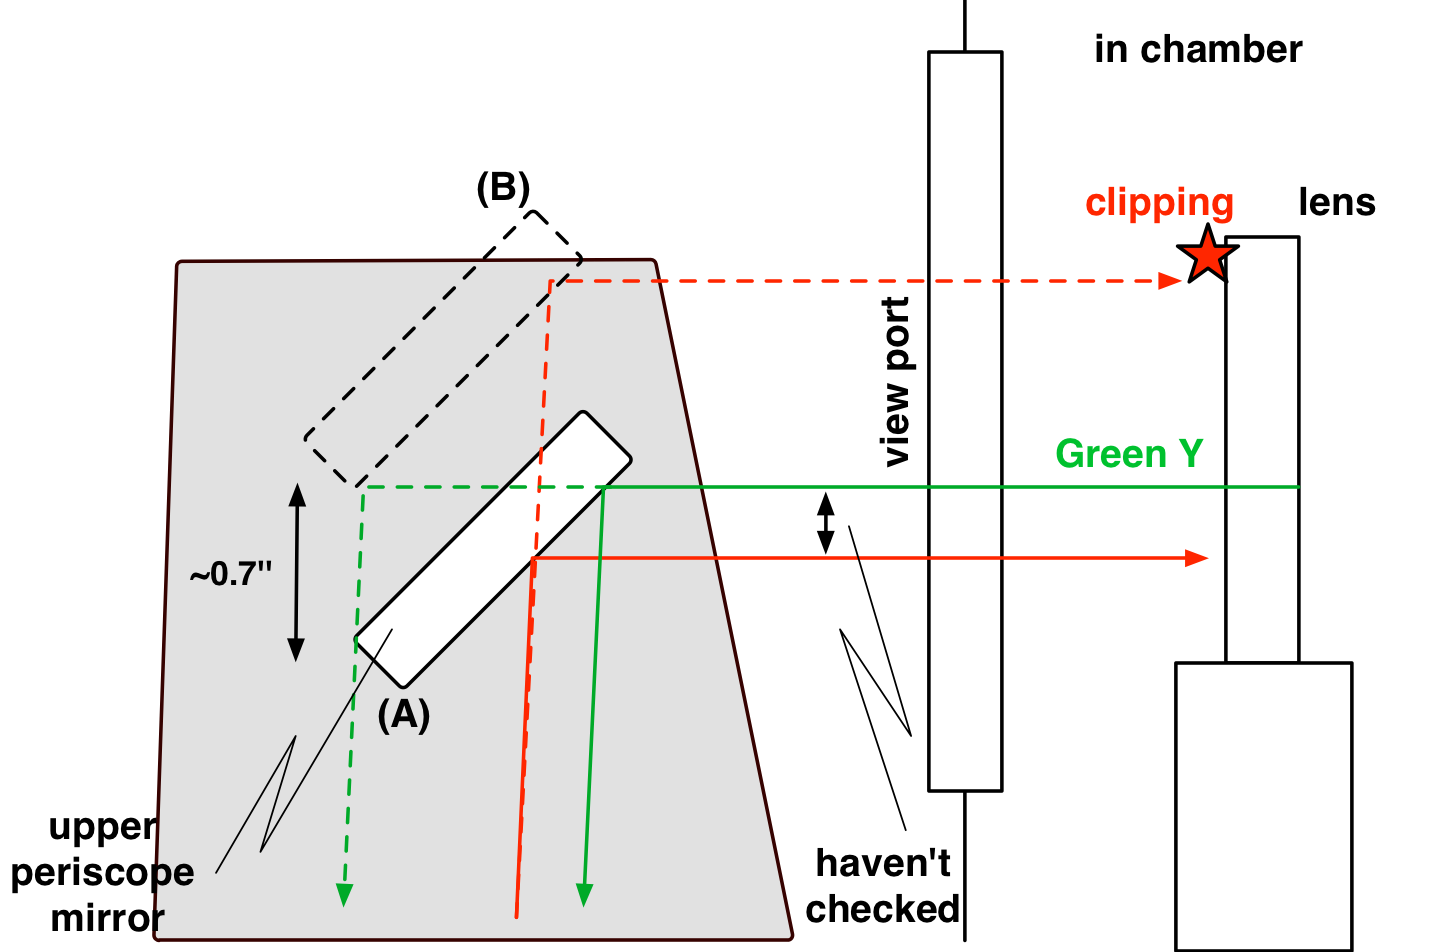
As Cao explained in his alog, we needed to shift the upper periscope mirror in order to get the beam of interest aligned on HWS with the nominal SR3 alignment. Position (A) is the nominal location of the upper periscope mirror in which a wrong beam has been aligned to HWS (alog 25905). Position (B) is a place we tentatively shifted the mirror position. According to the screw holes on the periscope, we seem to have shifted the mirror and its base plate by 0.7'' upward. A back-of-envelope calculation suggested that the mirror needed to go another 0.7'', but we stopped at this point because we started having an issue.
In position (B) the beam started clipping at an in-vac lens in the HAM4 chamber. This is consistent with what we saw previously (alog 25766 although no mention in the log). The clipping was visible through the viewport with an IR viewer, and also visible on the SR3 camera that clearly showed a clipped beam incident on SR3. Interestingly, the green beam started falling off the upper periscope mirror at the bottom of the mirror. It completely missed the bottom periscope mirror.
After today's alignment challenge and test, we shifted the mirror back to position (A) so that we can have beams which are not clipped.
SR3 was left misaligned by 771 urad in pitch overnight. I re-engaged the SR3 cage servo and noticed that the output was very large. Since Team TCS had been moving it around last night, I trended the Optic_Align values, and put them back to their positions from early yesterday. Yaw was at its nominal position, but pitch was too high by 771 urad.
I looked further into the data from last night RH test of the ITMY HWS. We were misalining the SR3, to test whether the [1458, -216.9] beam the HR beam:
The time series seen from dataviewer DV_RH_IMY_9Mar.png shows that together with the small change in spherical power, there is also a change strong change in prism.
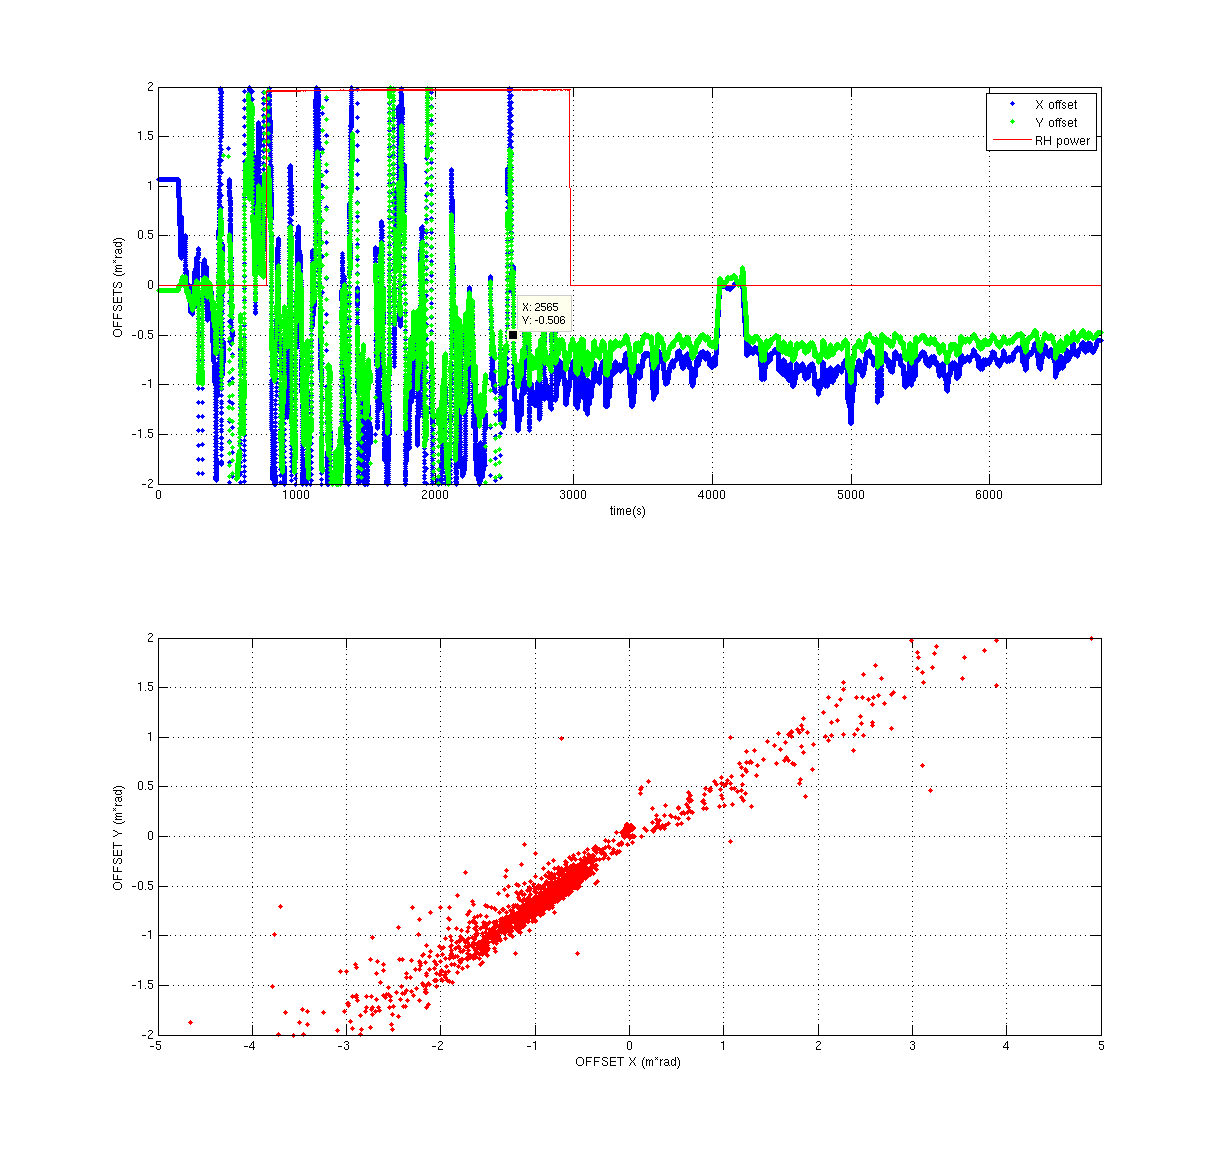
The ratio between spehrical power and prism results should give the offset of the beam from the test mass. Therefore, I looked at the ratio between PRISM_X/SPHERICAL_POWER and PRISM_Y/SPHERICAL_POWER.
Image OFFSET_RH_9Mar.png shows the plot of the time series of these two ratio and the second subplot shows the PRISM_X/SPHERICAL_POWER vs PRISM_Y/SPHERICAL_POWER.
The ratios look very noisy for the first 40 minutes that the HWS was running, and us independent of the power applie onto the RH. But we can see a trencd that both ratios decreases to -1 m*rad. This shift to the offset at -1 m*rad can be seen quite clearly in the second subplot where there is a cluster of data point at (-1,-1) region.
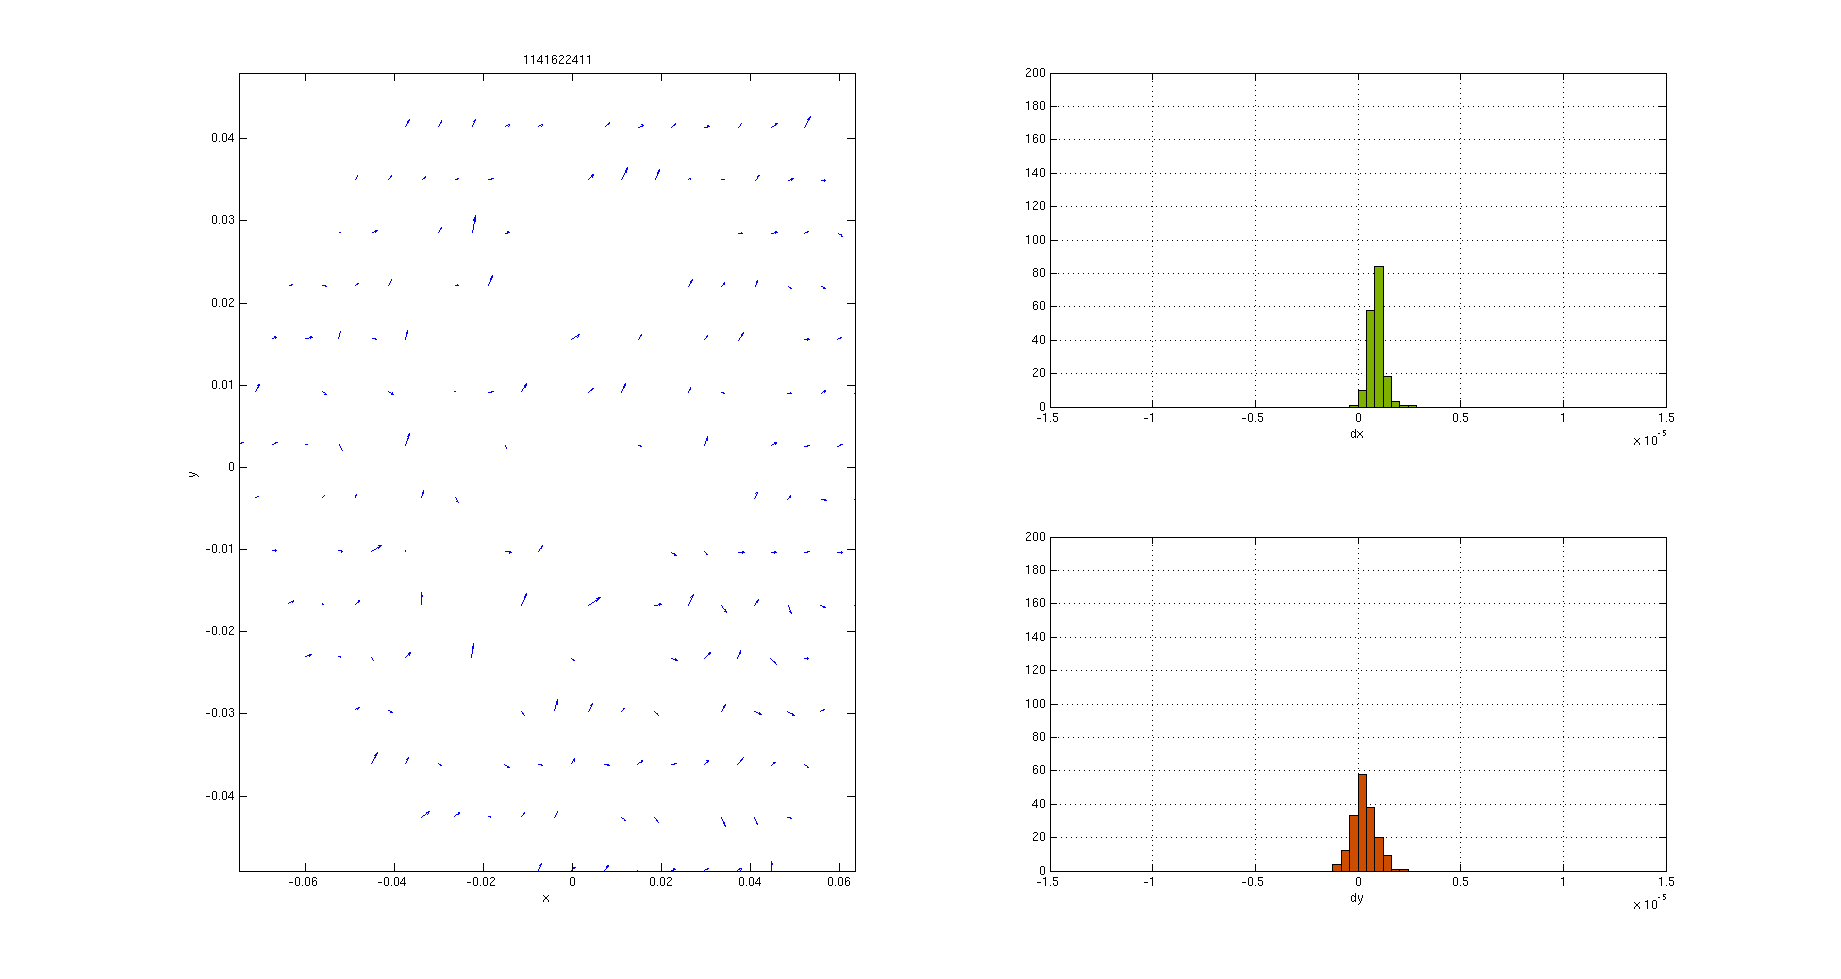
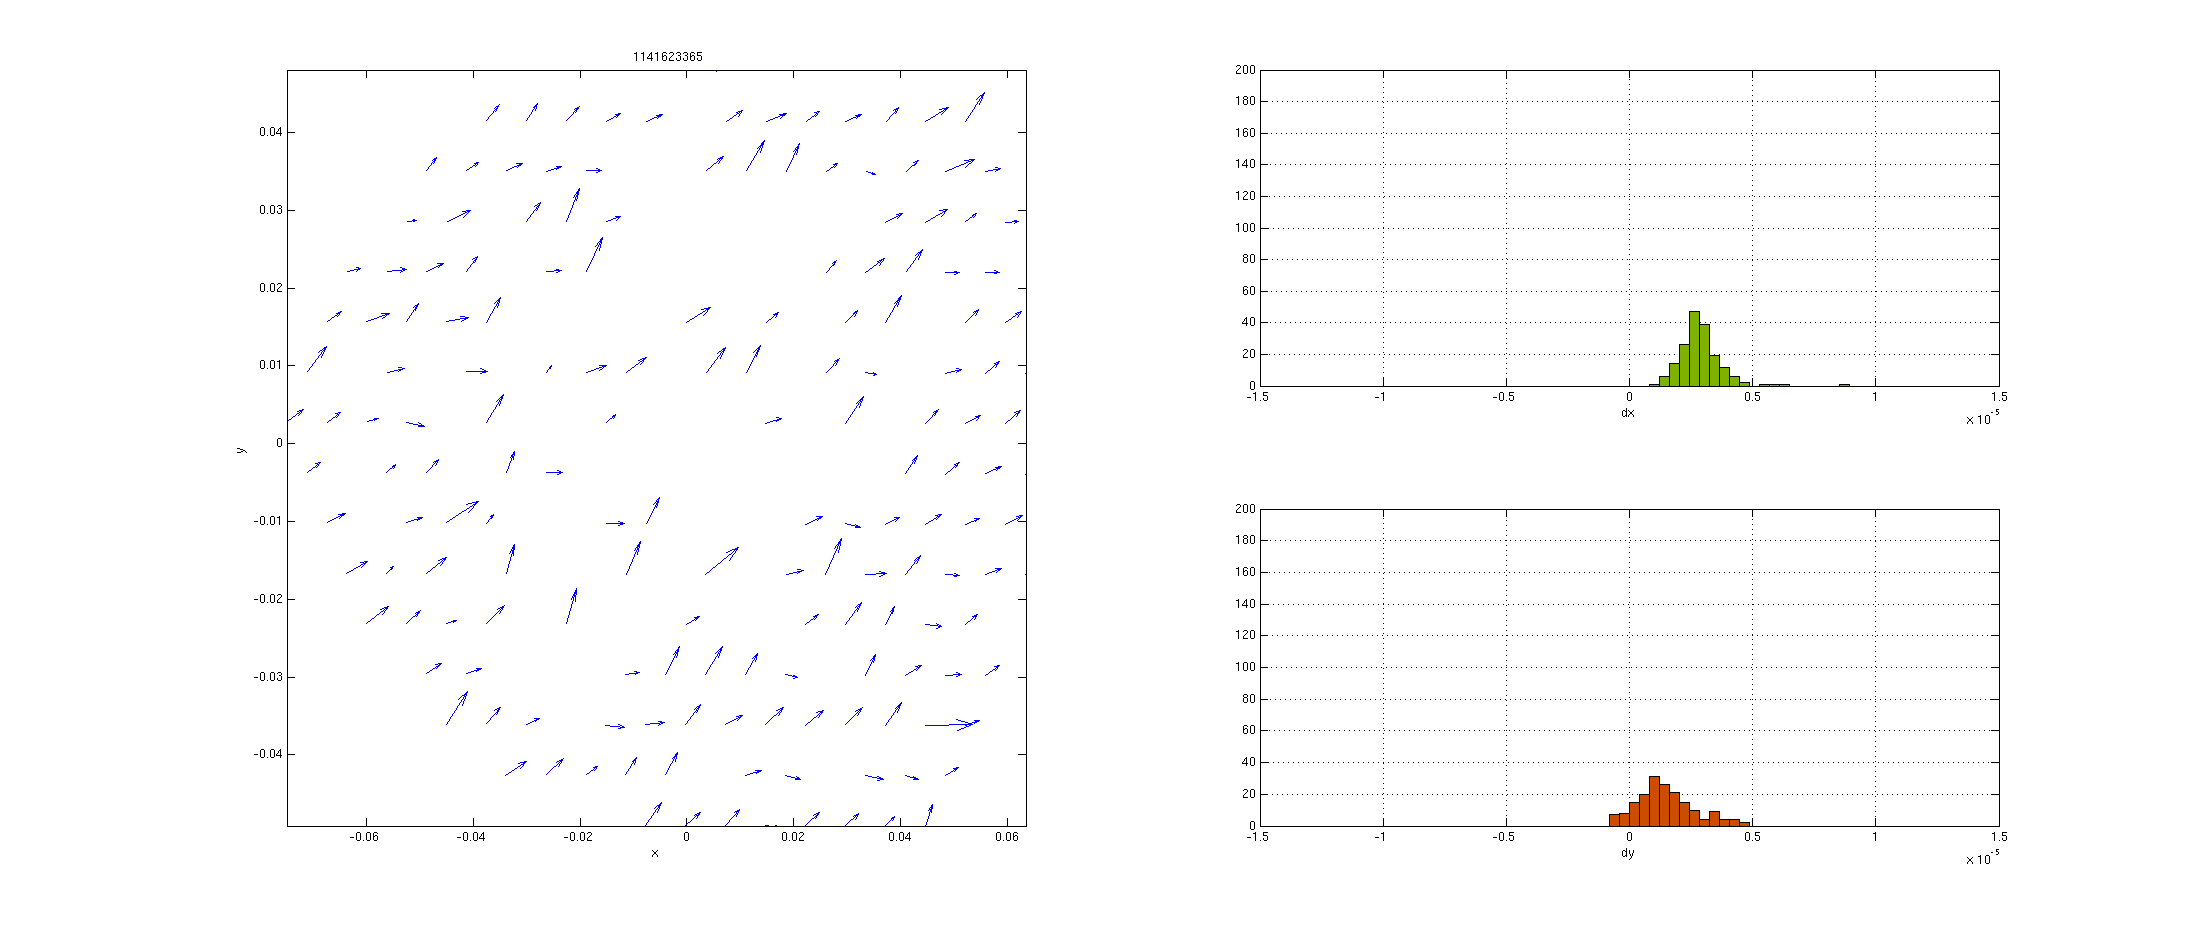
Gradient plot showed strong prism developing but no evidence of spherical power (compare beginning frame RH_ITMY_grad_start.png and final frame RH_ITMY_grad_end.png). What was more curious was that some centroids were missing from the gradient plot (see RH_ITMY_grad_end.png ).This certainly has effected the fidelity of any parameter measured by the HWS. Howevwe there is certainly no evidence supporting this is the right spot.
Aidan has recently checked the reflectivity of AR and HR surface, and for this wavelength (840 nm), the AR surface has the stronger reflectivity. Thus now the suspected HR beam is the one we are currently centered on at the nominal values PITCH and YAW of SR3. We have now turned the both ITMX and ITMY HWS on (alog 25991).
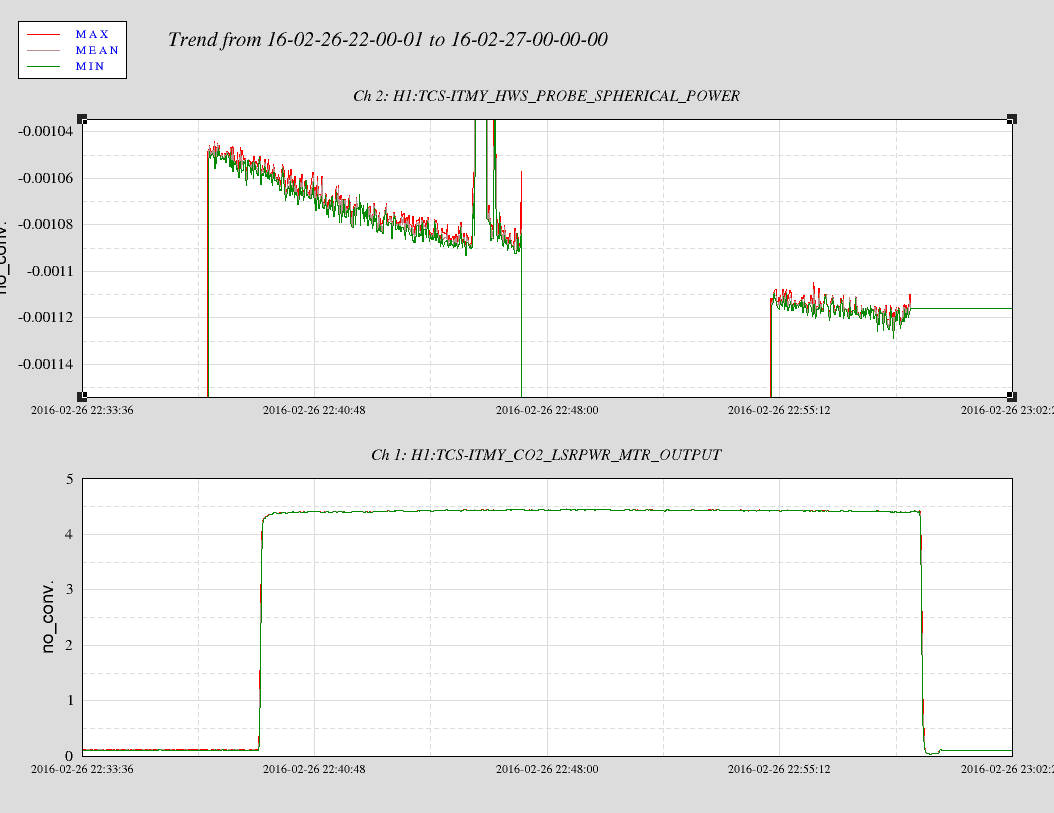
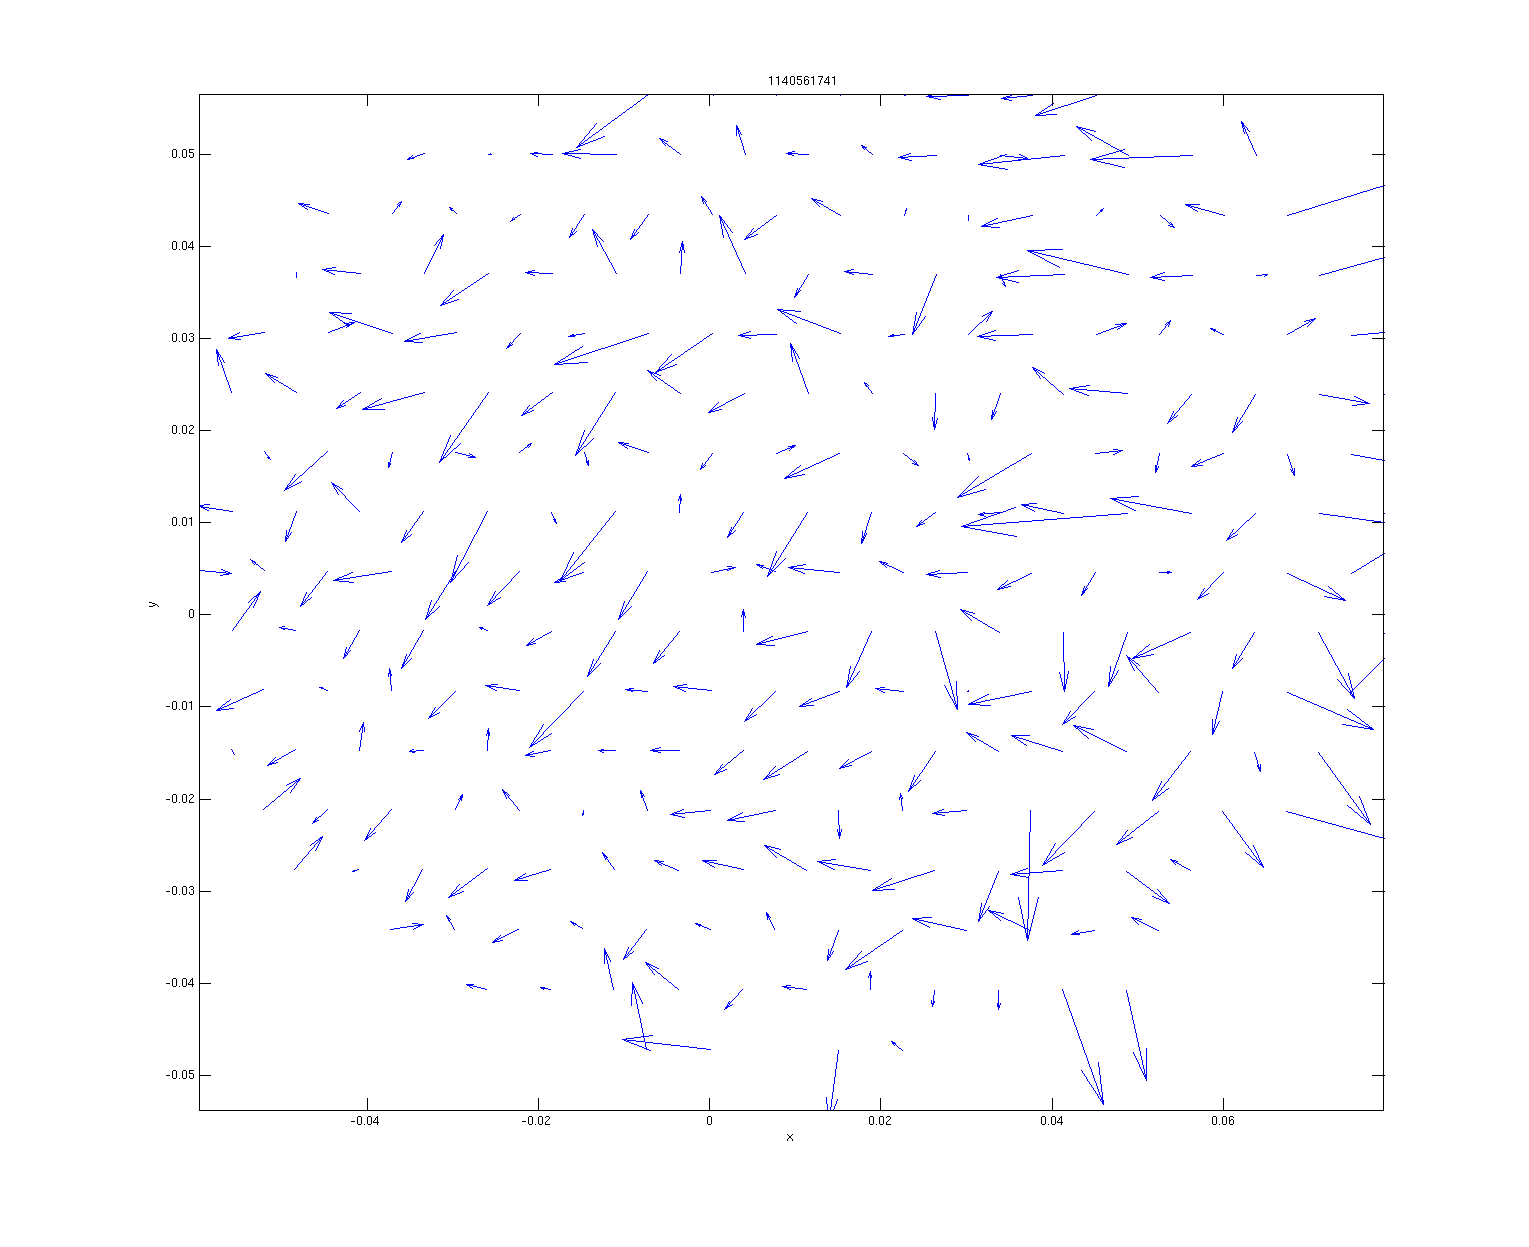
However our previous test (RH and CO2 laser) with this spot also results in strange result that did not support our simulation. For example, time series RH_ITMY_1Mar.png shown for RH test on March 1 when this beam was centered on HWSY showed that there was no change in spherical power while RH was turned on to 1W for 1 hours. The step change observed was resulted from us opening the HWS table to replace HWSX SLED on the day (alog 25806). The CO2 test data on 26 Feb with the same beam showed a decrease in spherical power measured, whereas the simulation expected spherical power to inrease (see ITMY_CO2_26Feb.png). Checking the gradient plot also did not show evidence of thermal lensing expected with CO2 but gradient developing towards the (-ve x, -ve y) region of the quiver plot.
State of H1: warm, after TCS work
Activities:
Elli, Kiwamu, Kau, Nutsinee: people working on TCS
Dick: working at PSL racks
Curent Status: high useism and ITM heaing combine to prevent locking
Kiwamu, Stefan
Looking at the cross-power plot in alog 25768, we see a coherent noise floor following the shot noise a factor 3.3 below.
Looking at alog 21167, this seems cosistent with our old firend the excess 45.5 MHz noise in DARM.
Shot noise of 20mA: 8e-8mA/rtHz: a factor of 3.3 below that: 2.4e-8mA/rtHz. This is roughly consistent with the residual coherence seen in alog 21167.
Kiwamu will make an all-O1 plot to nicely resolve that noise. We need to add this noise to the mystery noise projection in alog 25106 (this plot).
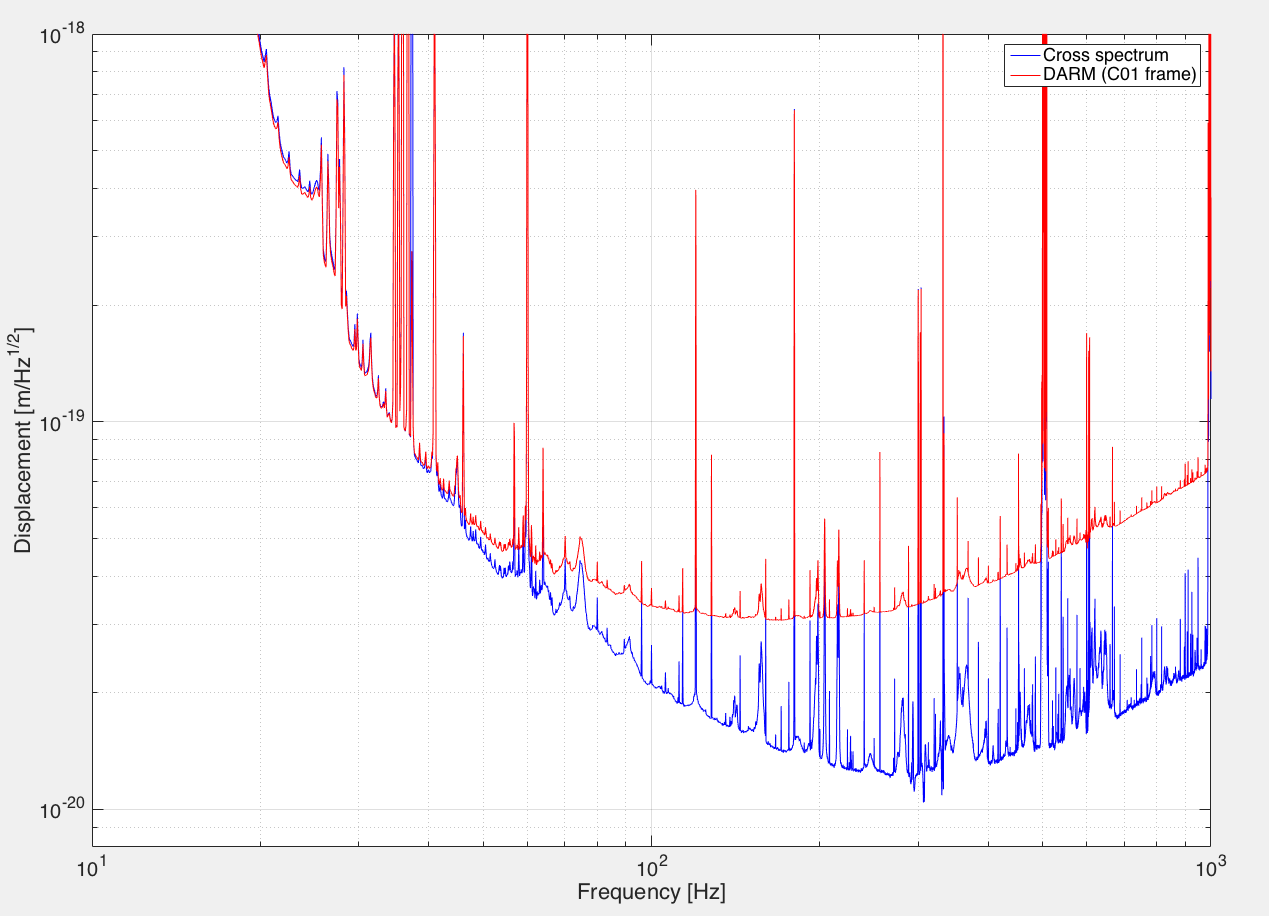
Here is a cross-spectrum with more number of averaging (over 867 hours using the data between Oct-21-2015 to Jan-17-2016 with some glitchy durations excluded).
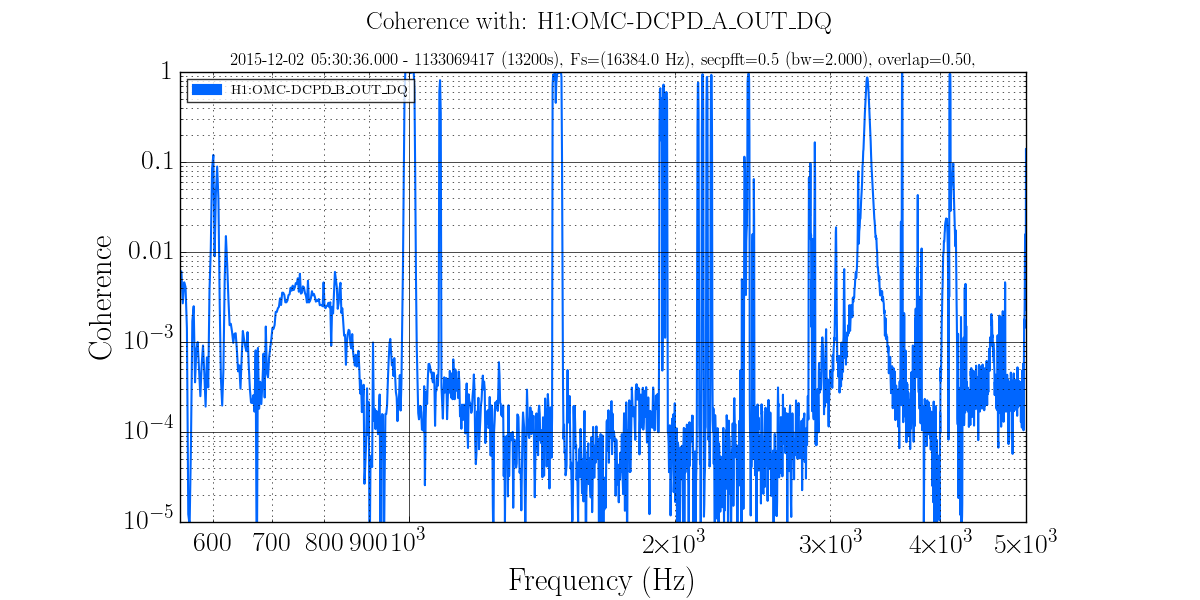
I looked at some few-hour stretches of O1 data and took the coherence between the DCPDs.
Above 1 kHz (where the DARM OLTF is −55 dB or less), the coherence goes as low as 1×10⁻⁴. See attachment for an example; FFT BW is 2 Hz and number of averages is >50,000. That would imply a correlated DCPD sum noise that is a factor of 7 below the shot noise [since the correlated noise ASD in each PD should be (1×10⁻⁴)1/4 = 0.1 relative to the uncorrelated (shot) noise ASD].
I suppose it is possible that the secular fluctuations in the nonlinear 45 MHz noise are enough to push the overall O1 coherence up to 2×10⁻³, which is what is required to achieve a correlated noise that is a factor of 3.3 below the shot noise in the DCPD sum.
To test this, I propose we look at the variation over O1 of some kind of BLRMS of the 45 MHz EOM driver control signal (or perhaps just the dc level of the control signal), similar to what Kiwamu has already done for some of the suspension channels.
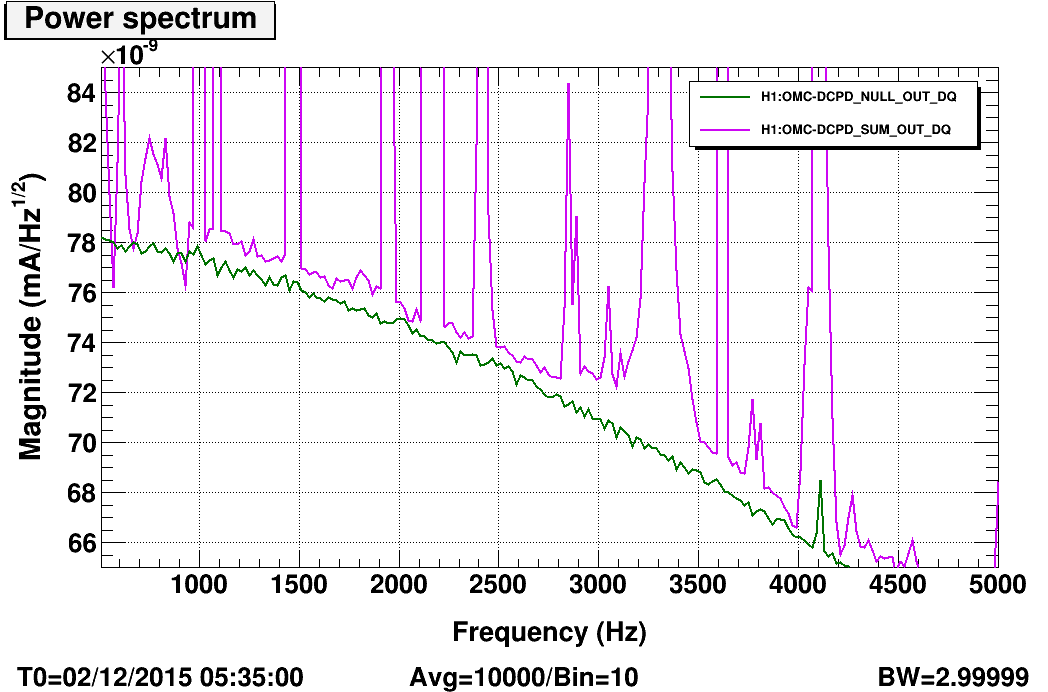
During this same time period, the excess of sum over null above 1 kHz is about 0.1×10⁻⁸ mA/Hz1/2. Assuming 8×10⁻⁸ mA/Hz1/2 of null current therefore implies the correlated excess is a factor of 6 to 7 below shot noise.
(The slope in the data is probably from the uncompensated AA filtering).
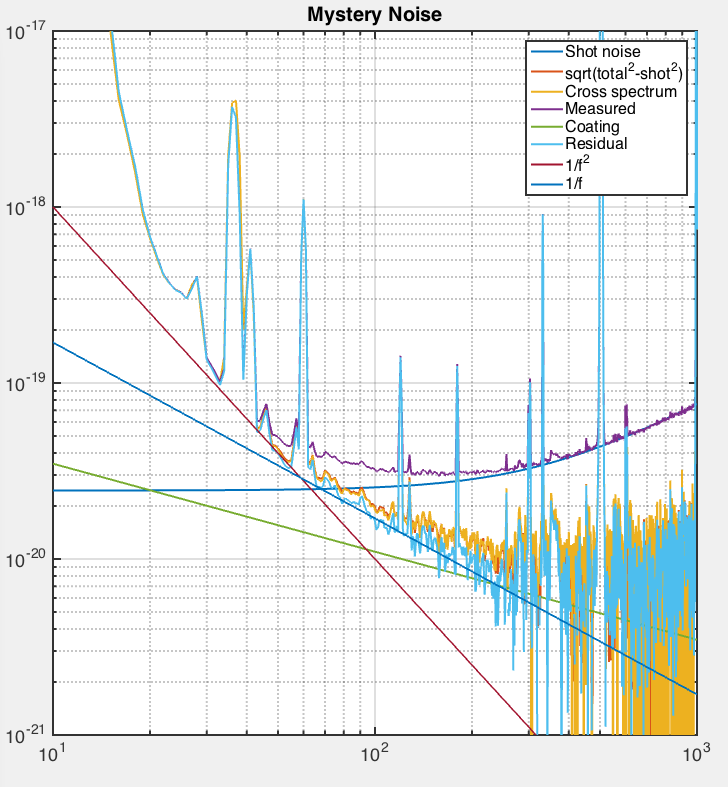
The second attachment shows the conversion of the sum and null into equivalent freerunning DARM. From the residual alone, the limit on the coating Brownian noise seems to be a factor of 1.6 above nominal. (I quickly threw in a 5 kHz zero when undoing the loop in order to compensate for the AA filtering).
Finally, I add some mystery noise traces to this residual, where the slopes and amplitudes have been arrived at by careful numerology. The addition of a 1/f2 noise and a mystery white sensing noise (similar to 26004, but tuned to the residual during this time period) reduces the possible coating Brownian excess factor to 1.45 or so.
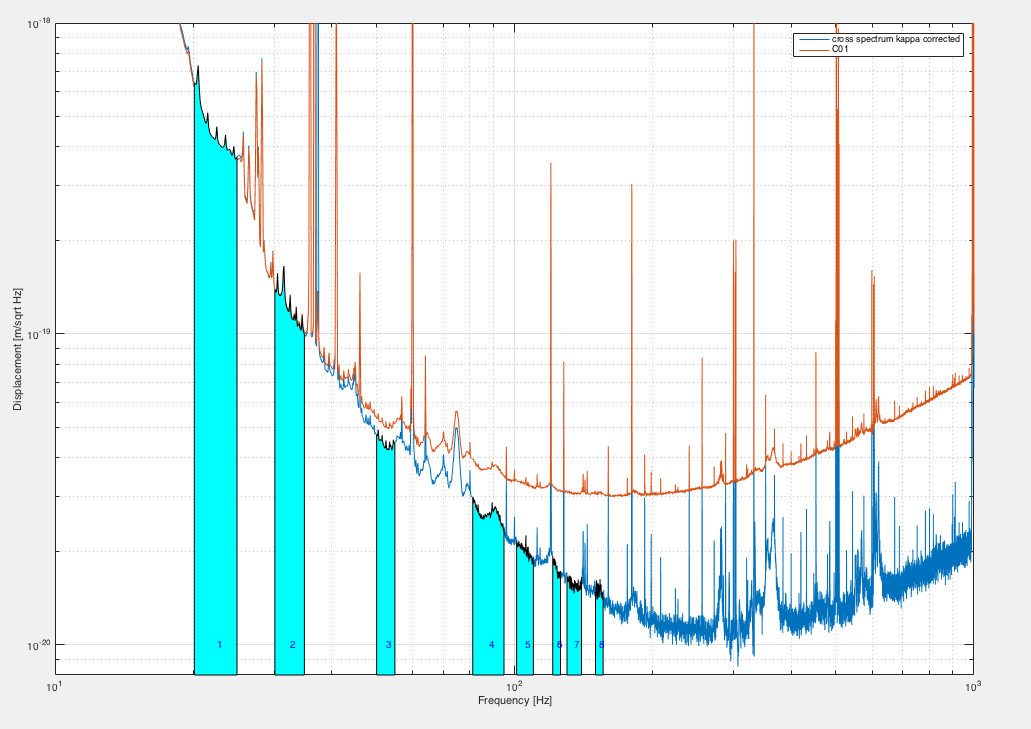
Here is an updated version of the cross spectrum using the O1 data. I have fixed a bug which previously overestimated the cross specctrum and have extended the analysis to high frequencies above 1 kHz.
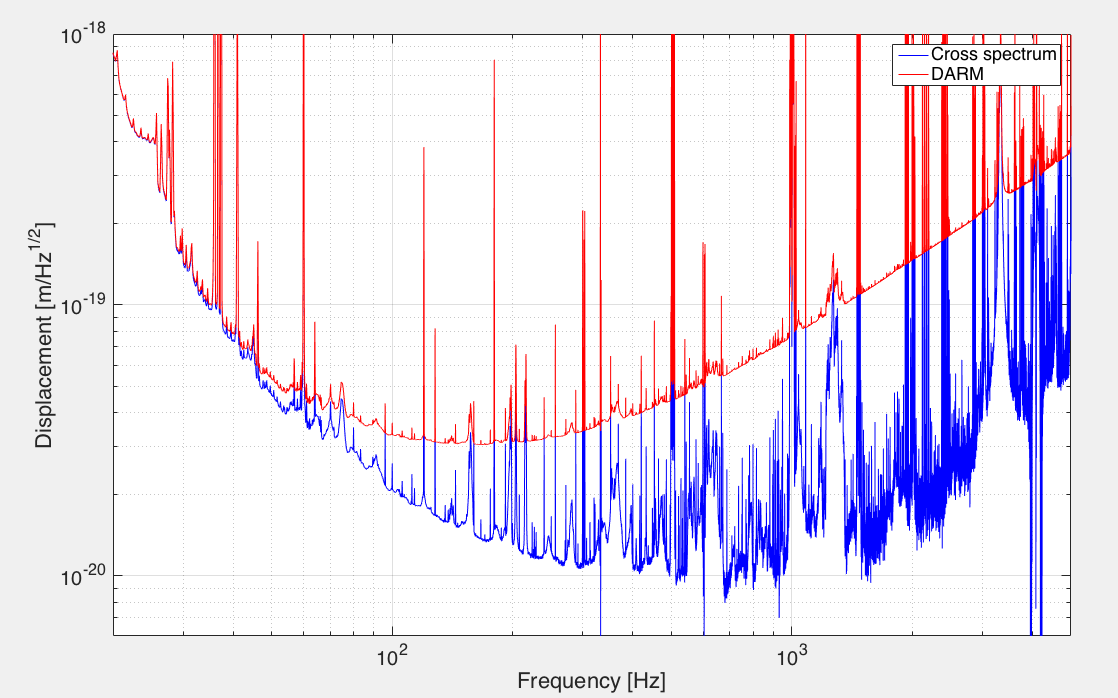
As pointed out by Evan, my previous analysis overestimated the correlated noise. This turned out to be due to a bug in my code where I summed the absolute value of the segmented cross spcetra when averaging them. This is apparently wrong because the cross spectra by nature can have negative value (and imaginary number). I fixed the analysis code and reran the analysis again. The result looks consistent with Evan's targeted cross spectrum -- the kink point of the cross correlation happenes at around 1 kHz with the noise floor touching 1e-20 m/sqrtHz.
LN2 levels for CP3 and CP8 are not under PID control.
Forgot to mention that I am monitoring from home
I made a first attempt to investigate the probability of a beam tube tap producing a DARM glitch as a function of tap amplitude. I mounted an accelerometer on the beam tube just inside the single door at Y1-4 +1Y and tapped 2 stiffening rings away. The only DARM glitch produced was for a tap that saturated the accelerometer (> 1.09 m/s^2). There were a total of ten taps that exceeded this threshold. No glitches were seen for the 70 taps that were under this threshold. This data supports the contention that the glitch probability is a strong function of tap amplitude. I would like to use a shaker to inject at lower amplitudes for day-scale periods in order to better understand the probability function, but this experiment hasn’t been cleared yet because of fatigue concerns.
One could imagine sudden accelerations of the beam tube, such as thermal expansion stick-slip events, that might be high enough in amplitude and frequency to produce particulate glitches. I investigated the possibility of using microphones to detect such events. I set up a temporary microphone in the beam tube enclosure, running into the CS DAQ. I found, that for the amplitude of taps that produced glitches, I could detect the sound from 1km away (Figure 1). Thus we could monitor the entire beam tube with 8 microphones, based in the stations, but located in the beam tube enclosure just outside the stations.
|
amplitude m/s^2 |
injections |
glithes |
|
>1.09 |
10 |
1 |
|
1.07-1.09 |
20 |
0 |
|
less than 1.07, greater than 0.05 |
50 |
0 |
To install this at LLO would require procurement of front-end computers/IO chassis for mid-stations. We noted this equipment was purchased by aLIGO for LHO, but not for LLO.
Attached are 7 day pitch, yaw, and sum trends for all active H1 optical levers.
Almost everything looks good, with no changes from last week. The only concerning thing that we need to keep an eye on is the BS SUM; it has dropped from >20k counts to <10k counts over the last week. As soon as I get back from Germany I can start looking into it.
[Aidan, Kiwamu, Elli, Cao]
SUMMARY:
We prformed a definitive test to confirm the HWSY beam reflected off the HR surface of ITMY. The test arrived at the same conclusion as a previous test reported in alog25617.
The beam reflected from HR surface is the one observed at :
SR3 PITCH: 1458 urad
SR3 YAW : -216.9 urad
(The nominal value of SR3 PITCH and YAW at the moment are 563 and -153.9)
METHOD:
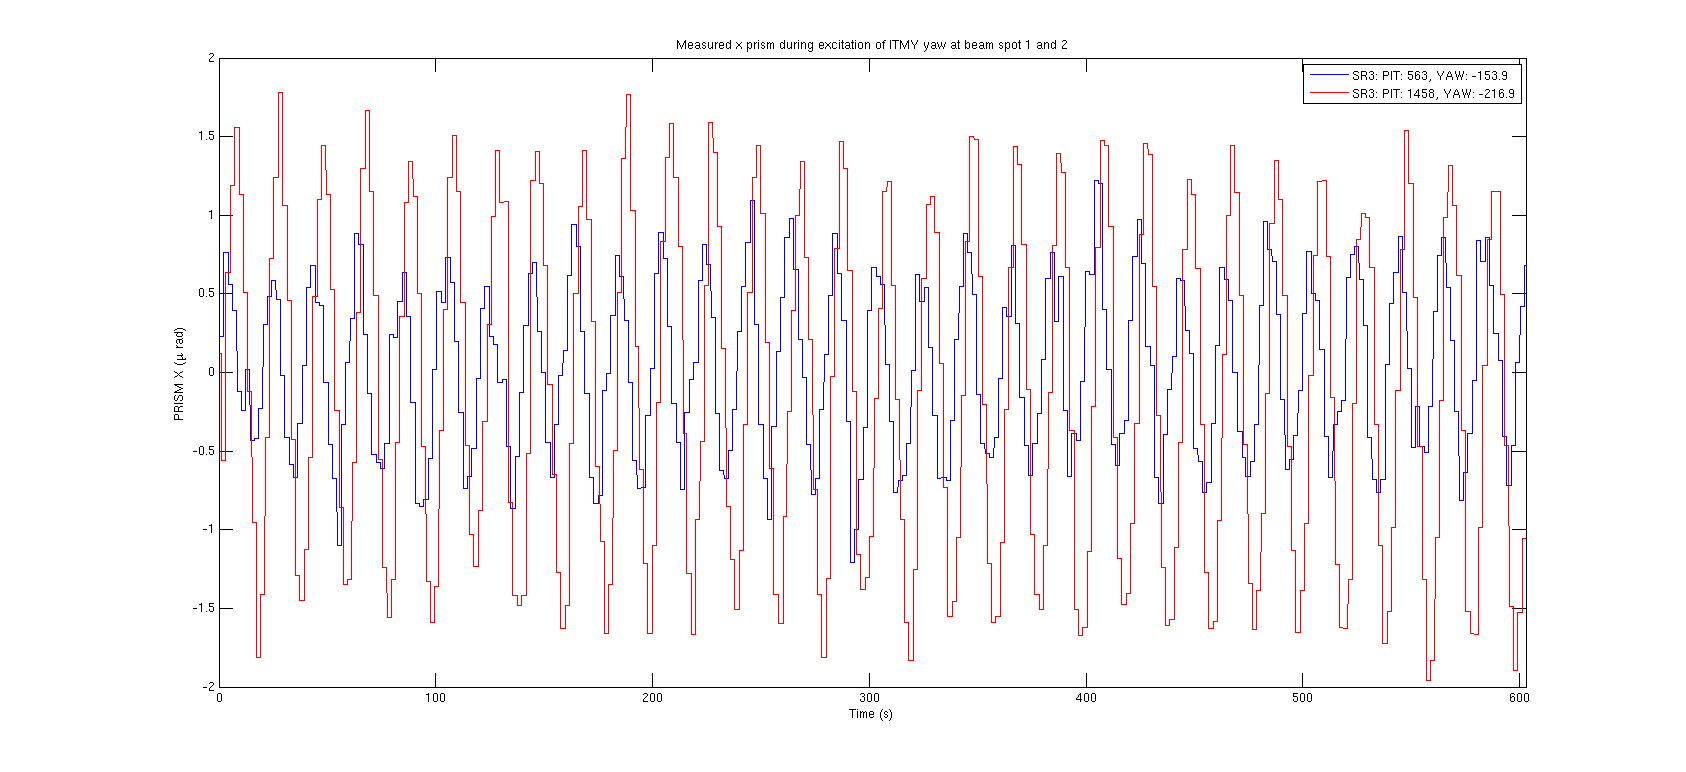
1. We turned of SR3 CAGE SERVO, and initiate excitations of PITCH and YAW of SR3. These excitations ran for about 5 hours yesterday, between 1141238996 and 1141254773 (gps time)
| Excitation | Amplitude (urad) | Frequency (mHz) |
| PITCH | 1500 | 10.3 |
| YAW | 2000 | 3.7 |
This allowed us to scan SR3 and map out all the possible reflected beams onto the HWSY from the TOTAL_PIXEL_VALUE recorded by the HWSY.

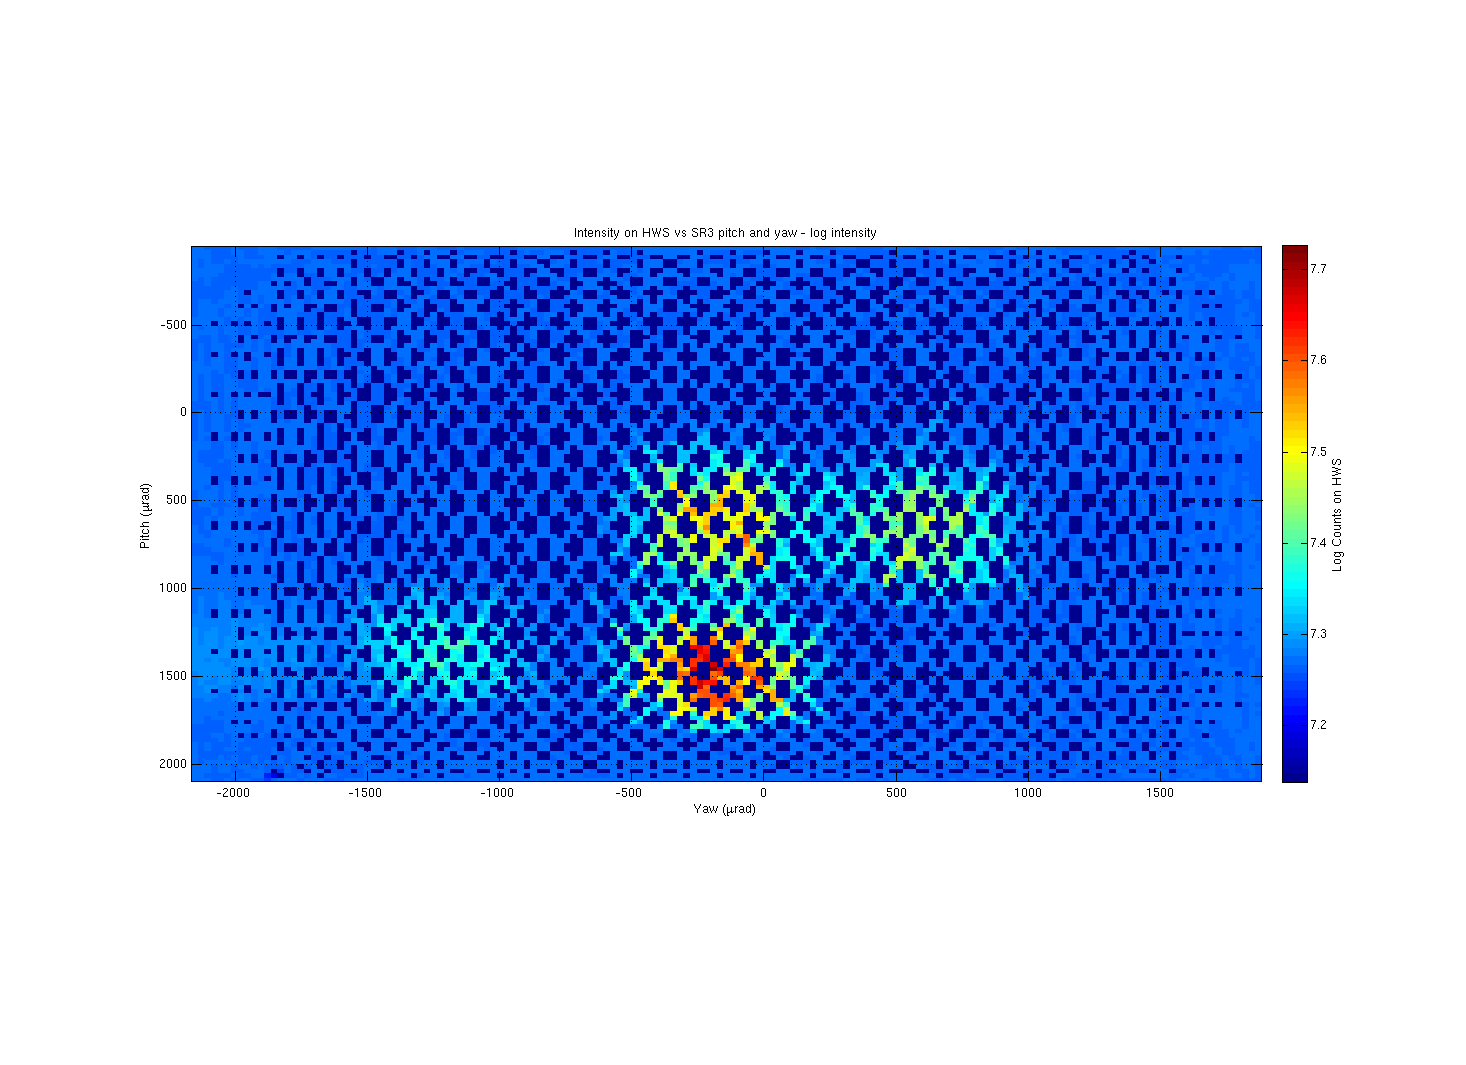
| Spot | PITCH (urad) | YAW (urad) |
| 1 | 563.4 | -153.9 |
| 2 | 1458 | -216.9 |
| 3 | 1332 | -1220 |
| 4 | 626.3 | 613.3 |
We will use the numbers to refer to each spot in the rest of this report. We are currently centered on beamspot 1
2. We modify the HWS magnification H1:TCS-ITMY_HWS_MAGNIFICATION from 17.5 to 7.5 according to T1400686
3. This morning, we moved SR3 alignment to the PITCH and YAW values corresponding to the four spots. At each spot:
- Stream the HWS images to make sure the spot was centered
-Create a new folder that does not contain reference *.mat file so the HWSY take new reference each time a new spot was centered.
-Start HWS and steam data
-Initiate 50 mHz, 2urad amplitude excitation on ITMY YAW (H1:SUS-ITMY_M0_OPTICALIGN_Y_EXC)
-Observe the changes in the three signals:
1. H1:SUS-ITMY_L3_OPLEV_YAW_OUTPUT (OPLEV Yaw)
2. H1:SUS-ITMY_M0_OPTICALIGN_Y_OUTPUT
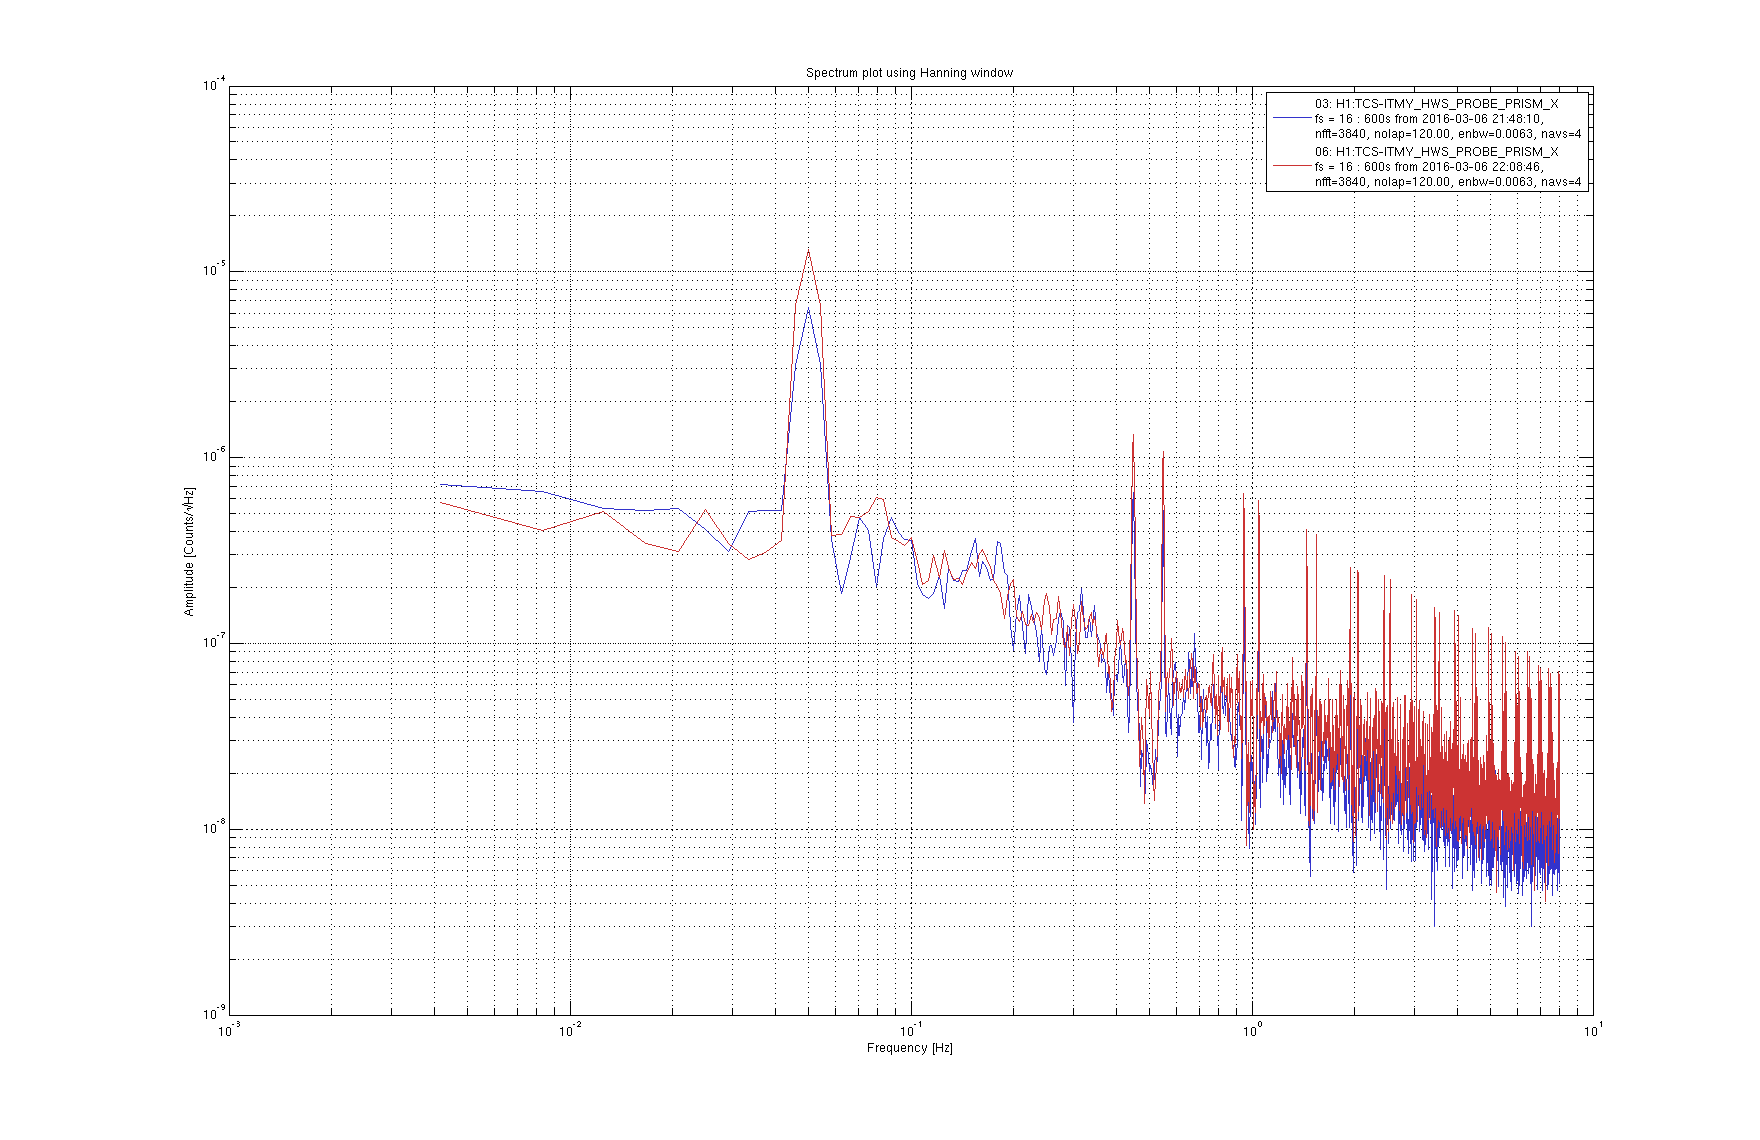
3. H1:TCS-ITMY_HWS_PROBE_PRISM_X (Prism X)
- Let the excitation run for 5-10 mins, turn off the excitation, let the OPLEV Yaw and Prism X signals to stabilize and epeat the procedure for all the spots.
4. We then plot the signals H1:TCS-ITMY_HWS_PROBE_PRISM_X and H1:SUS-ITMY_L3_OPLEV_YAW_OUTPUT and compared the magnitude of oscillation in Prism X measured (if any). The one that has the largest 50 MHz signal is the one reflected off the HR surface of ITMY.
shows the four plots of time series of H1:TCS-ITMY_HWS_PROBE_PRISM_X signal compared to H1:SUS-ITMY_L3_OPLEV_YAW_OUTPUT. From these plots:
Beam spots 3 and 4: definitely do not reflected from any surface of ITMY since there is no evidence of 50 mHz oscilliation. They may come from the CP, which fit with the fact that CP is horizontally wedged. It is also interesting to note that the Prism X values for these two beams decrease contiously during measurement.
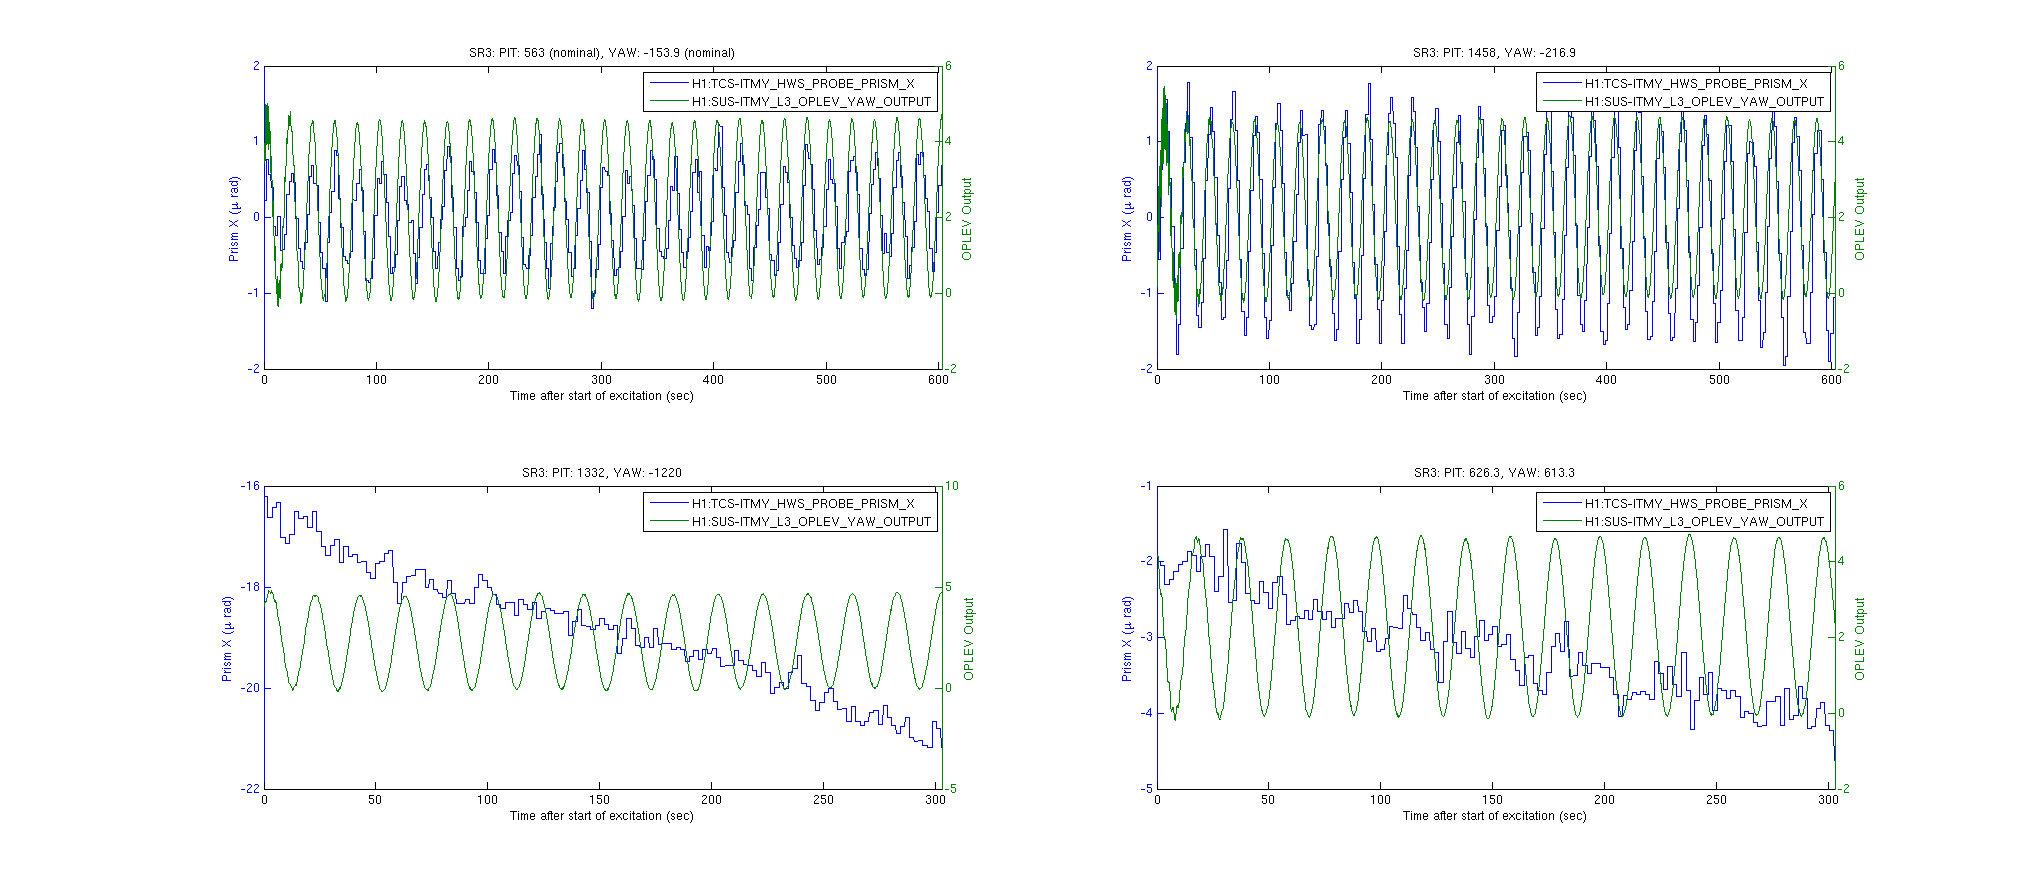
Beam spots 1 and 2: these two beams come from the 2 surfaces of ITMY.
The oscillation in X prism measured for beamspot 1 has an amplitude of approximately 0.6±0.2 urad
The oscillation in X prism measured for beamspot 2 has an amplitude of approximately 1.5±0.2 urad
Therefore, the magnitude of oscillation in x prism for beamspot 2 is greater. This can be clearly seen if the two time series are plotted together:

I remember that the clipping we saw was by the first steering mirror in the HAM4 chamber. I could see a bright scattering from the view port with an IR viewer.
We reproduced the clipping today on Mar 9th. We confirmed that the clipping occurred at the first in-vac lens (see HAM4 drawing), not the steering mirrors.

