patrick.thomas@LIGO.ORG - posted 18:19, Wednesday 20 April 2016 (26705)
Sitemap VE menu updated
I put back the links to the old screens and added links to the new Beckhoff screens.
I put back the links to the old screens and added links to the new Beckhoff screens.
I have updated the control room alarm handler configuration file to match the move to Beckhfoff controls at MX and MR. The alarm handler has been restarted to use it.

The configuration file is '/opt/rtcds/userapps/release/cds/h1/alarmfiles/ve.alhConfig'. It is in svn at 'cds_user_apps/trunk/cds/h1/alarmfiles/ve.alhConfig'.
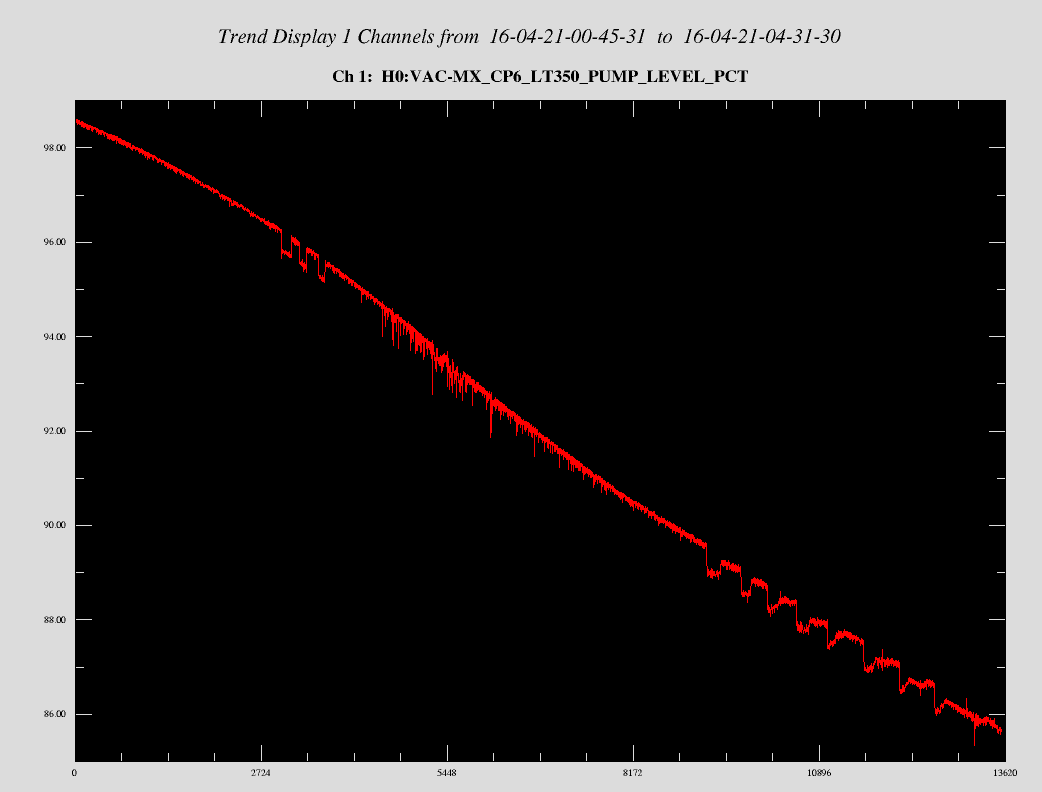
After 15 hrs, CP6 finally registers a real value on the liquid level read back. Currently at 98.5%. I opened the Dewar valve and set the LLCV to 55% (normally runs between 60-65%). I'll be here for a while working on CAD drawings so I'll monitor it.
Today I modified CDS to use the new Beckhoff MR vacuum controls channel names. I verifed that my procedures for this are correct. Procedures are in the wiki page:
https://lhocds.ligo-wa.caltech.edu/wiki/MigratingVacuumControlsCdsFromVmeToBeckhoff
Today I upgraded the DAQ for the new Mechanical Room (MR) vacuum controls upgrade. The current active raw minute trend files were copied on h1tw1, the channel names were changed in the H0EDCU_VE.ini file (there are no FMCS channels on this system) and the DAQ was restarted.
Later I renamed all the archive raw minutre trend files on both h1fw0 and h1fw1 and verified using dataviewer and one channel from MX and MR that trends back 300 days could be obtained.
CP6 is still reading 100% + full with no LN2 flow for ~14 hours. We have decided to wait it out and see if the liquid level drops tomorrow before opening valves to allow LN2 flow into system.

FYI:  the bypass LLCV is no longer frozen and moves freely and is closed.
TITLE: 04/20 Day Shift: 15:00-23:00 UTC (08:00-16:00 PST), all times posted in UTC
STATE of H1: Planned Engineering
INCOMING OPERATOR: Nutsinee
SHIFT SUMMARY: In the morning the commissioners started some green alignment and then the PSL blew a water hose. PSL crew wants to leave it to dry overnight. Other various maintenance tasks throughout the day.
LOG:
1455 - 1520 hrs local -> To and from Y-mid

Exhaust check-valve bypass opened, LLCV bypass valve opened 1/2 turn -> LN2 at exhaust in 55 seconds -> Restored valves to as found state.

Next CP3 Over-fill to be in < 72 hours.
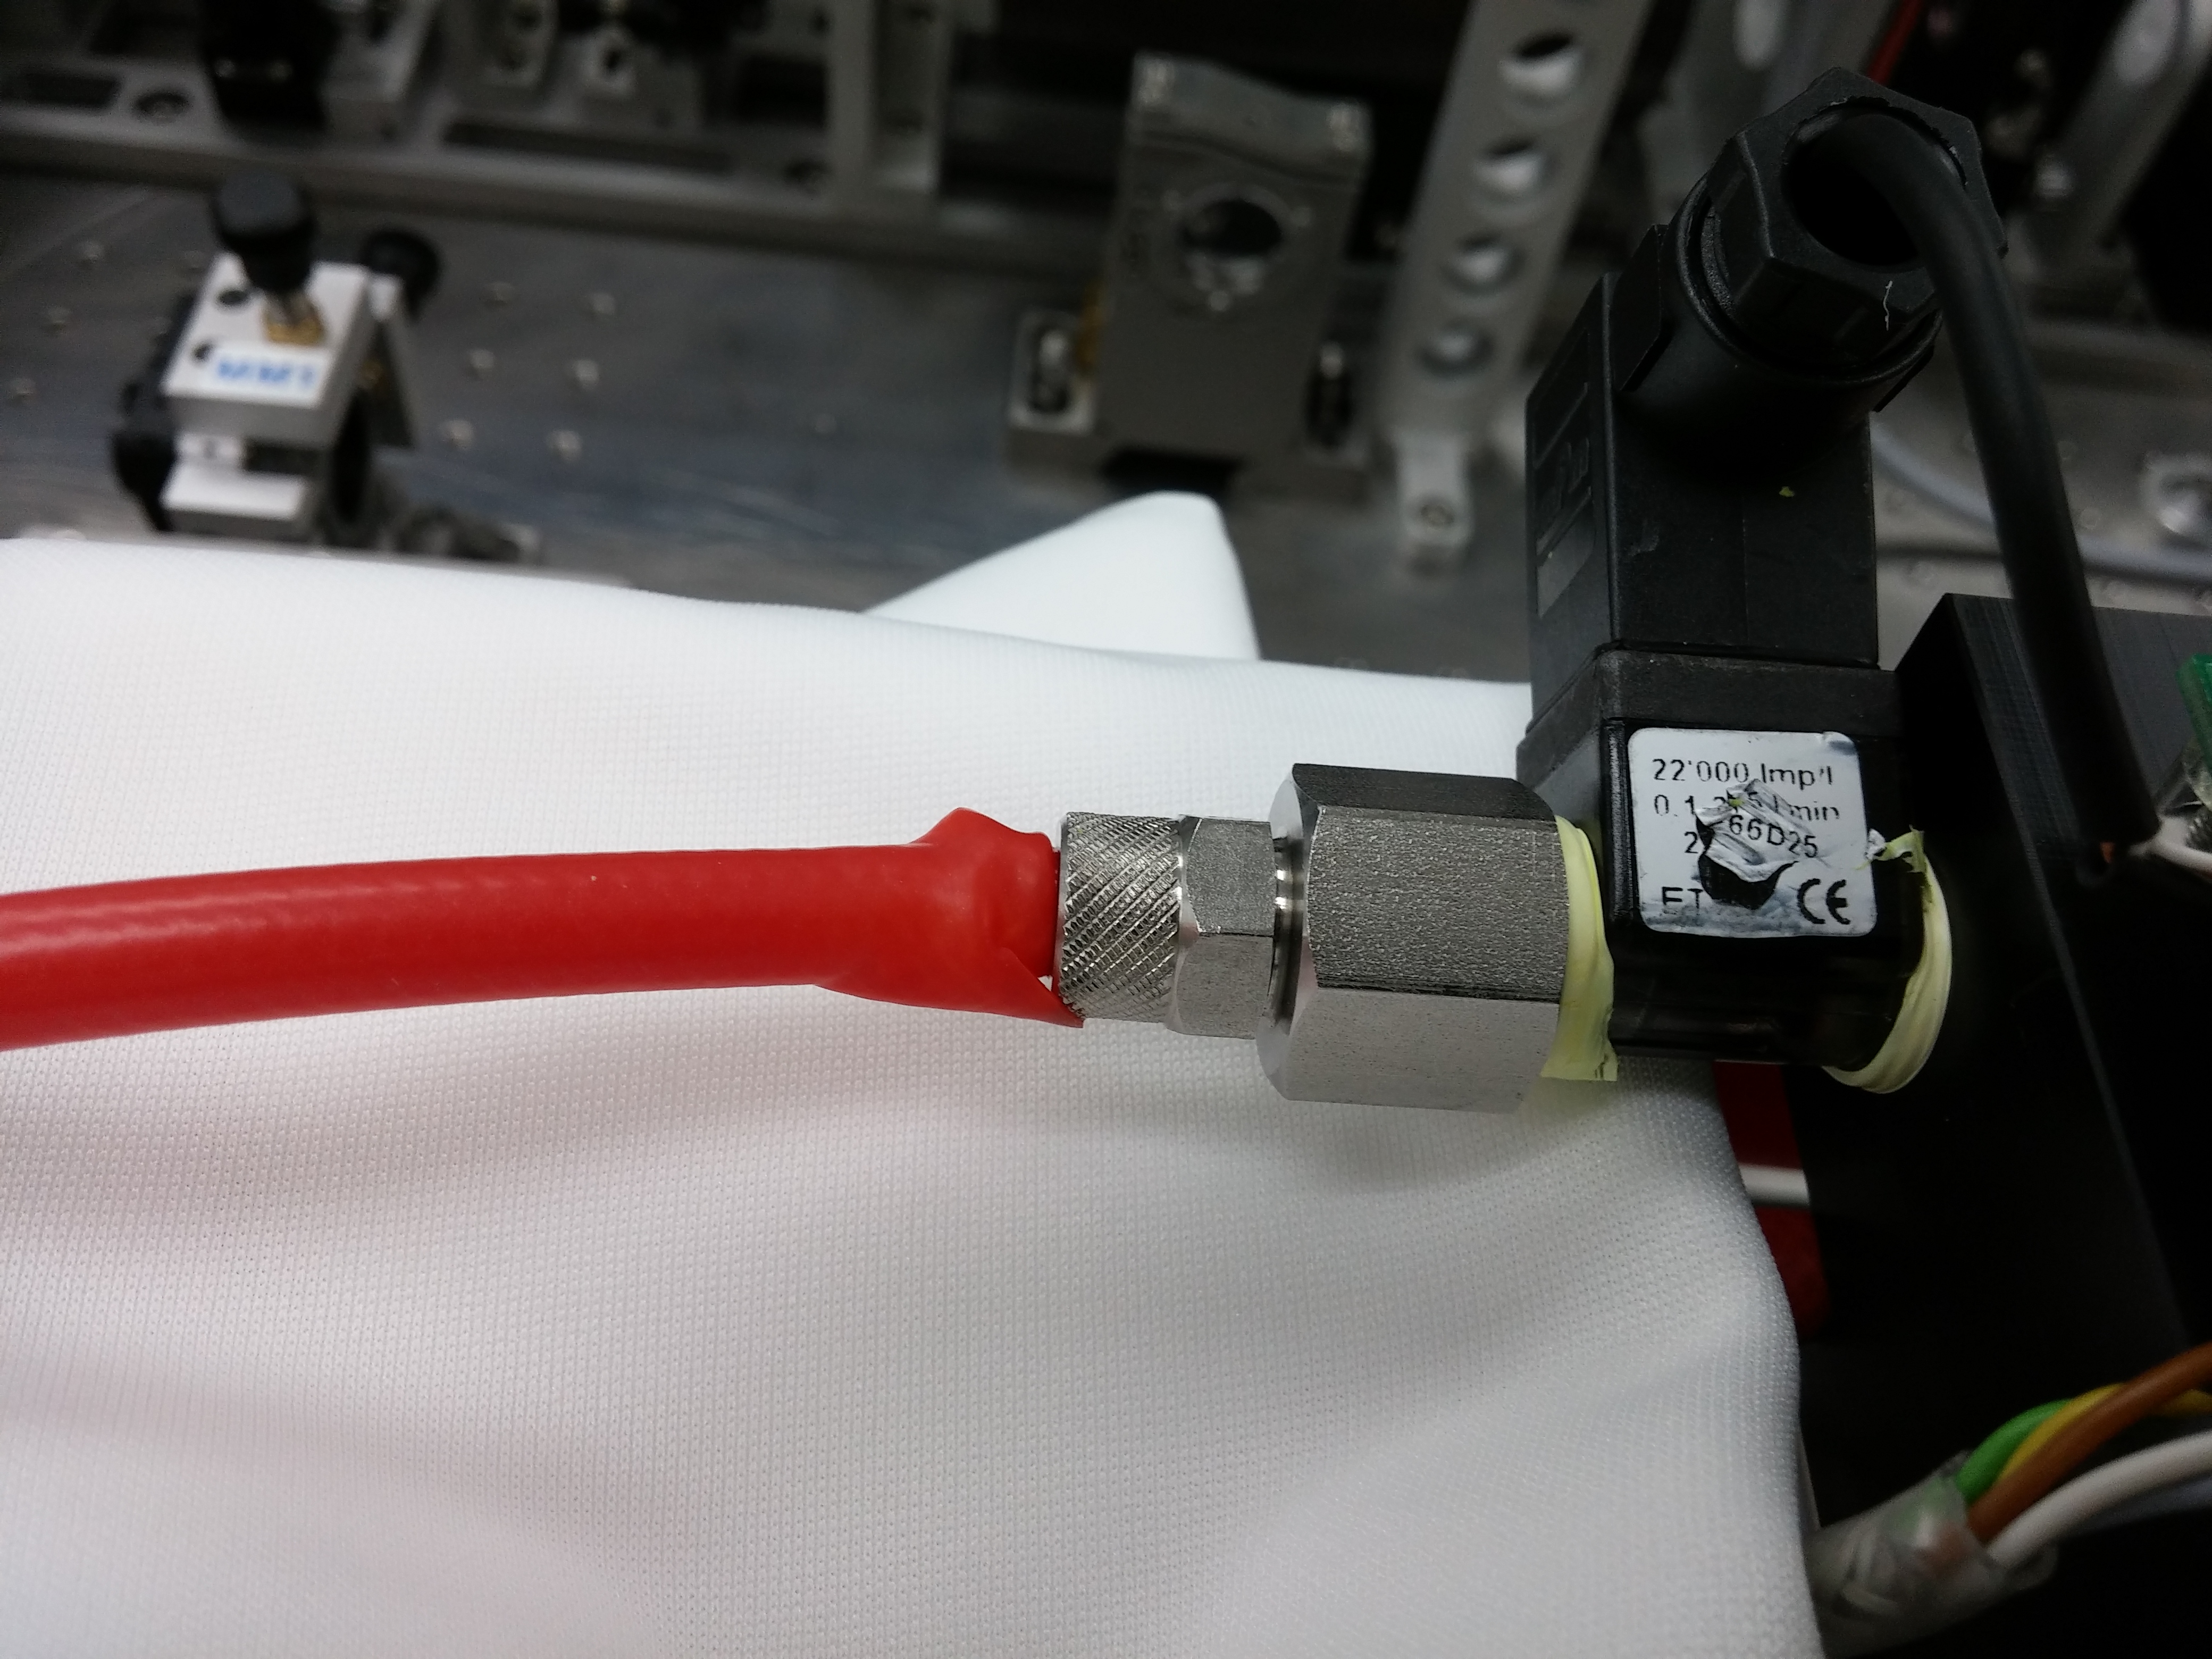
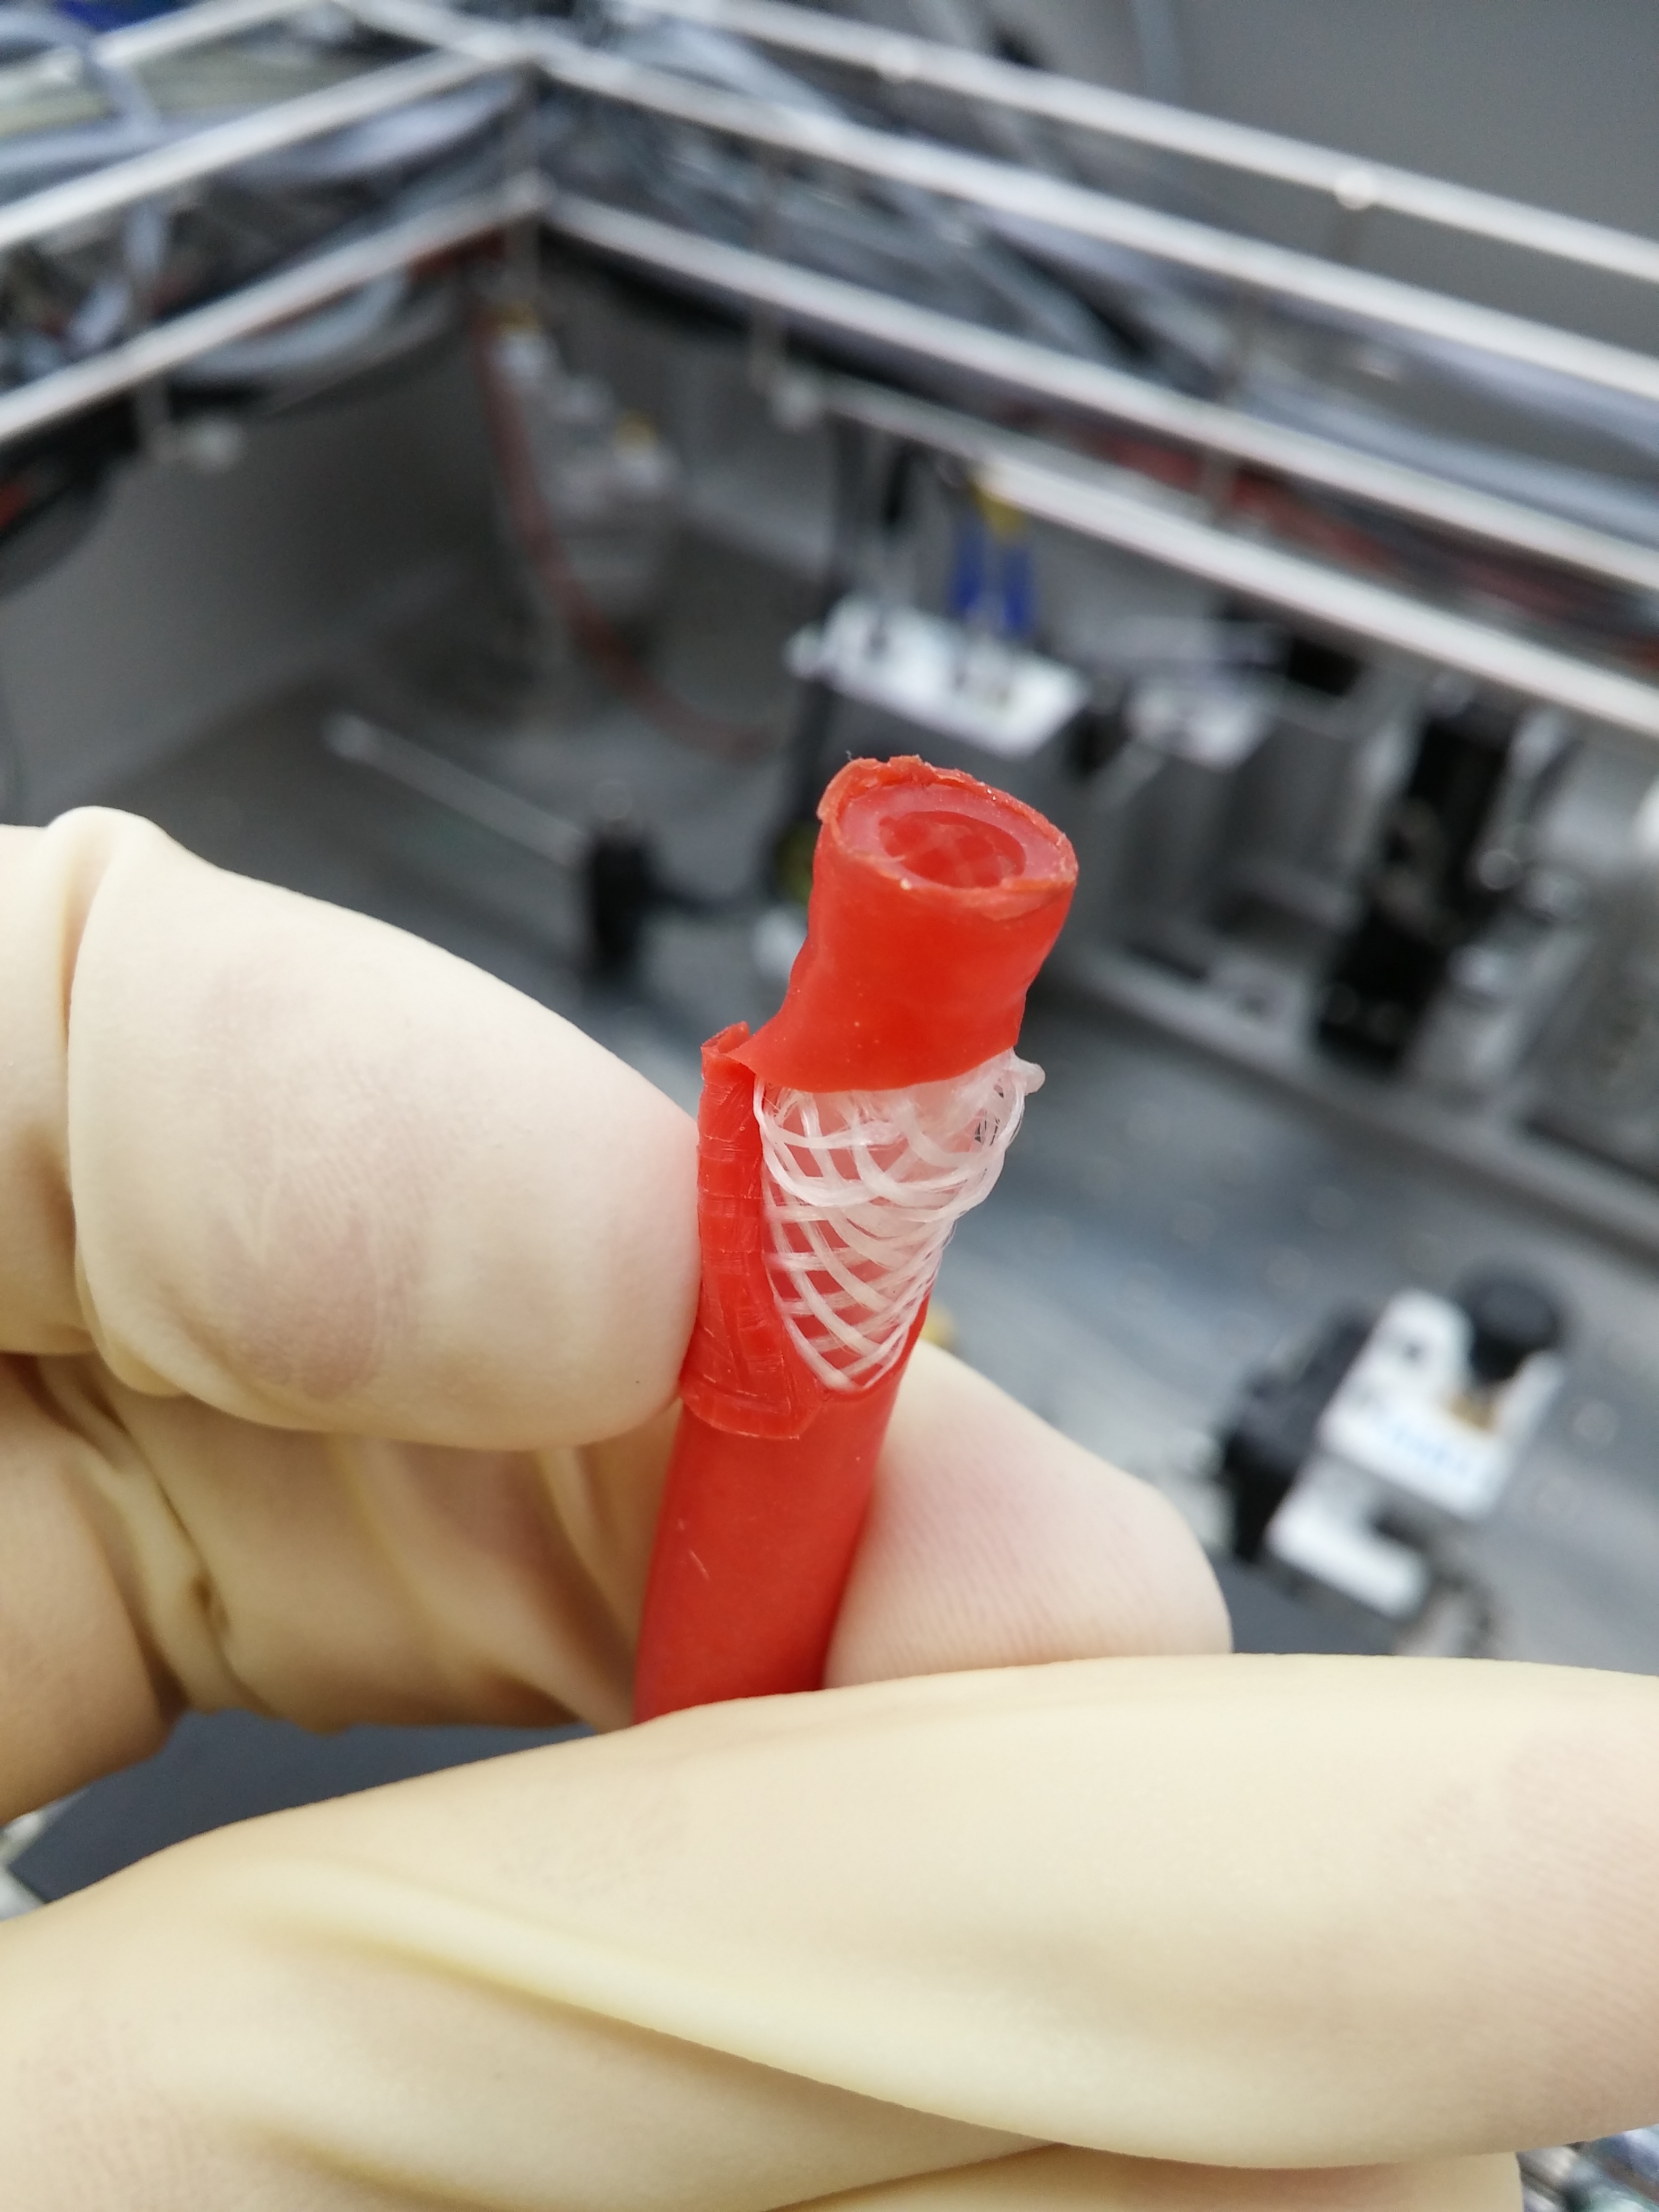
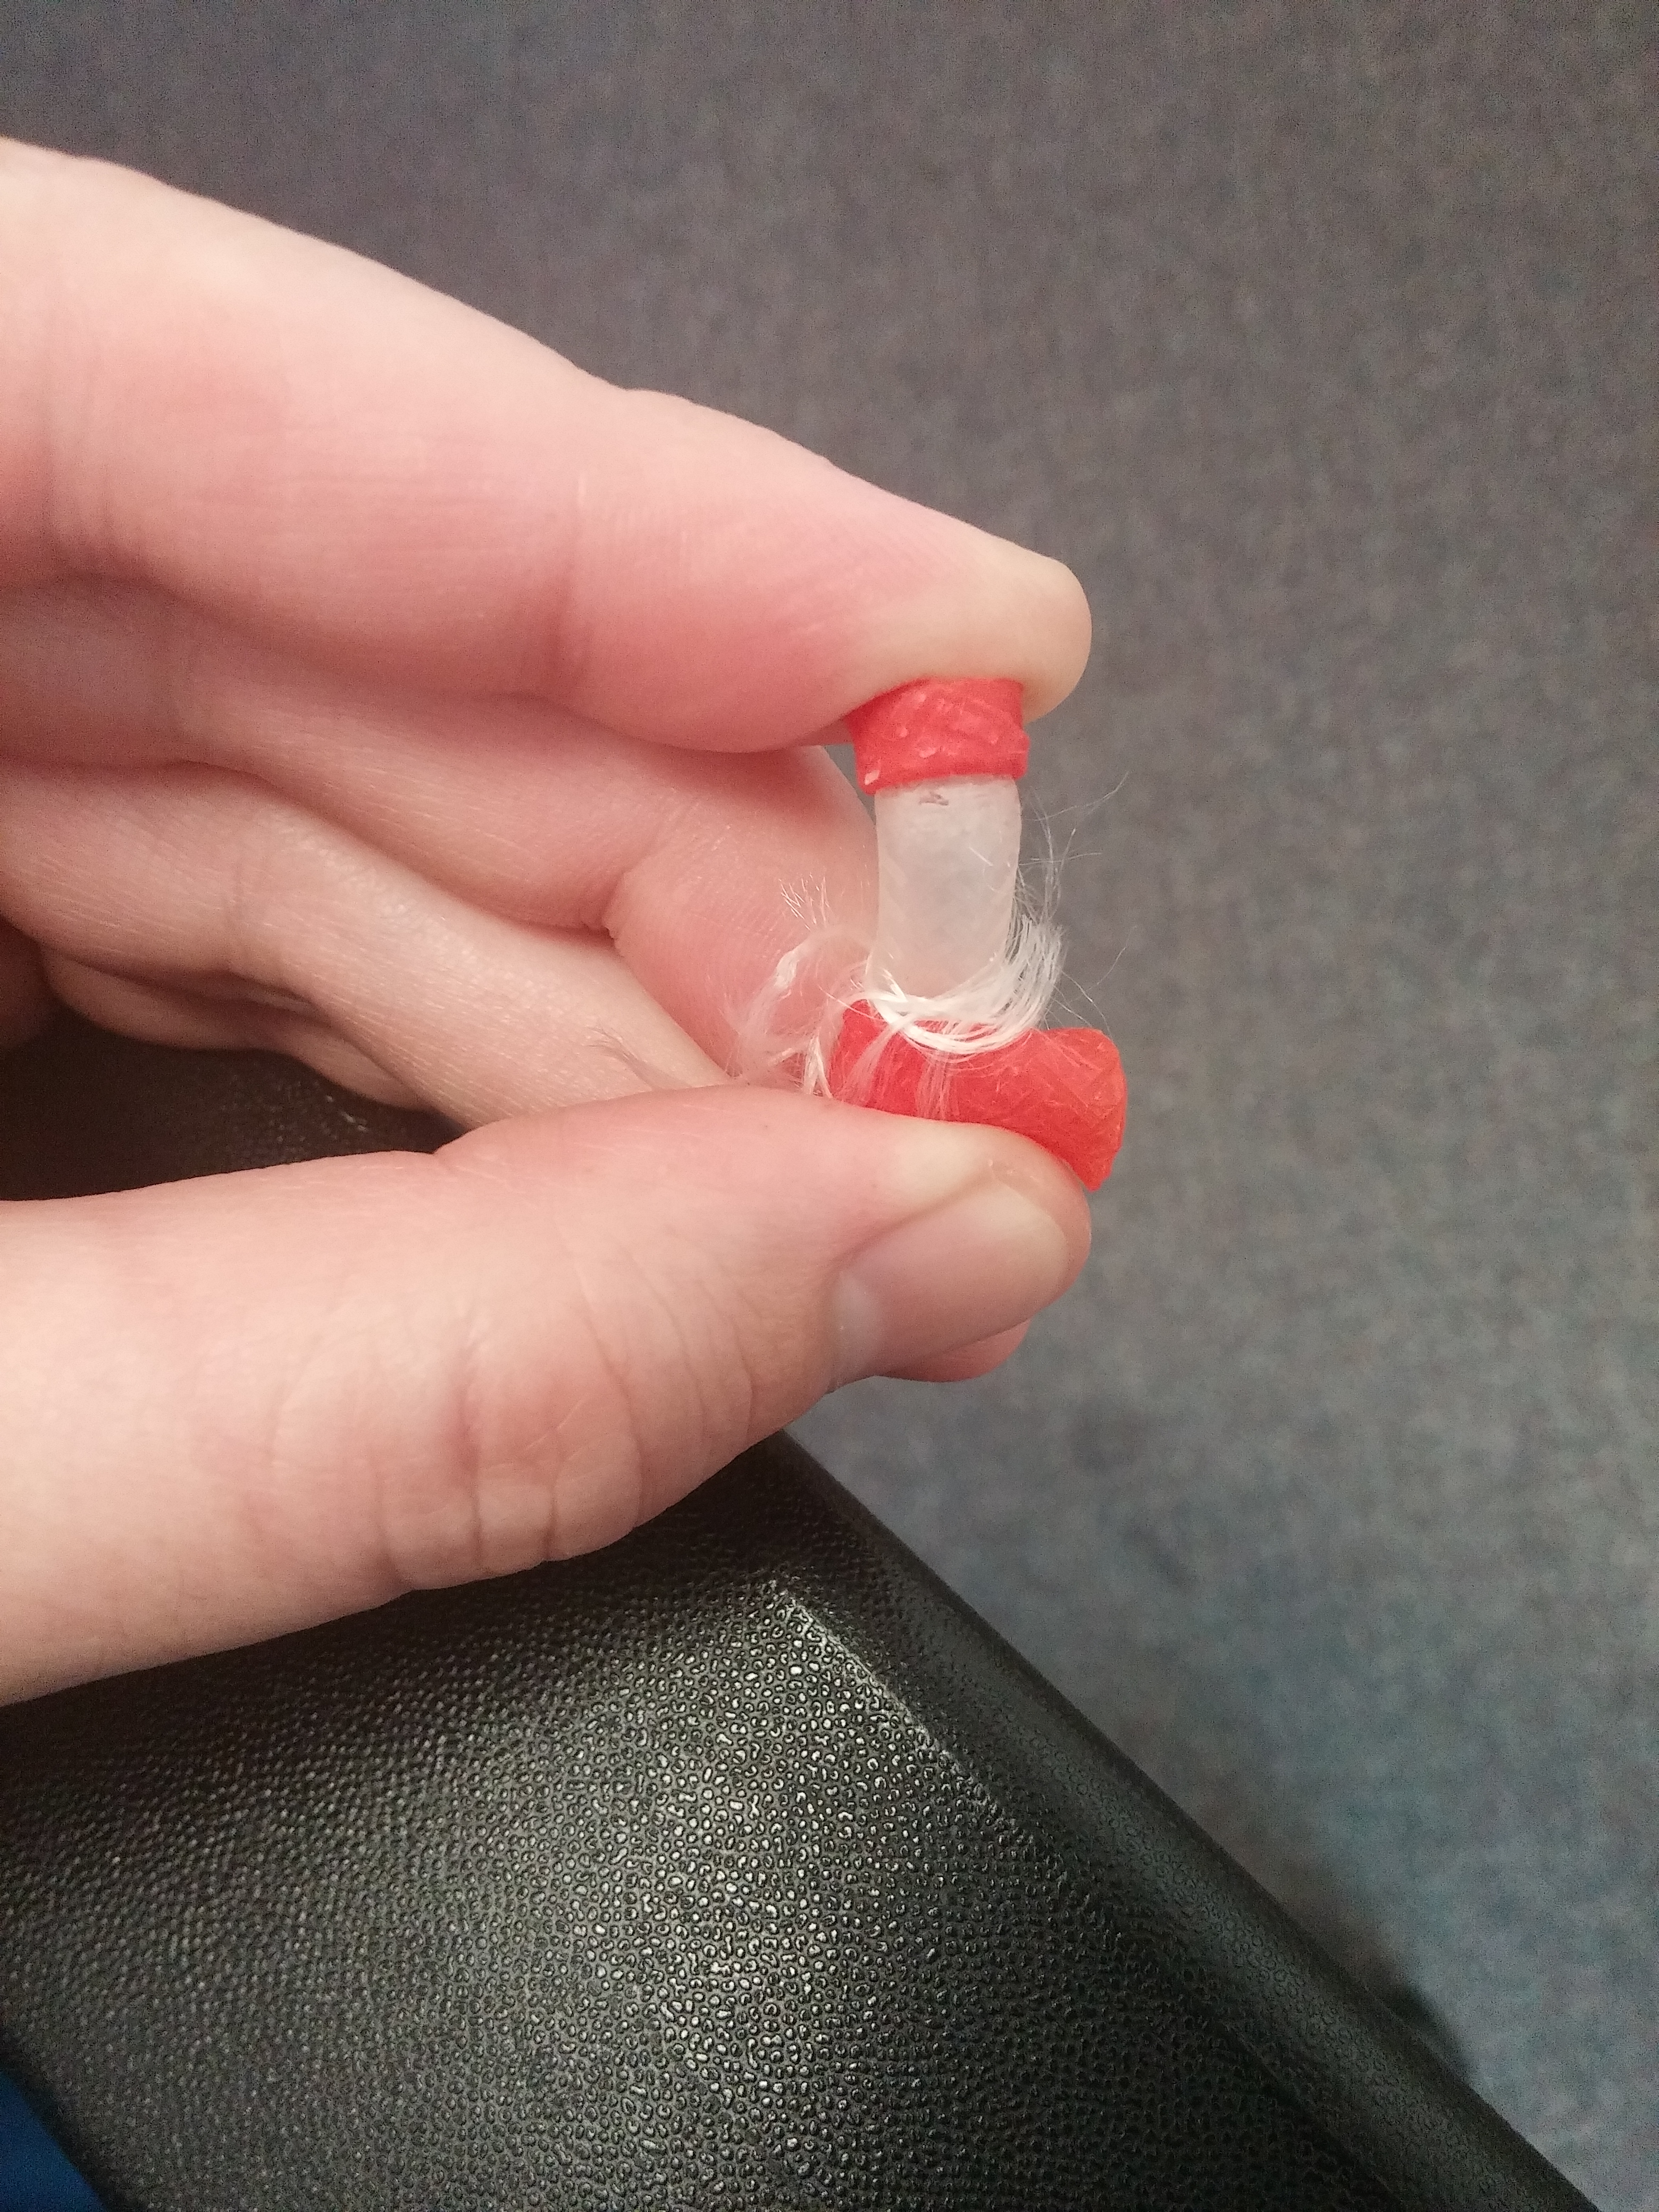
Jeff B. informed us this morning that he had to add 400mL of water to the PSL crystal chiller, while last night it was fine. Doing a humdity trend of the HPO box showed a sharp spike, indicating a possible water leak. We immediately shut down the laser and chillers and went out to investigate. Upon opening the HPO box we saw water covering the floor of the box and dripping out of the connection from the head 1 ASE dump to the head 1 flow meter (Hose_as_found_20160420.jpg); the hose had failed, causing a major water leak (in the picture you can see where the red covering ripped away due to the water pressure). We mopped up all the water we could, drained the laser head water circuit, and removed the failed hose connection (Hose_failure_closeup_20160420.jpg). Luckily the hose was long enough that all we had to do was cut off the failed portion and reattach the hose. I took the failed section and removed the red outer covering and found a small hole in the silicon in what looks to be the area where the hose seals on the fitting (Hose_failure_point_20160420.jpg). I think that the repeated loosening and tightening of this connection we have had to do over the last week, probably combined with the age of the hose, weakened the hose at this point causing its eventual failure.
We performed a preliminary inspection of the optics and it appears we may have lucked out; no water is visible on the surface of any of the optics in the HPO box. We are currently letting the HEPA fans and the AC run for a copule hours to dry the HPO box out completely, and will then do a more thorough inspection of the optic surfaces of the HPO.
Filed FRS 5318.
Went in after lunch and inspected the optic surfaces with a green flashlight. Everything looked good, no water spots. Started up the chiller and after several minutes did not observe a water leak. The inside of the HPO box is still wet, so we are leaving the fans and AC running overnight to continue to dry it out. While this is happening the laser is being left OFF. We will go in and assess everything in the morning, and bring the laser back up if all is in good health.
I think Jason meant "assess".
Good catch, thanks Peter. Fixed.
A BSC-ISI model update about a month ago changed the St1-2 feedforward and sensor correction infrastructure. Before, there were independent feedforward and sensor correction paths, each receiving both L4C and T240 signals, meaning each sensor was getting sent twice. Now, there is a single path that gets shared to both the St1-2 feed forward and sensor correction banks, which means if we want to do both sensor correction and feedforward, we need a blend filter. For now, I've cannibalized the Quite_90 filters to do this, but it's likely this will need some more thought.
What I've done for now is taken the Quite_90 high pass (the L4C component) and used the relationship (low_pass) + (high_pass) =1 to design a complementary low pass filter. I started by taking the Quite_90 high pass and multiplying it by the L4C response to get it in a complementary form. In addition, the blend filters do the integration of the seismometer signals, which I don't need, so I had to multiply the high pass by a zero at 0 to convert it from (nm)/(nm/s) to (nm/s)/(nm/s). The complementary low pass is then just 1 - (high pass).
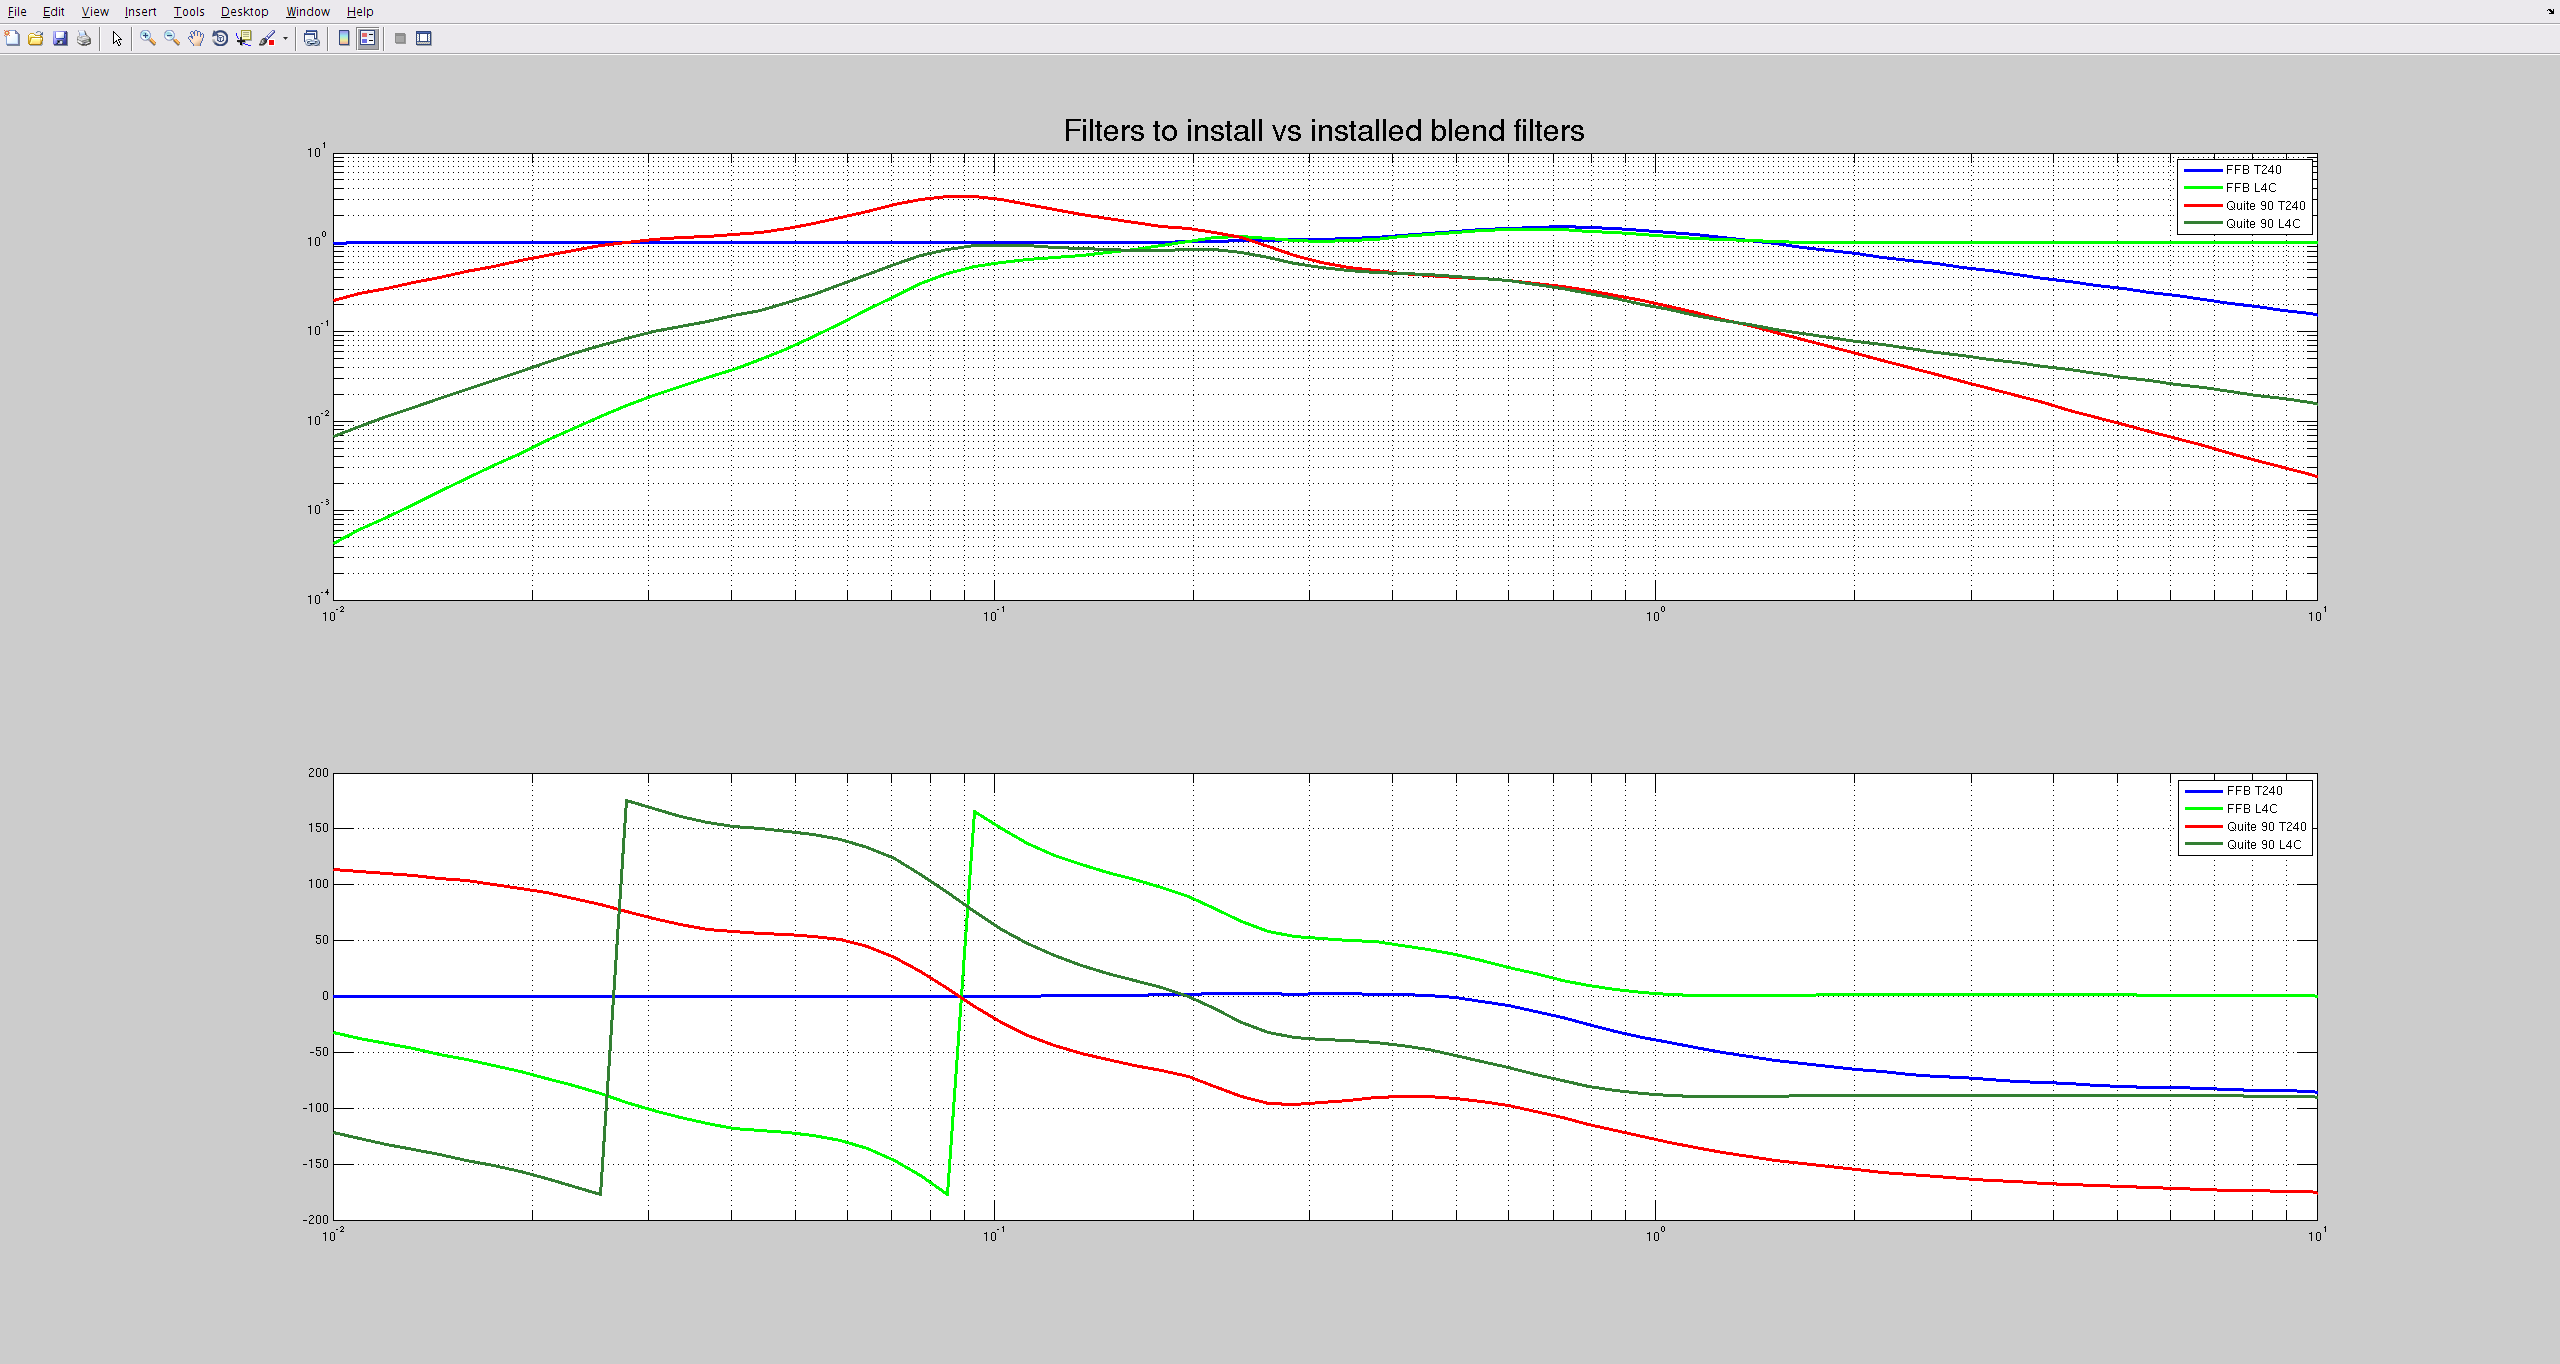
My first plot compares the resulting filters with the originals, where green (FFB L4C) and blue (FFB T240) are the Feedfoward blend filters and brown (Quite 90 L4C) and red (Quite 90 T240) are the St1 blend filters.
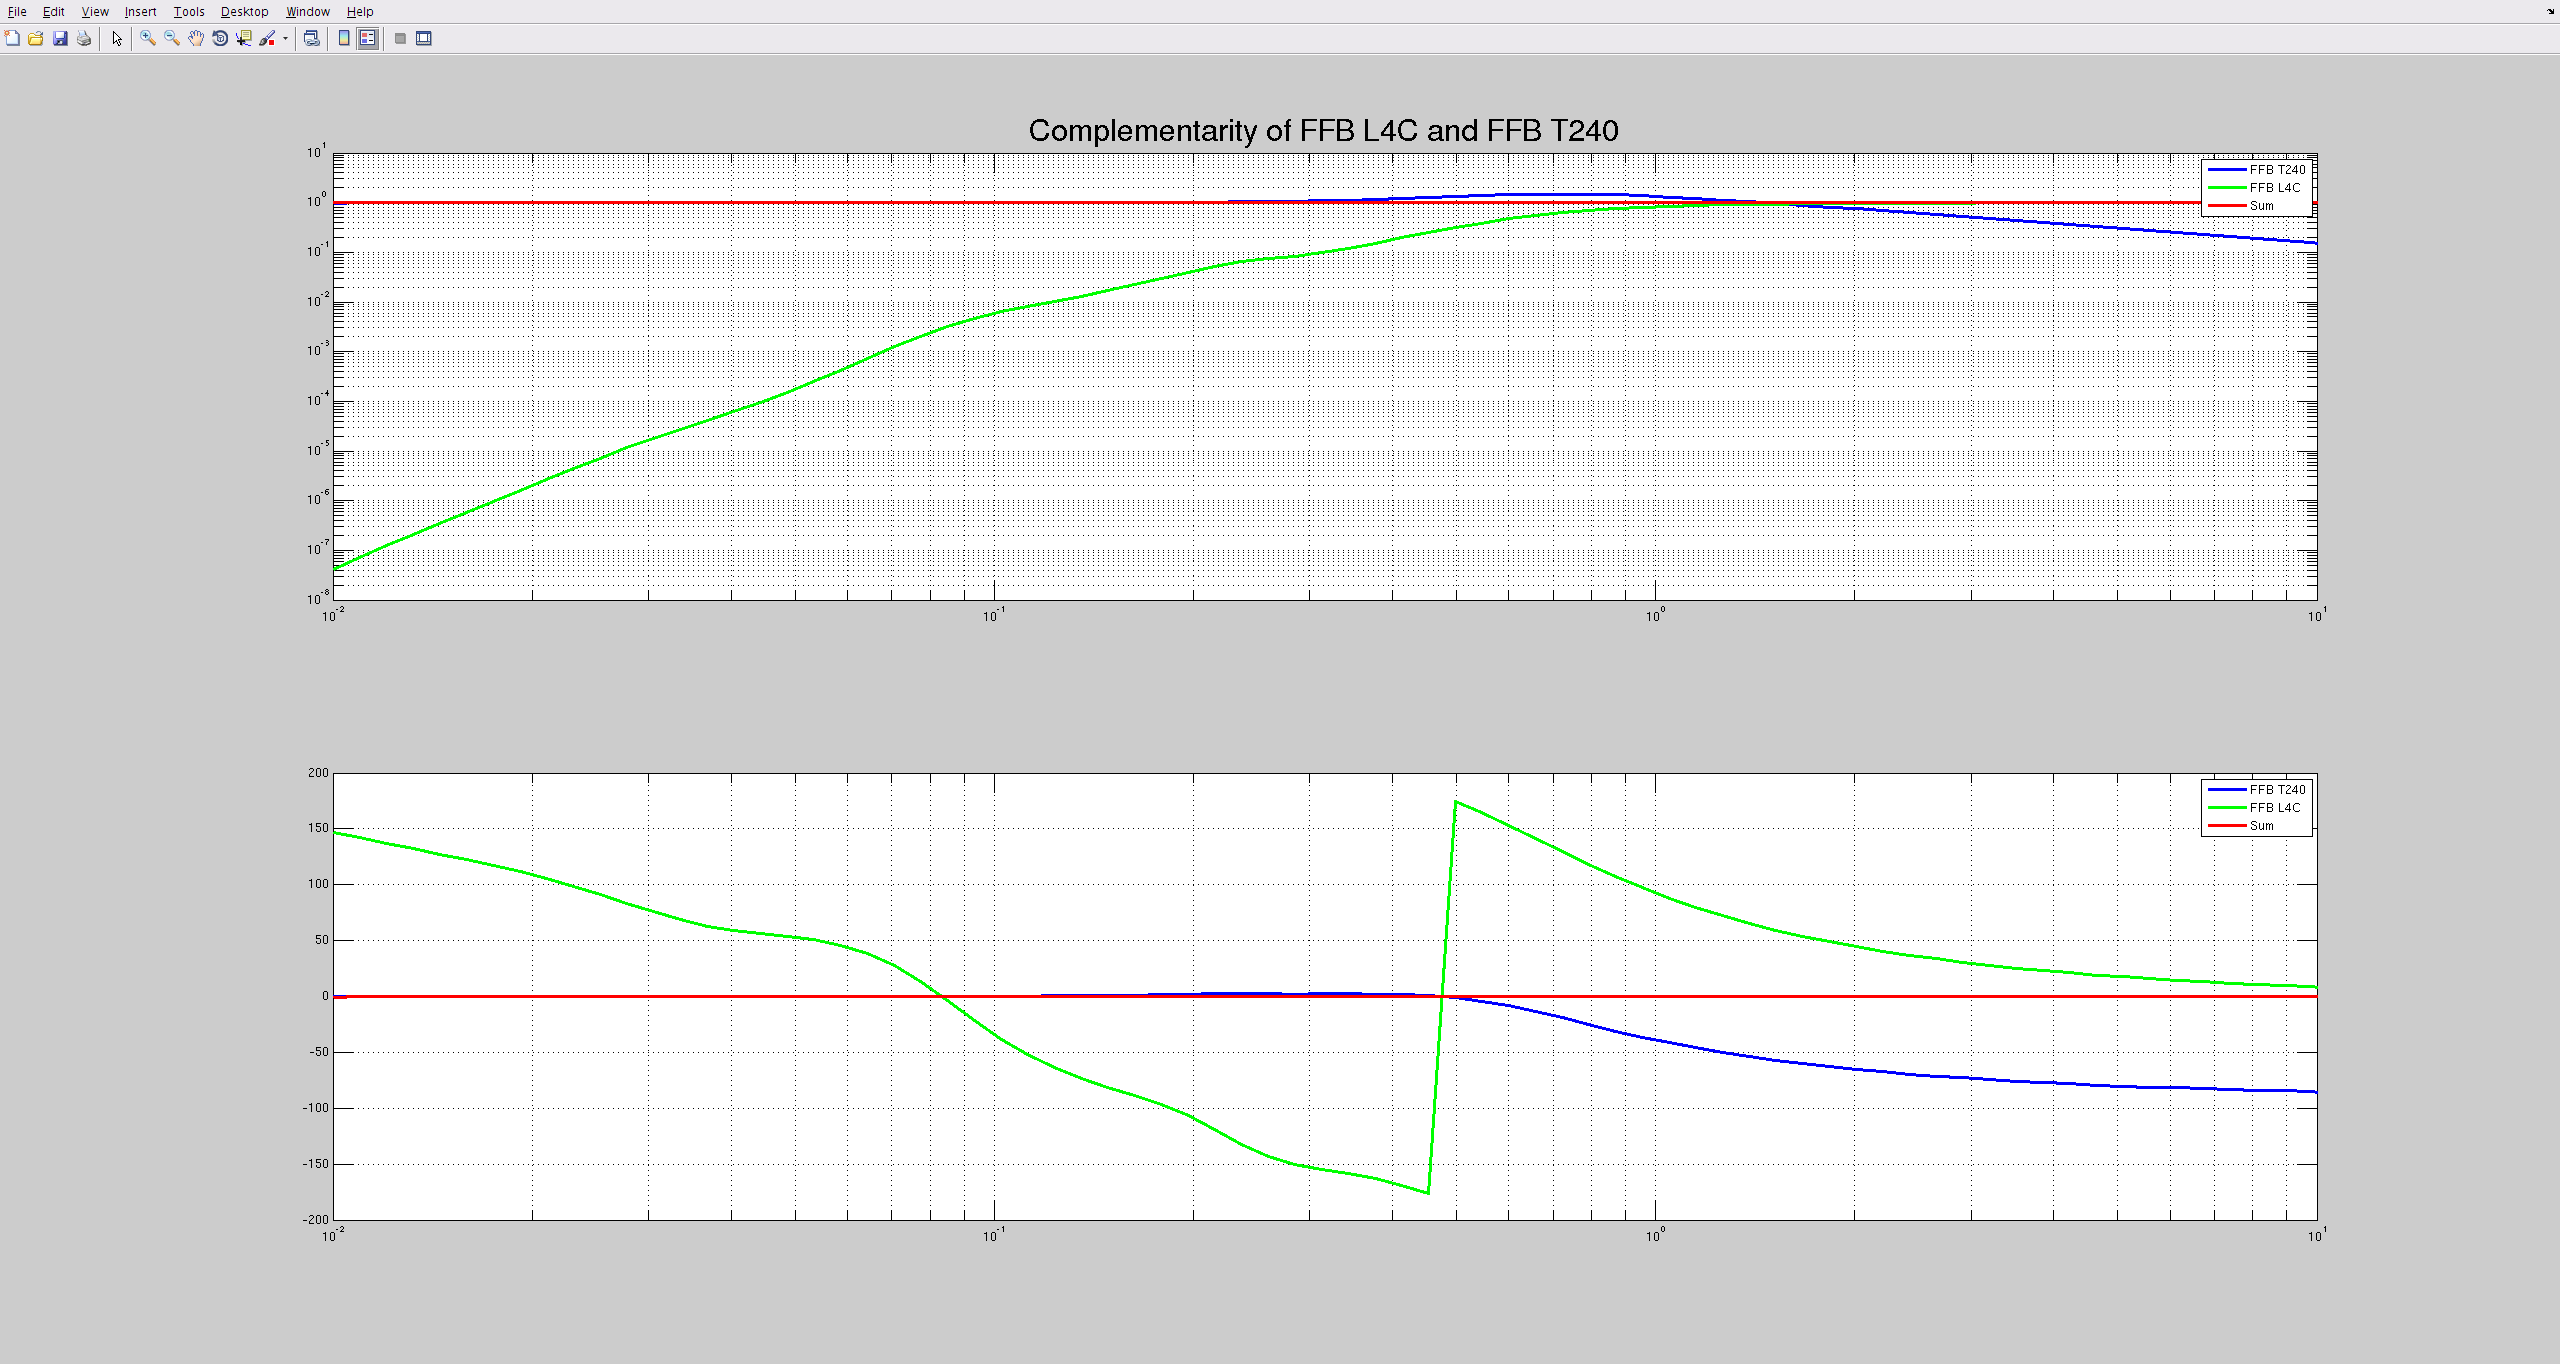
The second plot shows the complementarity of the FFB filters, showing that (low_pass) + (high_pass) =1. The final high pass then needed the L4C inversion added back in, to account for the L4C's frequency response.
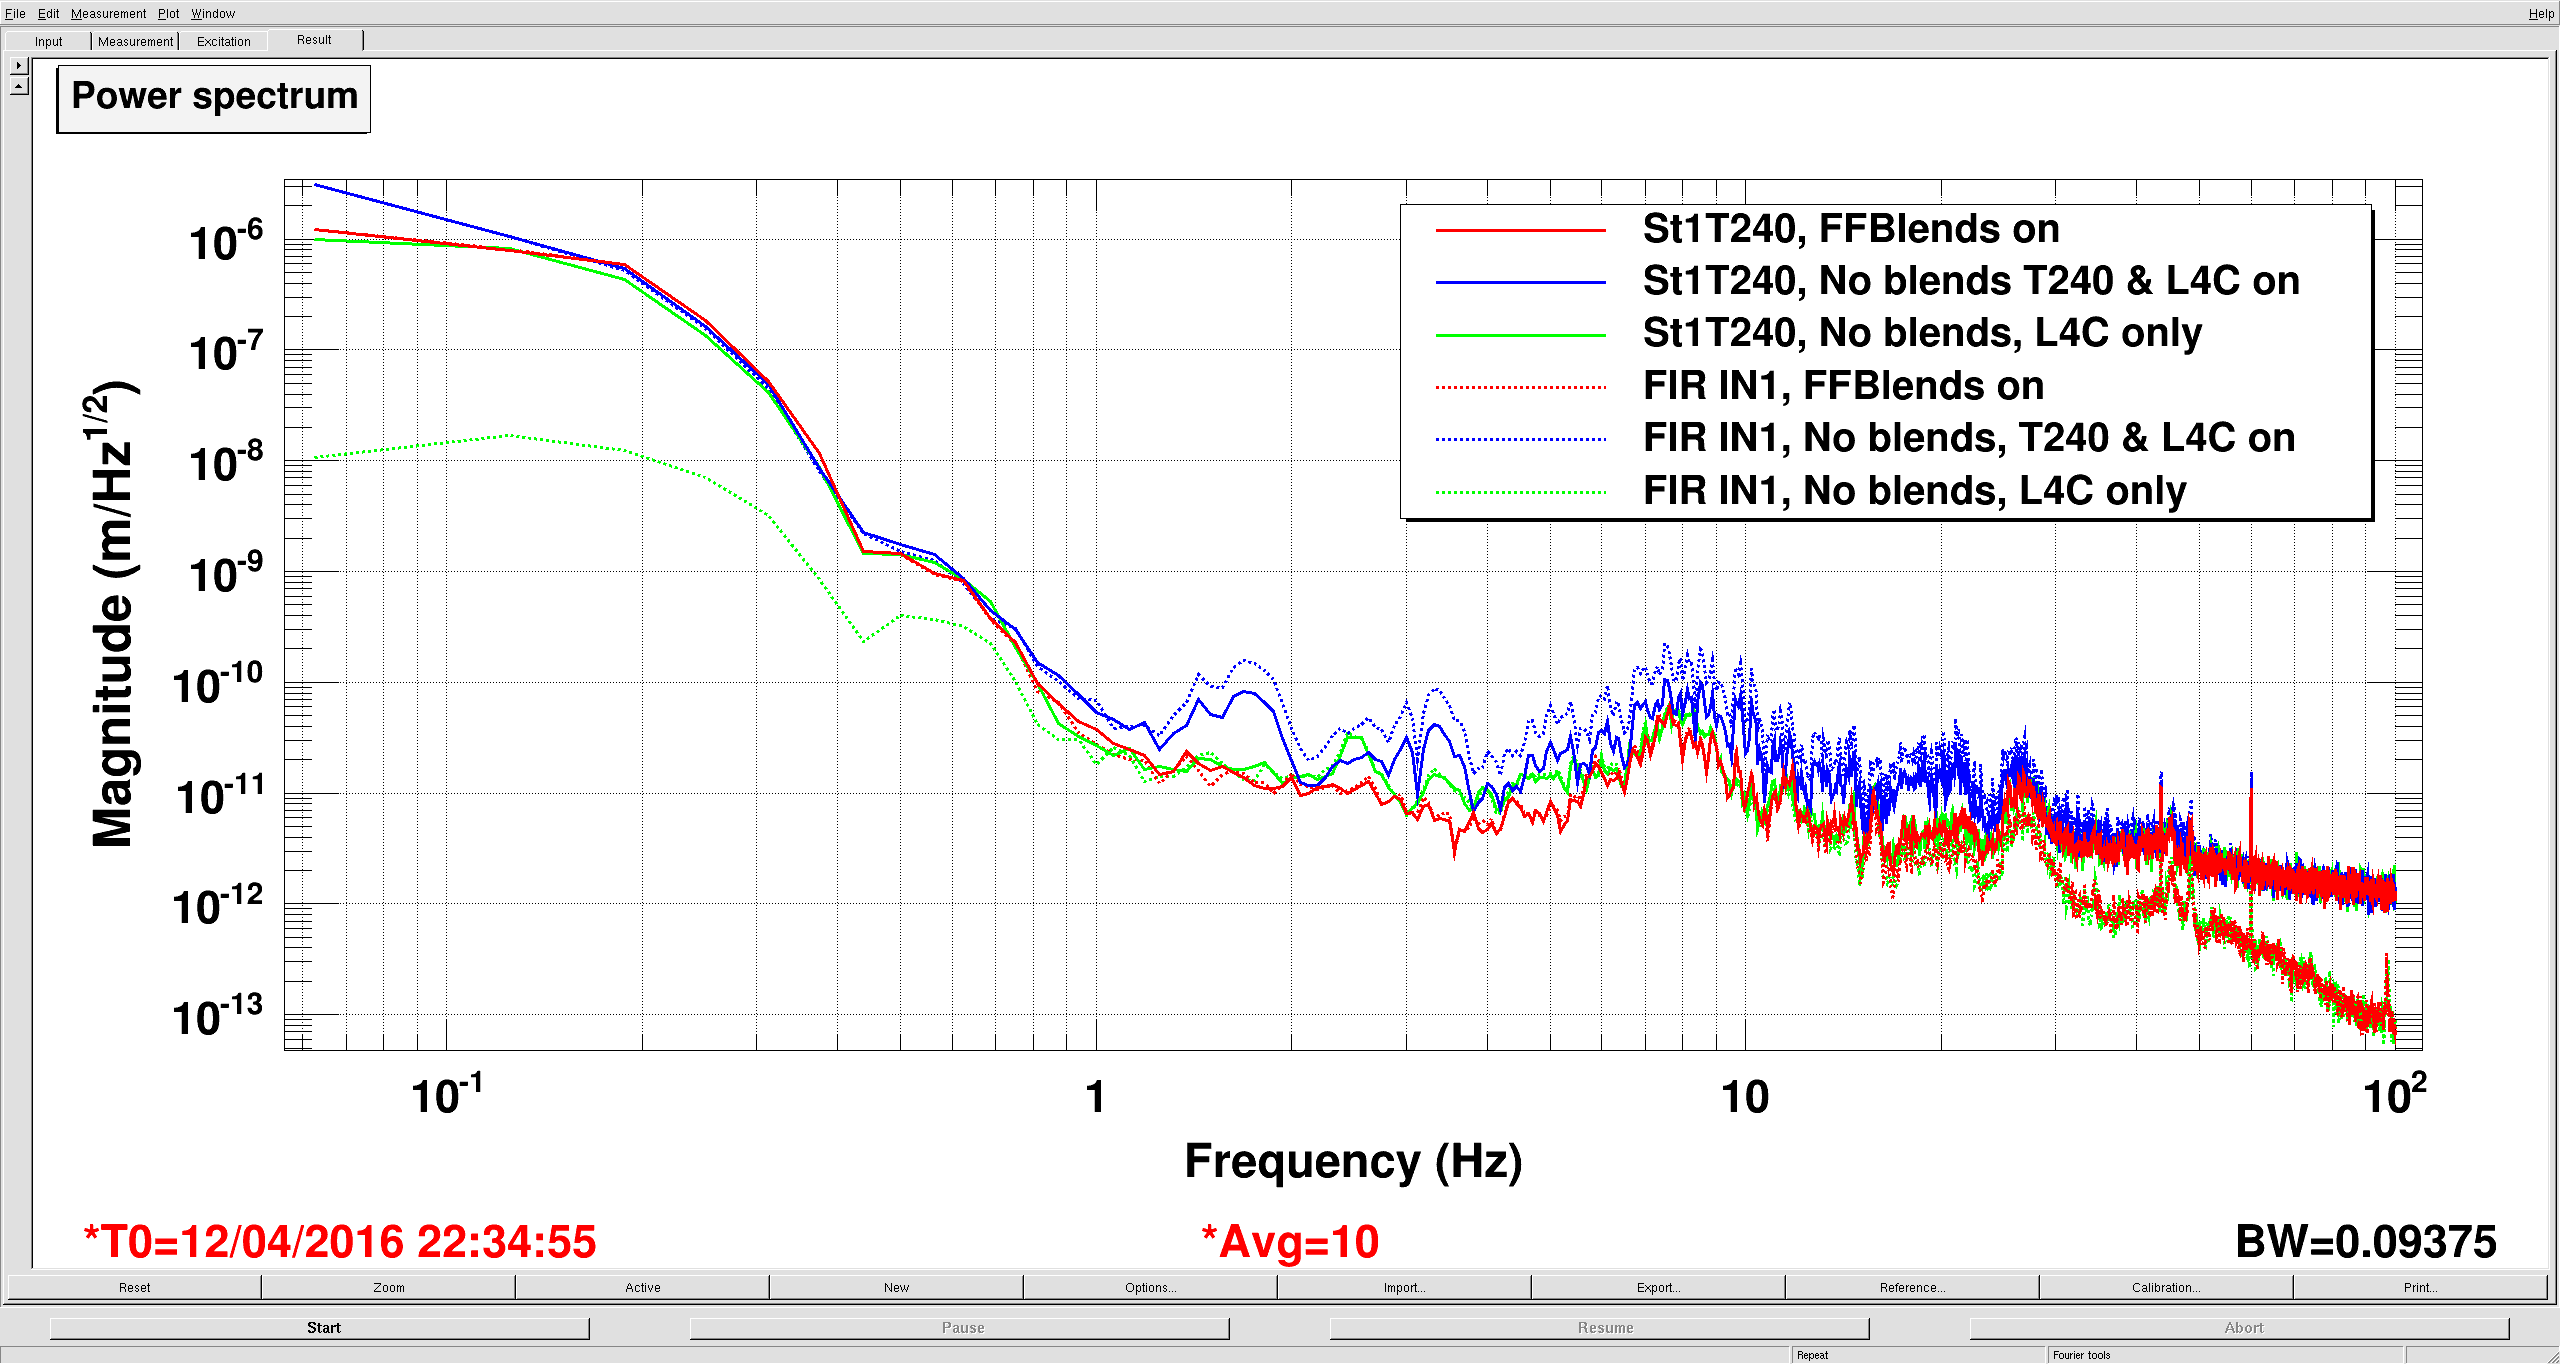
The third plot shows how accurately the blend filters sum the two signals. To check, I looked at the St1 T240 signal (solid lines), and compared that to ST2 FIR IN (dashed), which gets the output of the blend banks. For this measurement, I turned off all feedforward and sensor correction to ST2.
-The red traces are with the FFB blends turned on, so the dashed red line is the blended sum of the L4C and T240 signal. Seems pretty good.
-The blue line is with the FFB blends turned off, but the inputs and outputs turned on, so the dashed blue is just the sum of the L4C and T240 signals. Compare this to the solid blue, you can see this is clearly wrong above a hz. Below a hz the L4C acts like it's own high pass, so it doesn't contribute much here, as you'll see soon.
-The green traces are with the L4C alone. Remember, the solid line is the T240, but in this case, the dashed line is just the L4C. The response below 1 hz is low, because this motion is below the L4C's resonance, so the L4C is less sensitive to motion at these frequencies. This is why blends invert sensor responses.
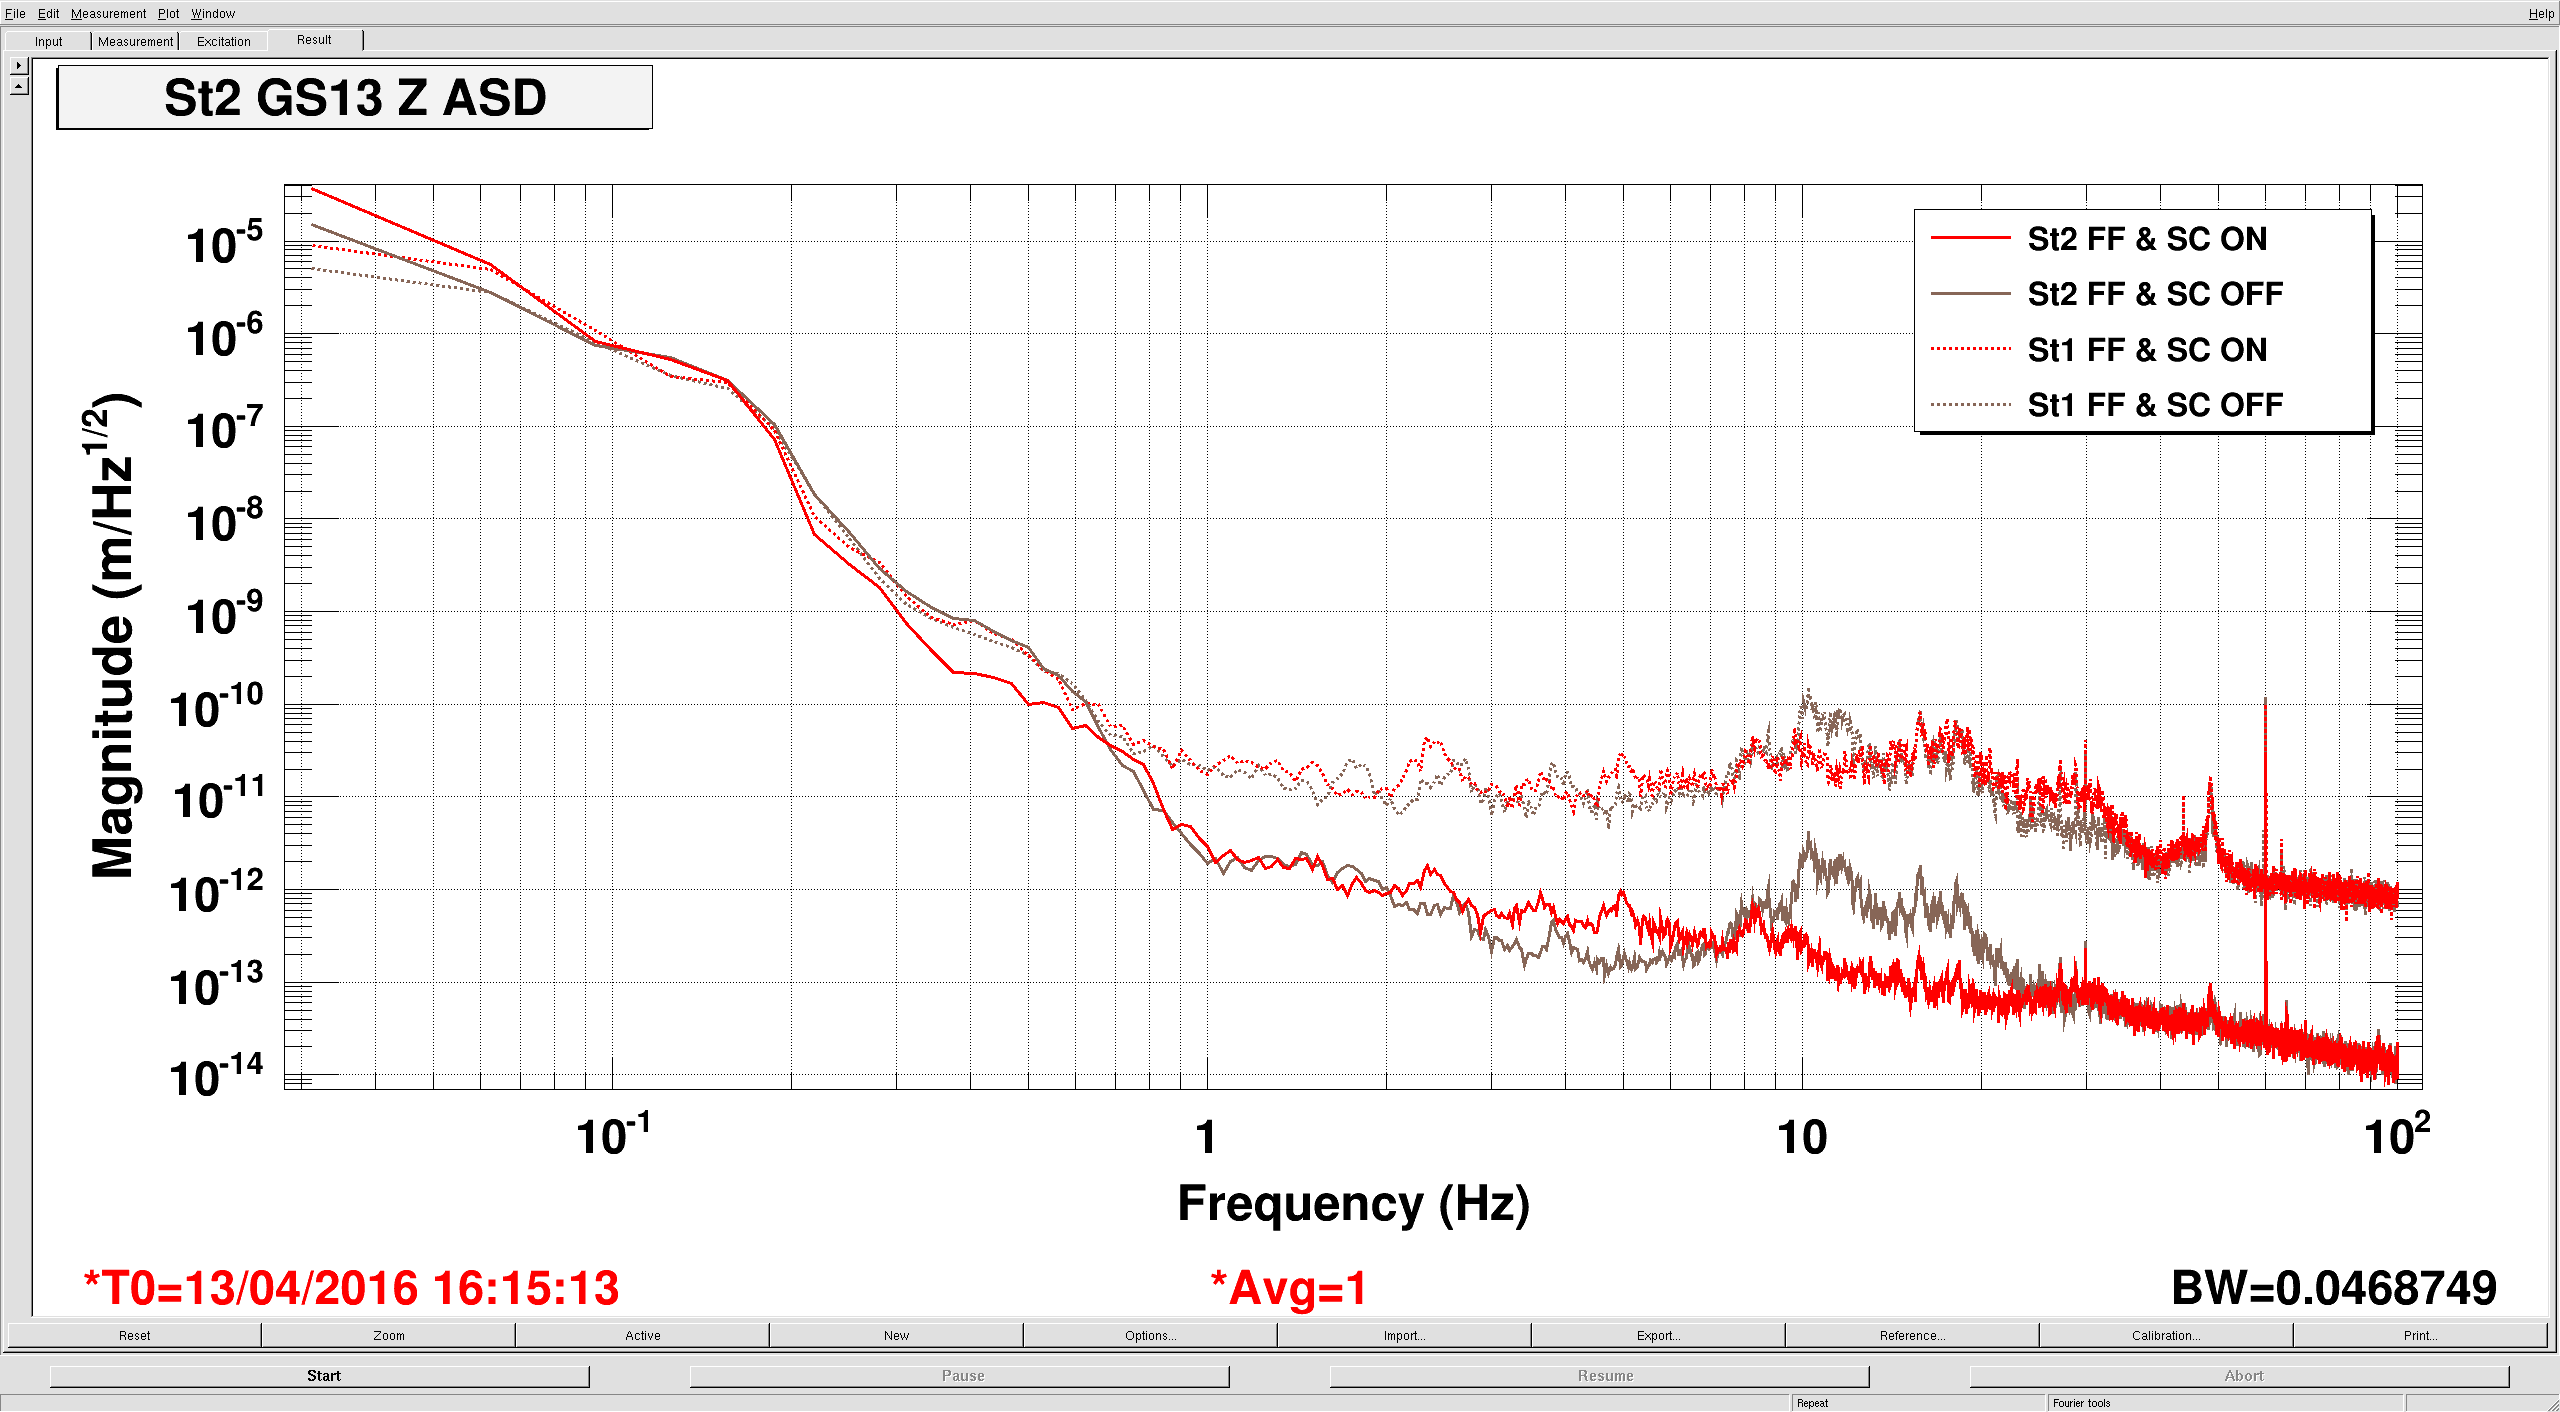
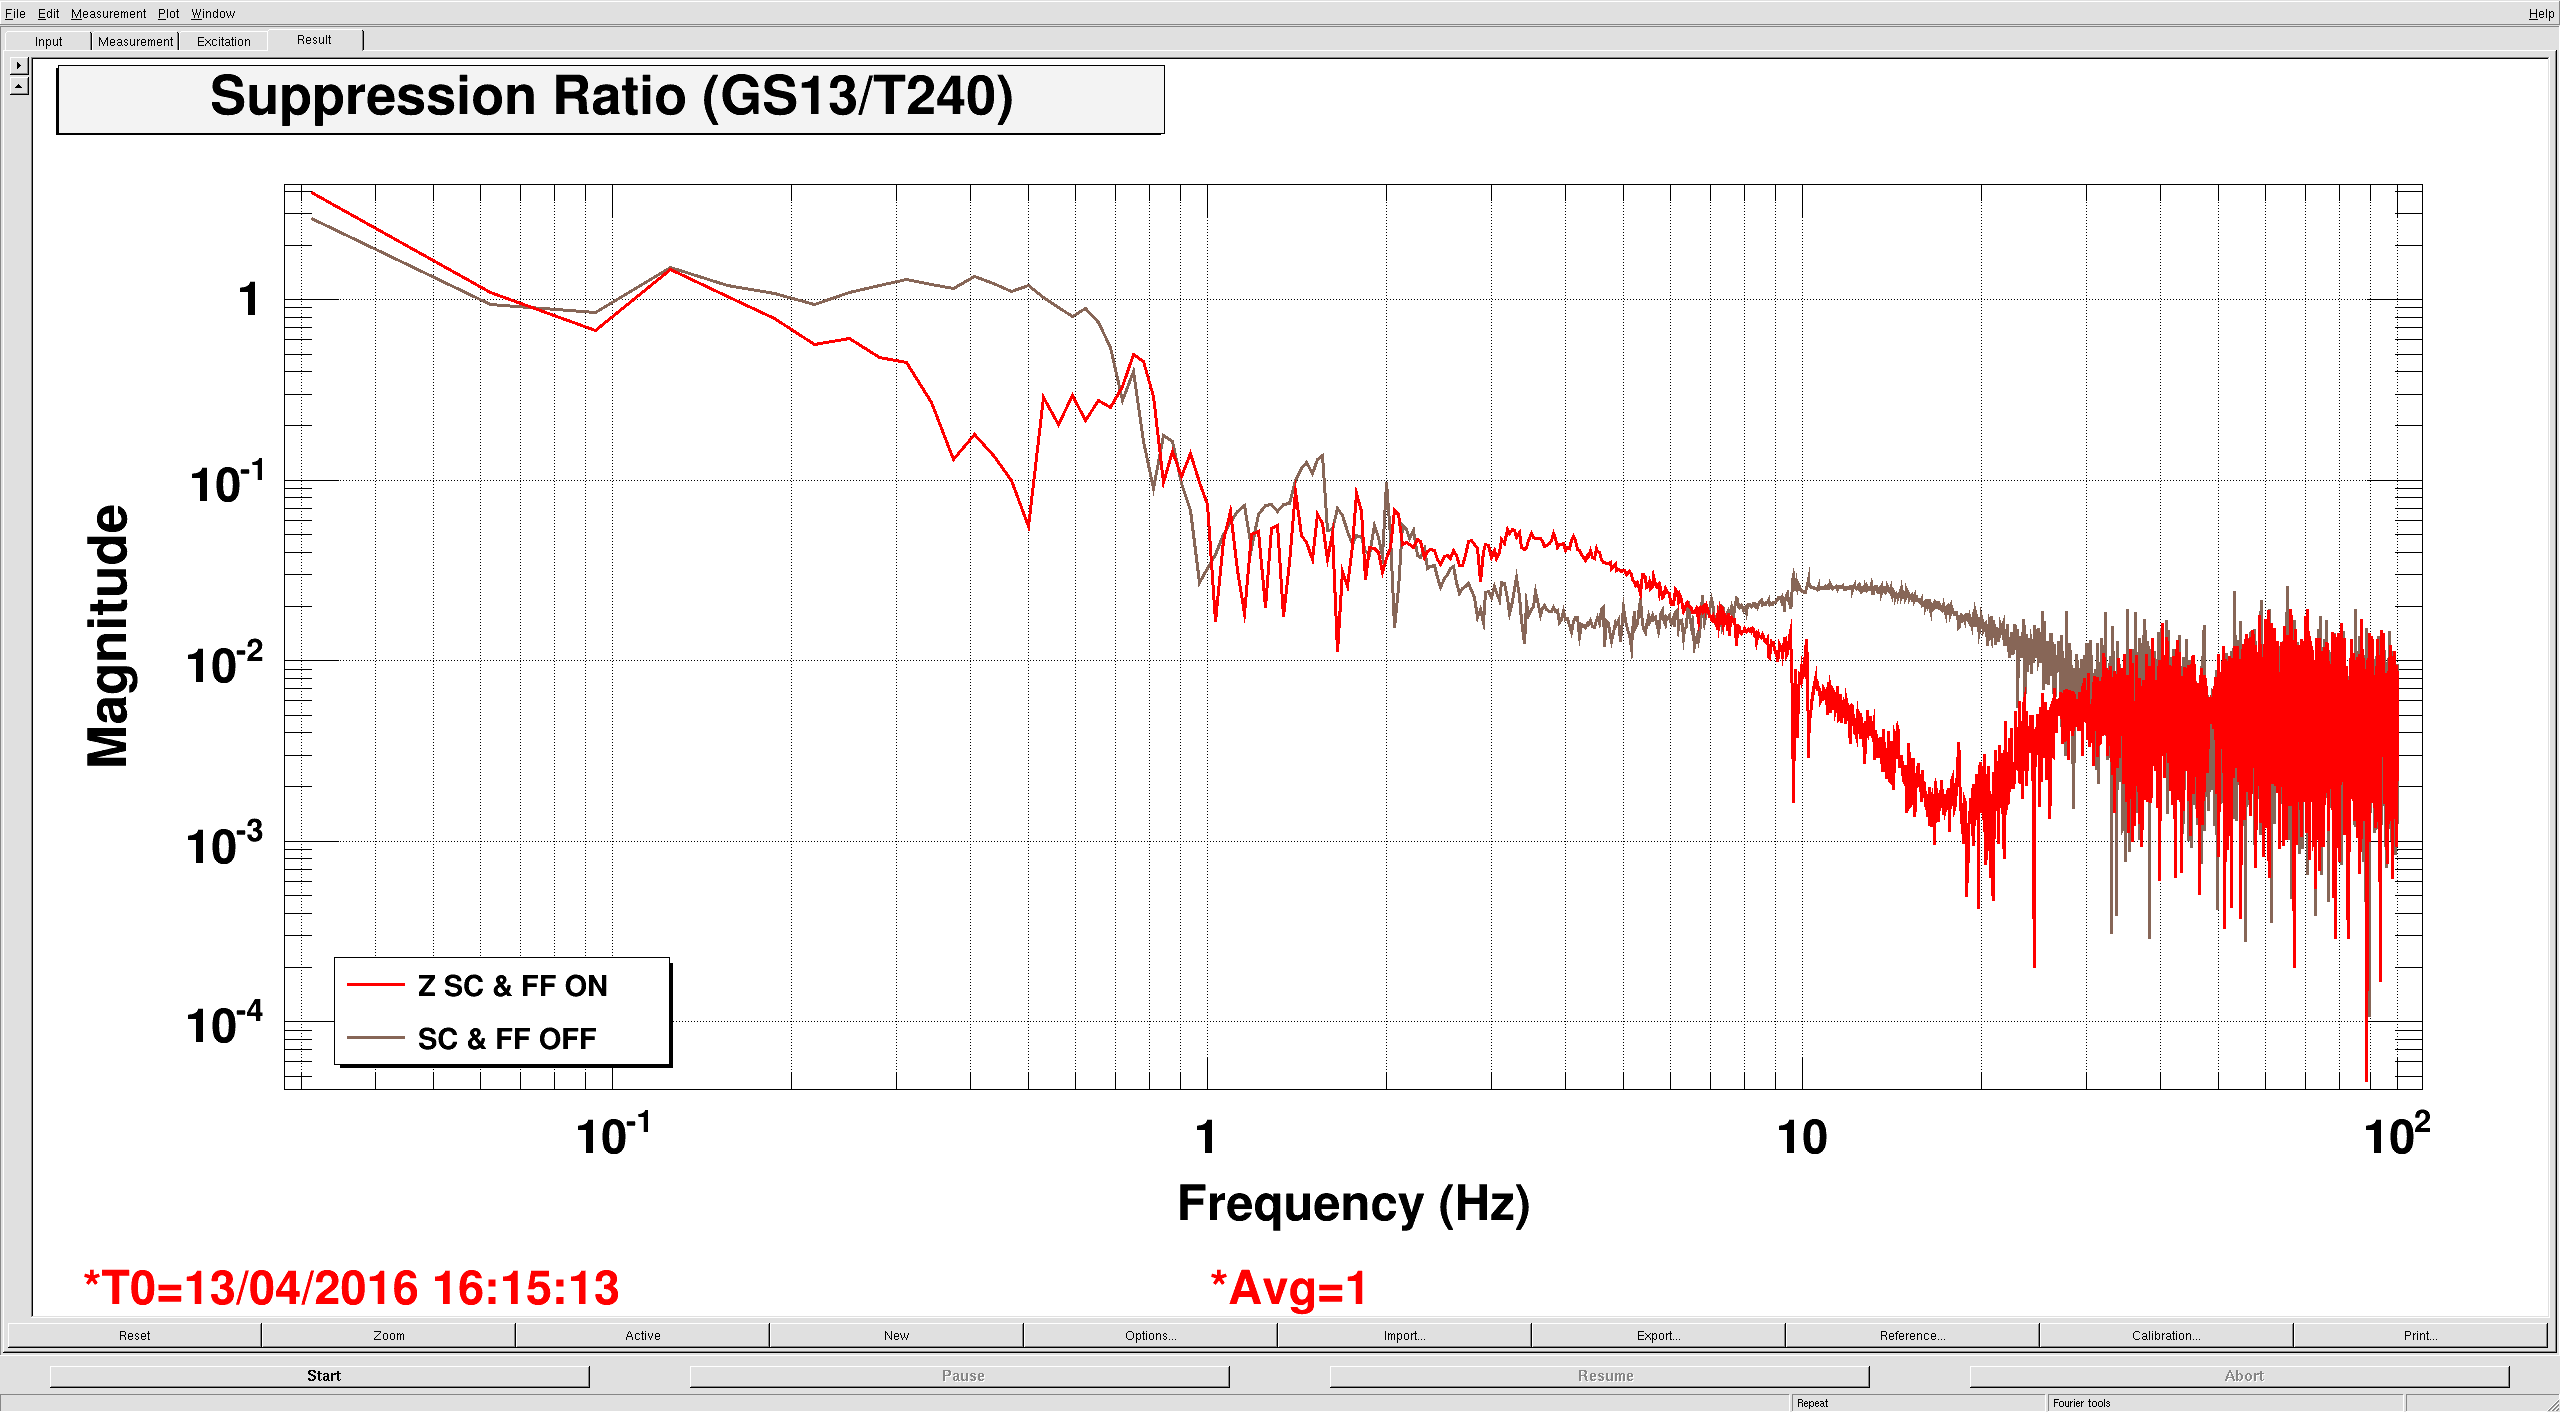
The fourth plot shows the St1 T240 & St2 GS13 performance on ETMX in Z, the only dof where I'm currently running both feedforward and sensor correction. The red traces are with St1-2 FF and SC on, the brown traces are off. Again, seems to work like it should. The fifth plot is the suppression (the ratio of St2 motion to ST1) for the on and off configurations.
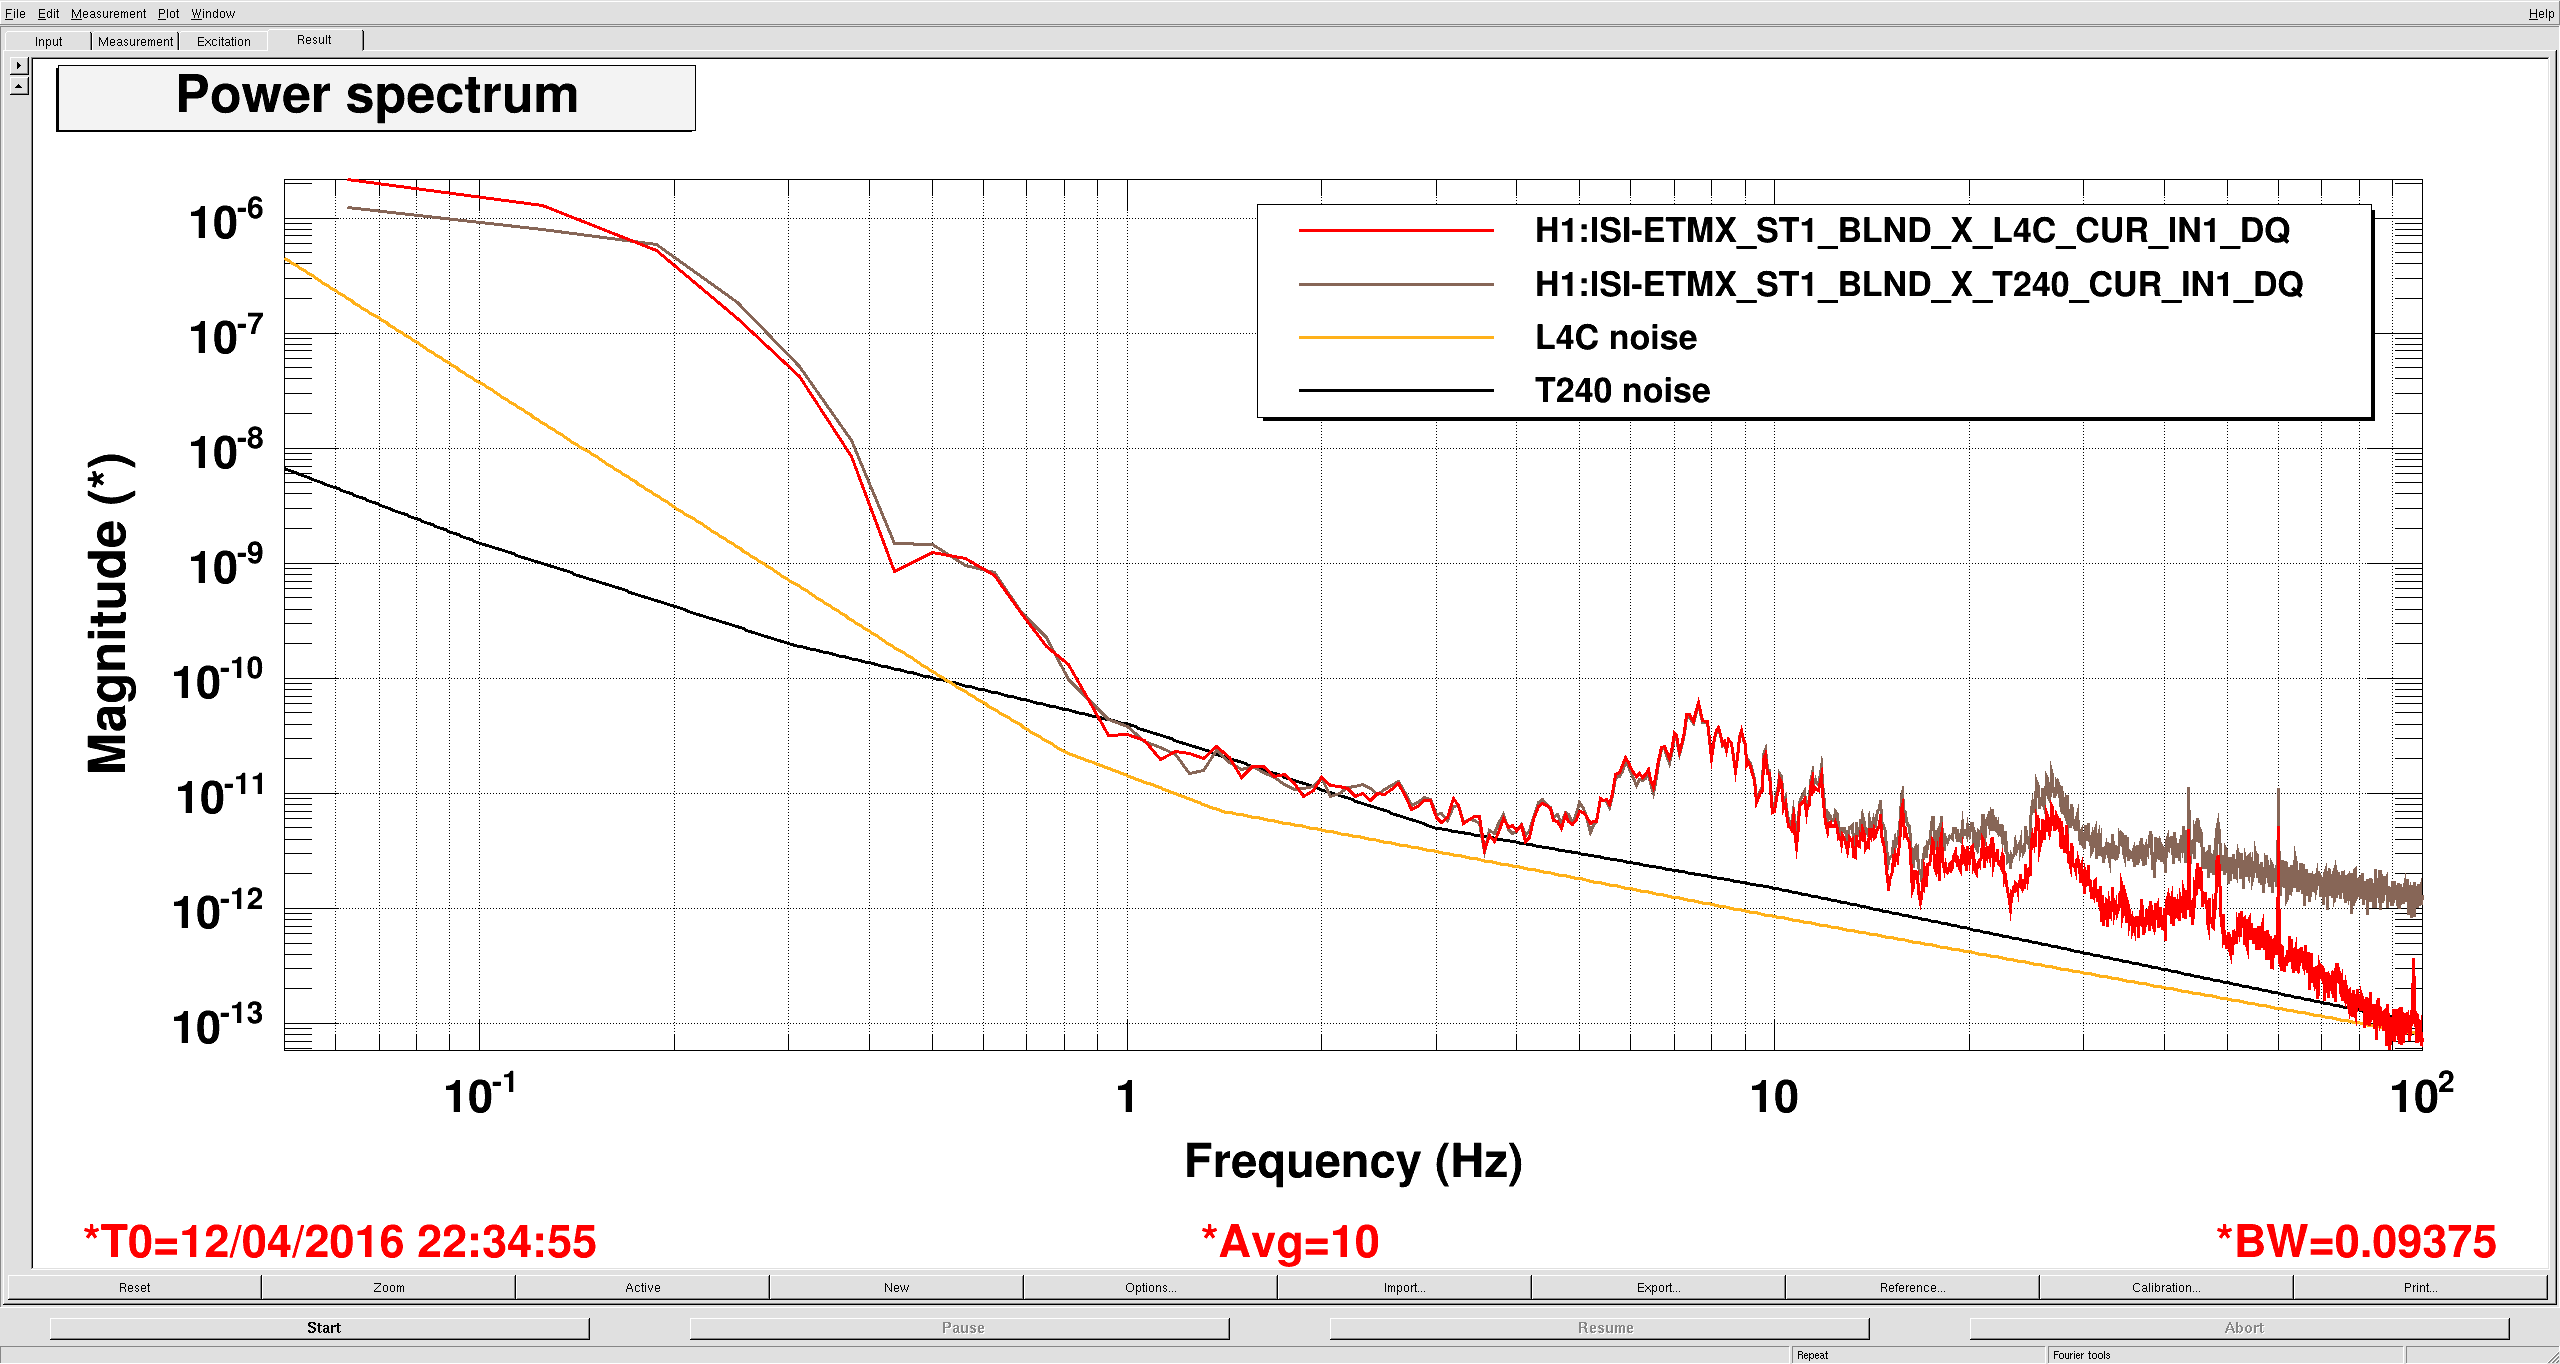
While I was taking these measurements, I realized that the St1 performance is limited by T240 sensing noise at around 1-3 hz, see my last plot. I don't know if we can do anything about it, but it's interesting.
These filters are now installed and running on all BSCs, on all dofs. This has been captured in the appropriate snaps, as well.
Now that X-mid has been upgraded to Beckhoff, transducer read back values which exceed 100% are displayed as 100%. I found this to be an important detail when trying to interpret why CP6's level wasn't shown as reducing as a function of time with the stated conditions.
1330 hrs. local -> Magnehelic between 43" and 44"?  No change?

Also, I briefly valved-out the instrument air to the LLCV actuator and perceived no valve stem stroke, i.e. the current manual setting of 5.00% open is the same as if 0.00% open.
The IM alignment shifts have caused locking issues, and so I asked TJ to add an alignment notification for IM1, IM2, and IM3 in DIAG_MAIN.
I've set the notification levels at:
These levels reflect roughly twice the drift in a recent 60 day trend.
Nominal alignment values in the notifications are:
IM3 yaw nominal value may need to be updated in about a month, since it has a sustained downward drift that was present through O1 and continues.
- TJ, Cheryl
To clarify:
Limits on alignment shifts:
Limits on alignment Notifications must be larger:
The Notifications are only intended to allert Operators and Commissioners to an IM alignment shift that may have happened during a time when the CR was not staffed.
What is always true regarding the IM alignments:
When HAM2 ISI trips, it continues to be necessary to trend IM1, IM2, and IM3 alignments to check for shifts that need to be corrected, regardless of the Notifications appearance or lack of appearance on DIAG_MAIN.