kyle.ryan@LIGO.ORG - posted 13:04, Sunday 06 March 2016 - last comment - 14:48, Sunday 06 March 2016(25902)
Kyle to X-end VEA - Expect to return in 2 hours
Comments related to this report
This morning the PSL diffracted power was oscillating. We set H1:PSL-ISS_REFSIGNALto -1/97V, making the diffracted power ~7%. (Refsignal was -2V).
Rob, Evan
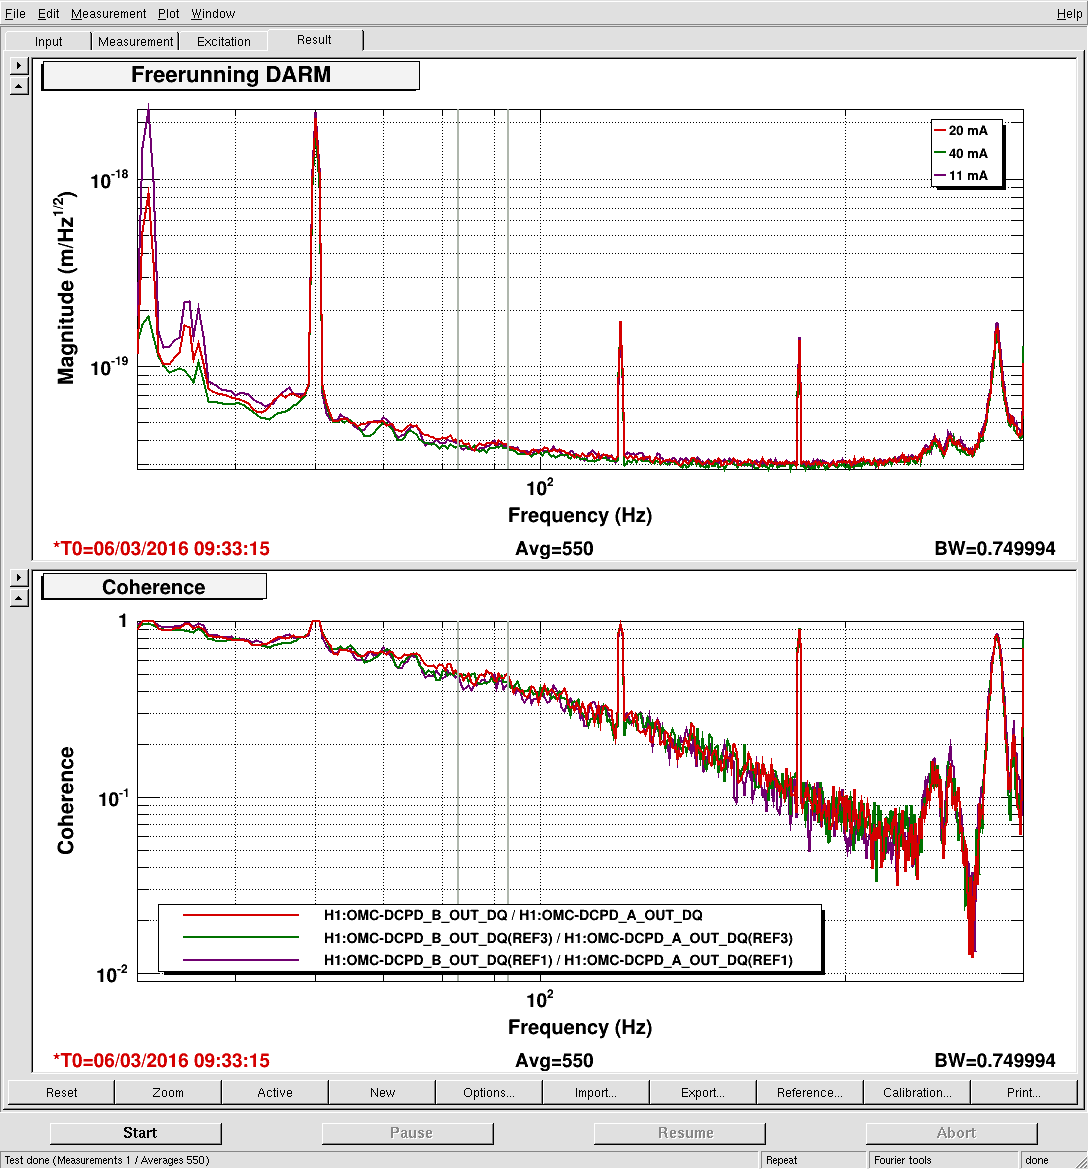
We looked again at DARM noise versus DARM offset. This time, we took Matt's suggestion and added a stopband filter (>20 dB suppression from 83 to 93 Hz) in PRCL, MICH, SRCL, dHard p/y, BS p/y, and SR2 p/y.
There is no change to the noise or the DCPD coherence within the filter stopband.
Times as follows (all 2016-03-06 Z):
Rob, Evan, Sheila
We have been doing a little bit more work on ASC today. The main messages:
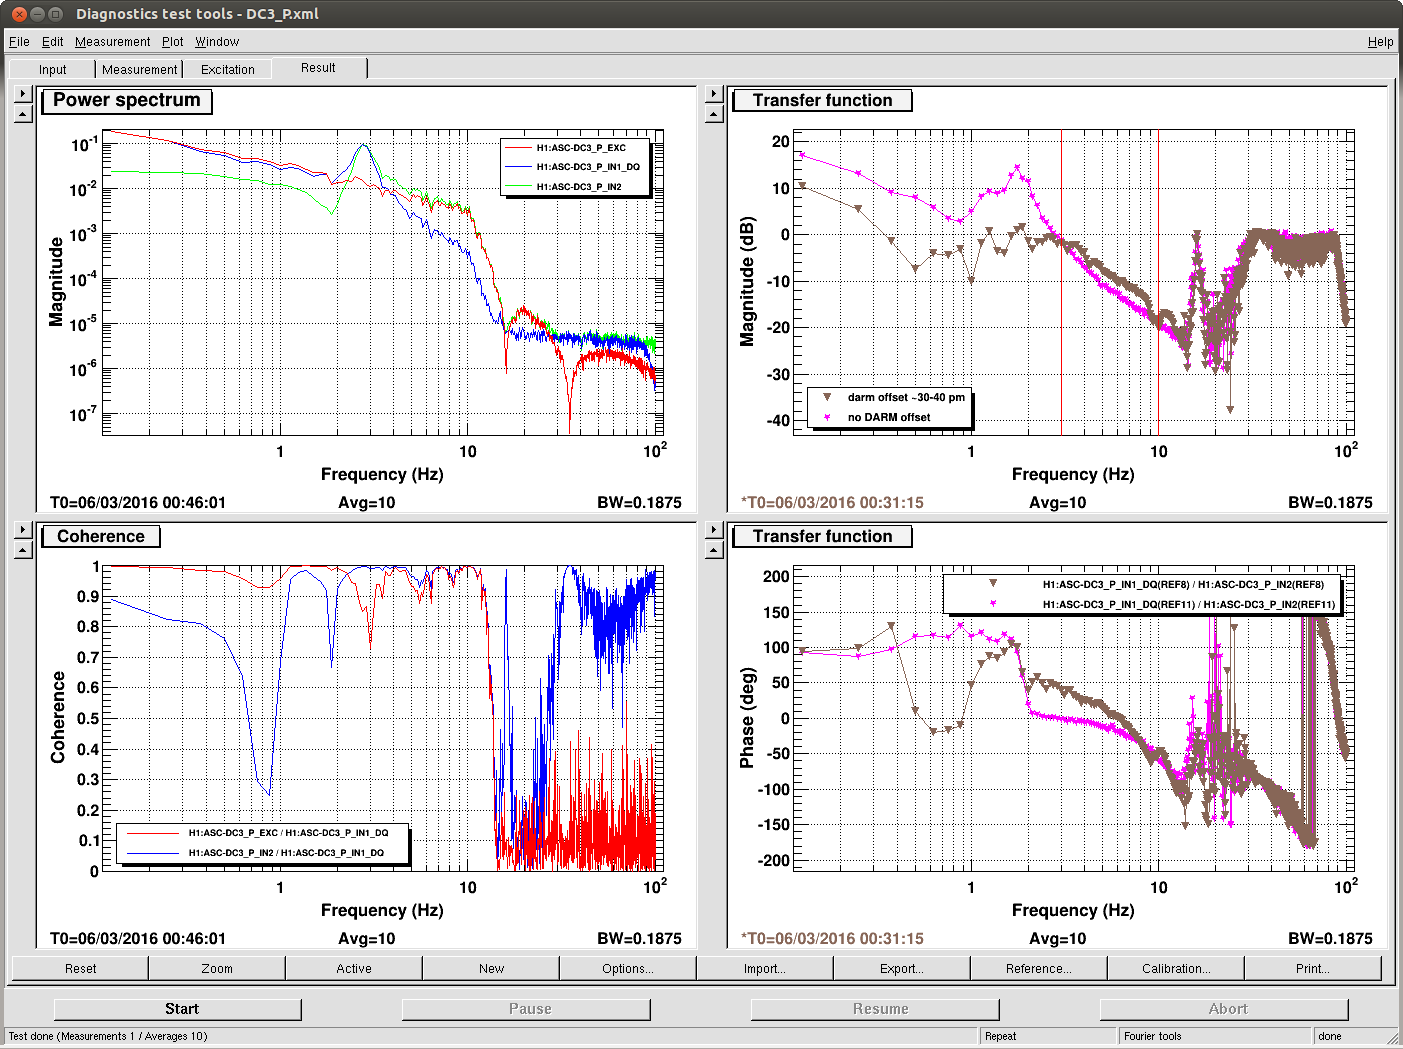
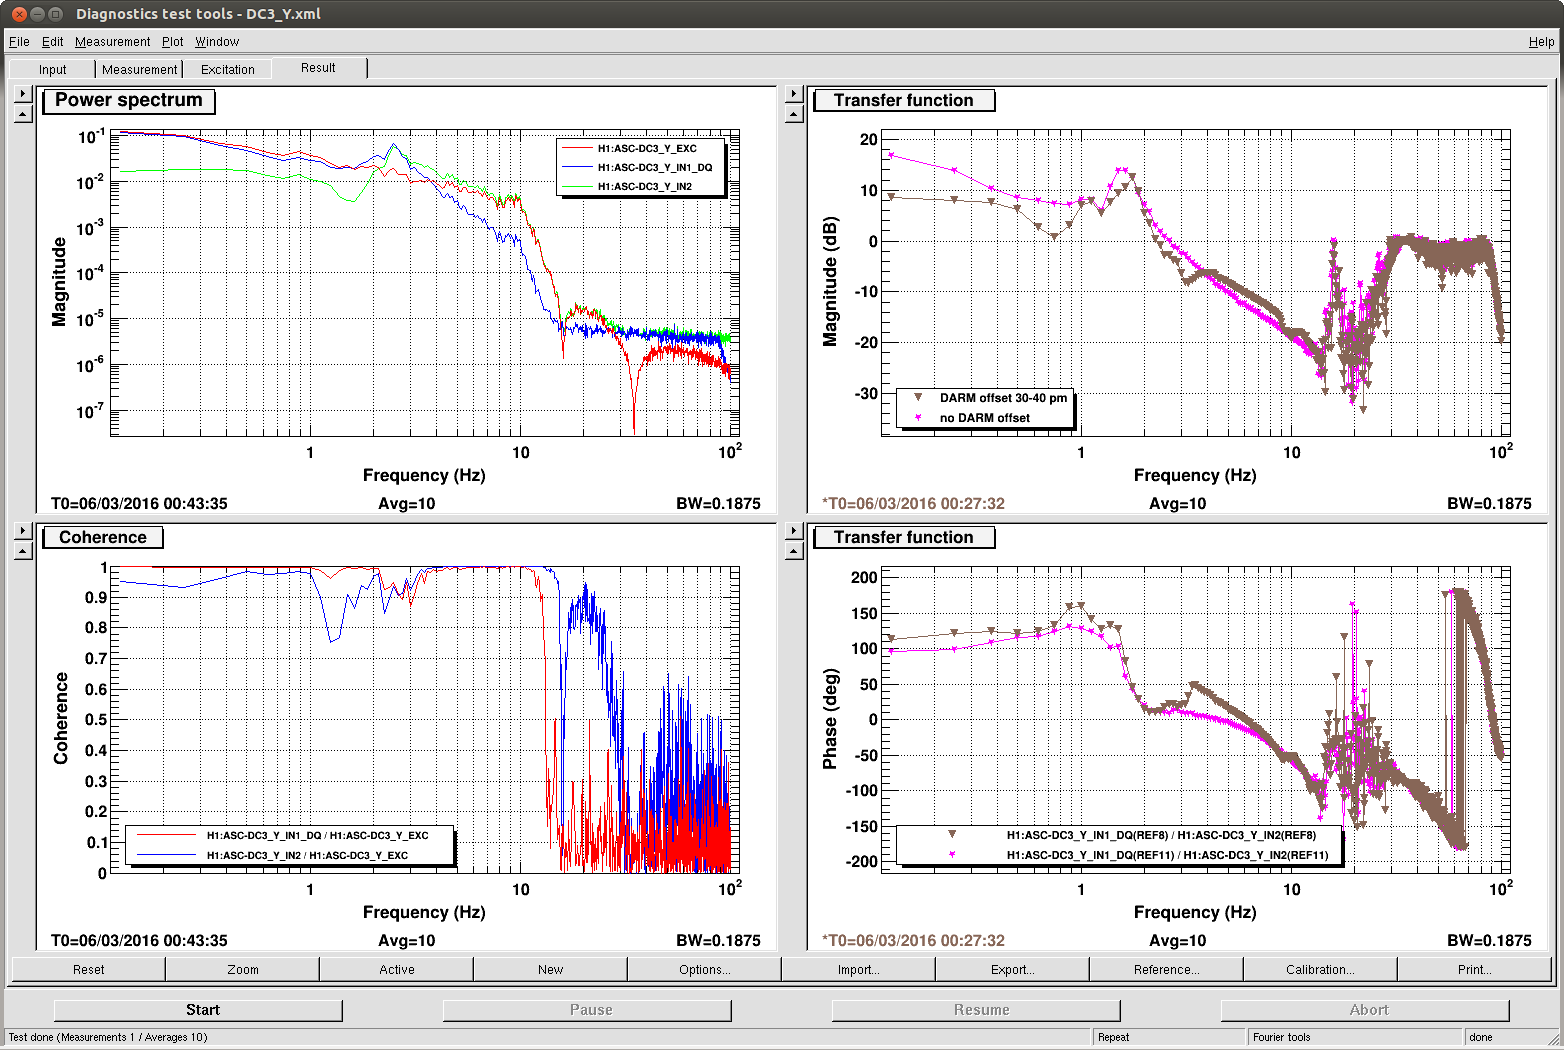
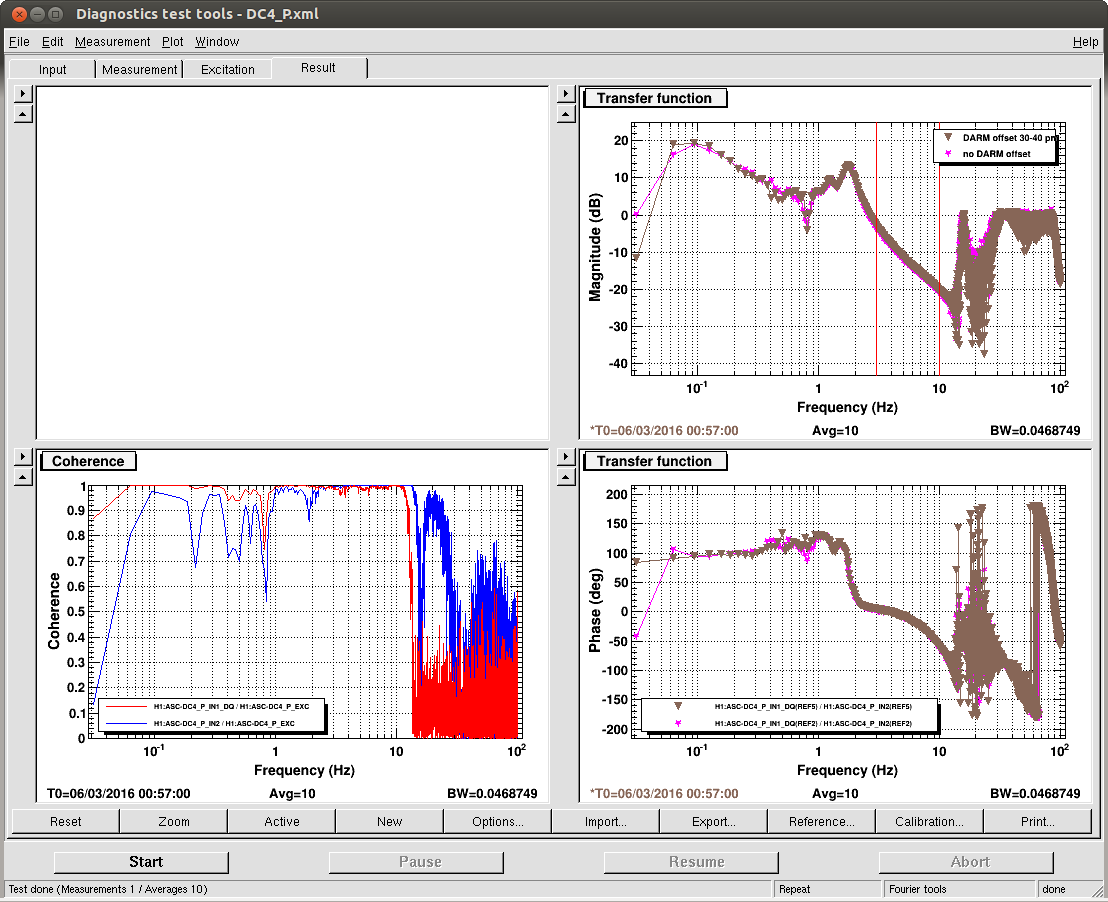
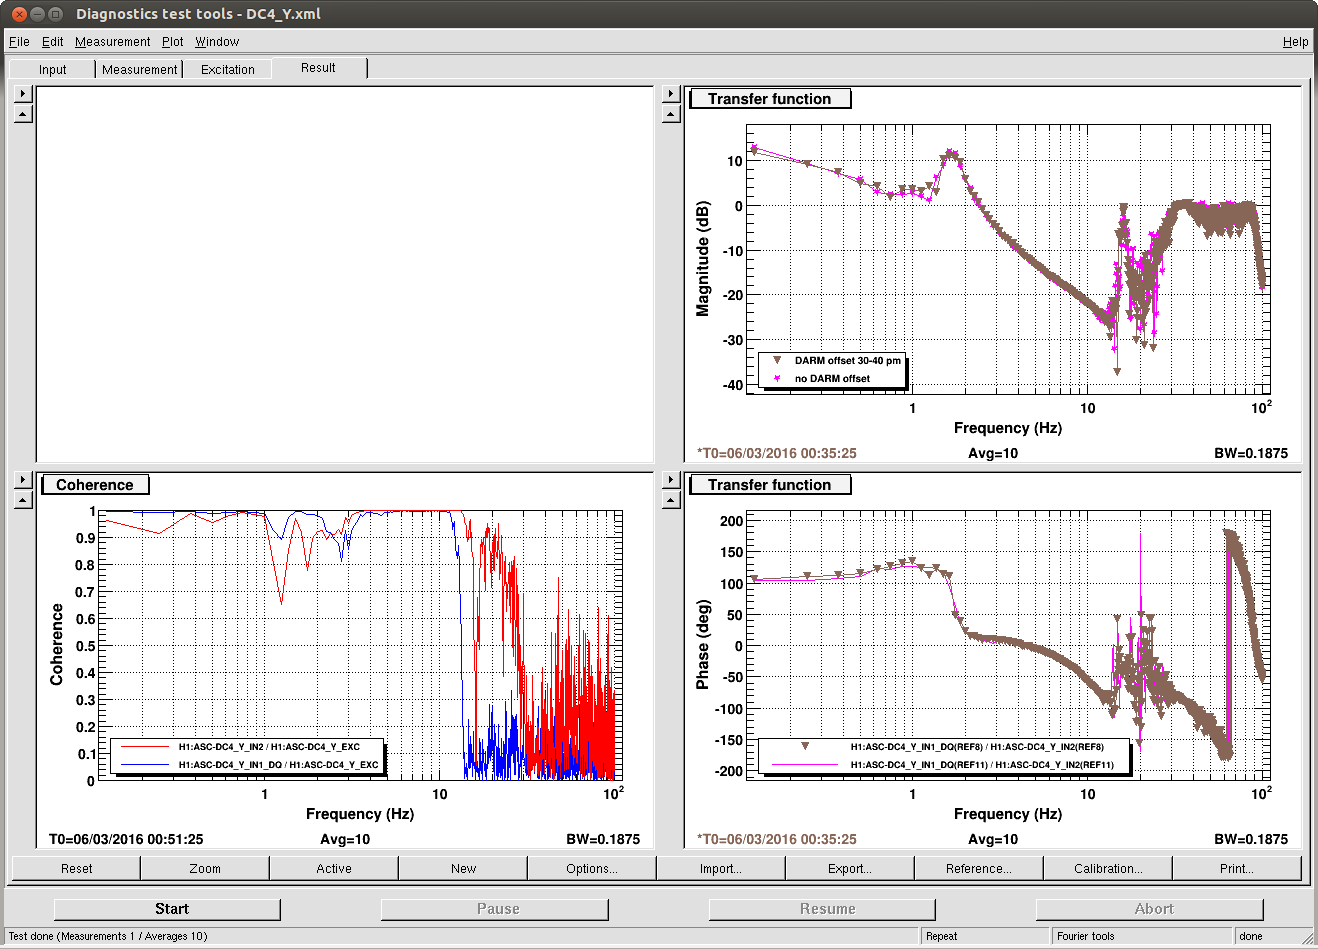
First we measured the DC centering loops for different configurations, because we have had different measurements come to different conclusions in the last few days about the stability of these loops. The gain of these loops is the same with no ASC on, with full DRMI ASC on, and in full lock without a DARM offset or any ASC on. However, changing the DARM offset changes the response of these loops (especially DC3, which is centering AS A), somehow adding more phase at the ugf for DC3 P+Y. The first four attachments are comparisions of the loop gains with and without a DARM offset on. The coherence is not good for the DC3 P measurement with a DARM offset on, the rest of the coherences are fine.
We then looked at the sensitivity of the TMS QPDs to transmon motion. We had originaly choosen a combination of QPDs that was insensitive to pit and yaw, but Rana has told us that at LLO it is more important to be insensitive to roll. We looked 60 day trends of the osems, and moved TMS some amount that was comparable to the drift according to the osems, and looked at the QPD response. If we believe the osems, the pit and yaw drifts are the most important for the QPDs by far, although for TMS Y there was also a small reponse to Roll and V (pushing on V also moved pit and yaw according to the osems, so this may explain the coupling of V to the QPDs).
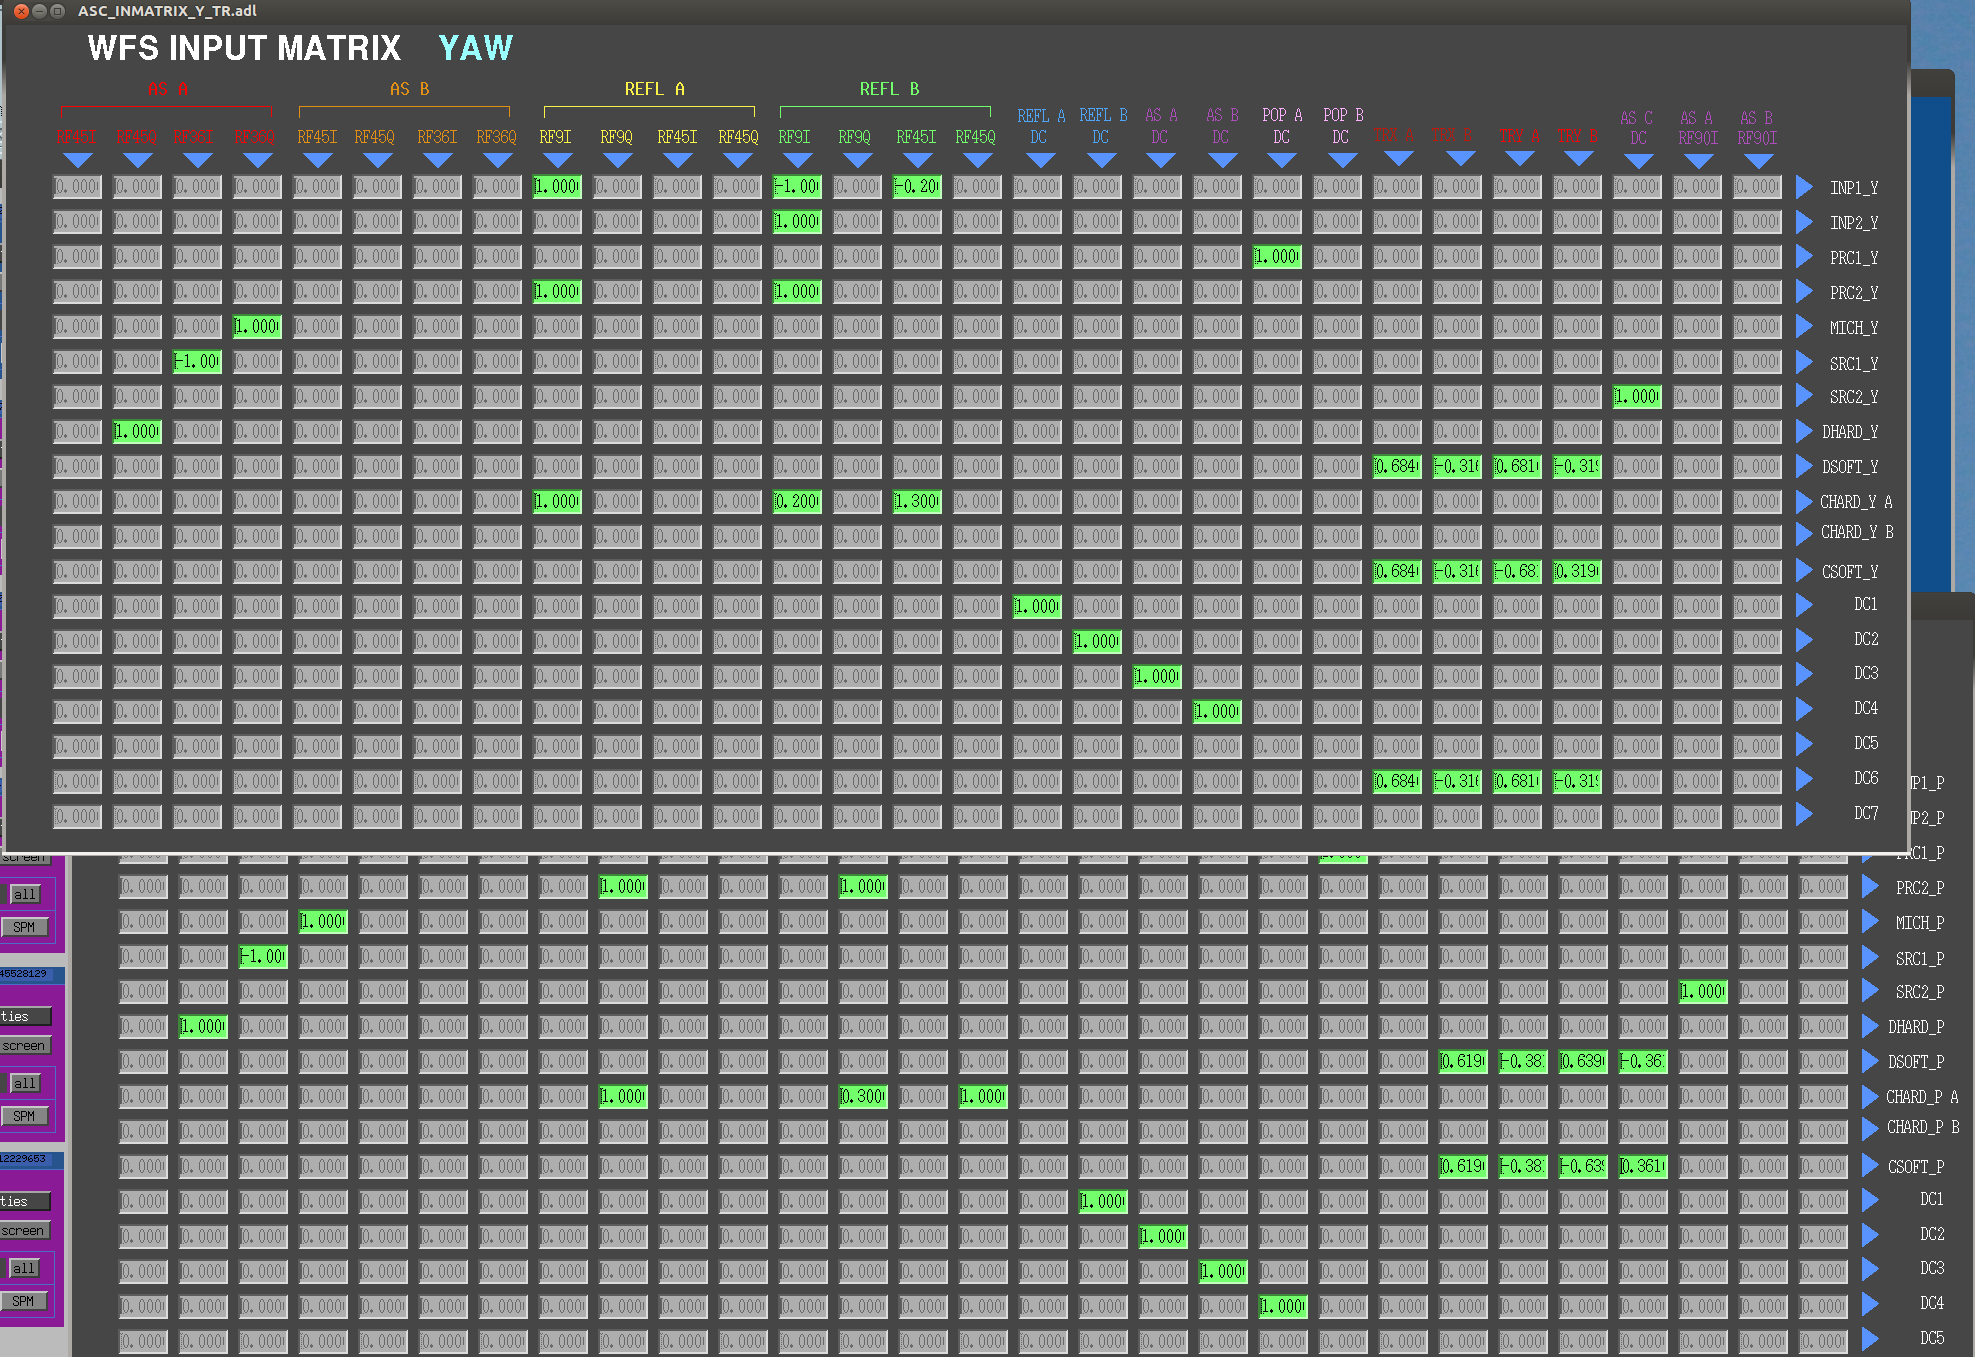
Then we drove the transmons at 1.3 Hz and found the combination of QPDs that was least sensitive to TMS pit and yaw. We had done this last time in April, I think. We improved the sensitivity to all 4 angles by at least a factor of 10. The new input matrix is shown in the 5th attachment. We then closed the soft loops, without adjusting the offsets to account for the new input matrix (seems OK so far). Since the new input matrix is normalized so that the elements from each arm are 1, the digital gain for the soft loops is increased by 50%.
The first time we powered up I had tried increasing the offloading gain on all test masses by 20 dB, this may or may not have been the cause of a very slow instability where PRC2 Y, DSOFT and CSOFT rang up and eventually broke the lock.
Rob had a look at why we had been unable to run Gabriele's sensing matrix script. We would like to use this script instead of the lockins because we can easily add some sensors that aren't in the lockin matrix like the centering signals. One thing we noticed is that while we can easily add the DC centering signal, the RF centering signals are not in the frames. We probably want to add these to the frames anyway.
There were a couple of issues in the script, including an incorrect sampling frequency as well a hanging call to the python nds2 library and apparently some changes to markup.py. I have a version I'm working with in my home/scripts directory that used cdsutils instead. Here is the ASC PIT sensing matrix, measured in DC READOUT at 2W:Sensing matrix measurement Sensing matrix (abs)
| Excitation: | H1:ASC-INP1_P_SM_EXC | H1:ASC-PRC1_P_SM_EXC | H1:ASC-PRC2_P_SM_EXC | H1:ASC-MICH_P_SM_EXC | H1:ASC-SRC1_P_SM_EXC | H1:ASC-SRC2_P_SM_EXC | H1:ASC-DHARD_P_SM_EXC | H1:ASC-CHARD_P_SM_EXC | H1:ASC-DSOFT_P_SM_EXC | H1:ASC-CSOFT_P_SM_EXC |
| Monitor channel: | H1:ASC-INP1_P_SM_DQ | H1:ASC-PRC1_P_SM_DQ | H1:ASC-PRC2_P_SM_DQ | H1:ASC-MICH_P_SM_DQ | H1:ASC-SRC1_P_SM_DQ | H1:ASC-SRC2_P_SM_DQ | H1:ASC-DHARD_P_SM_DQ | H1:ASC-CHARD_P_SM_DQ | H1:ASC-DSOFT_P_SM_DQ | H1:ASC-CSOFT_P_SM_DQ |
| H1:ASC-AS_A_DC_PIT_OUT_DQ | 2.4e-06 | 2.0e-08 | 1.7e-06 | 9.7e-07 | 1.2e-06 | 7.4e-05 | 4.3e-07 | 3.0e-08 | 3.9e-08 | 2.9e-08 |
| H1:ASC-AS_A_RF36_I_PIT_OUT_DQ | 1.7e-02 | 5.8e-04 | 8.7e-02 | 3.6e-03 | 1.1e-02 | 1.6e+00 | 2.6e-04 | 5.4e-06 | 8.9e-05 | 4.0e-05 |
| H1:ASC-AS_A_RF36_Q_PIT_OUT_DQ | 3.0e-02 | 4.7e-04 | 4.6e-02 | 8.2e-03 | 2.0e-02 | 2.6e+00 | 1.7e-04 | 1.4e-05 | 2.8e-04 | 4.3e-05 |
| H1:ASC-AS_A_RF45_I_PIT_OUT_DQ | 3.5e-03 | 6.5e-05 | 1.3e-02 | 1.7e-03 | 2.2e-03 | 3.5e-01 | 1.0e-05 | 7.6e-06 | 6.1e-05 | 6.6e-07 |
| H1:ASC-AS_A_RF45_Q_PIT_OUT_DQ | 1.2e-03 | 1.9e-04 | 2.0e-02 | 5.7e-03 | 1.7e-02 | 1.1e+00 | 3.0e-03 | 2.3e-04 | 2.8e-04 | 1.7e-04 |
| H1:ASC-AS_B_DC_PIT_OUT_DQ | 5.8e-07 | 8.2e-08 | 1.0e-05 | 5.4e-07 | 2.4e-06 | 9.0e-05 | 3.0e-07 | 1.6e-08 | 2.9e-08 | 2.3e-08 |
| H1:ASC-AS_B_RF36_I_PIT_OUT_DQ | 1.3e-02 | 1.7e-04 | 3.7e-02 | 3.1e-03 | 2.0e-02 | 2.2e+00 | 3.1e-04 | 2.3e-05 | 6.8e-05 | 6.2e-05 |
| H1:ASC-AS_B_RF36_Q_PIT_OUT_DQ | 1.9e-02 | 1.8e-04 | 3.2e-02 | 9.1e-03 | 9.8e-03 | 1.7e+00 | 1.3e-04 | 2.1e-05 | 2.8e-04 | 1.5e-05 |
| H1:ASC-AS_B_RF45_I_PIT_OUT_DQ | 3.1e-03 | 1.1e-04 | 1.8e-02 | 1.2e-03 | 3.9e-04 | 2.1e-01 | 2.7e-05 | 6.8e-06 | 4.3e-05 | 1.7e-06 |
| H1:ASC-AS_B_RF45_Q_PIT_OUT_DQ | 1.3e-02 | 5.2e-04 | 6.4e-02 | 4.5e-03 | 1.9e-02 | 9.8e-01 | 2.7e-03 | 2.3e-04 | 2.4e-04 | 1.8e-04 |
| H1:ASC-AS_C_PIT_OUT_DQ | 1.5e-06 | 1.1e-07 | 1.5e-05 | 1.9e-07 | 2.9e-06 | 1.3e-04 | 9.4e-08 | 3.8e-09 | 6.9e-09 | 8.7e-09 |
| H1:ASC-REFL_A_DC_PIT_OUT_DQ | 3.6e-06 | 3.8e-08 | 1.2e-05 | 1.1e-06 | 7.8e-08 | 1.1e-05 | 8.2e-08 | 8.0e-08 | 1.1e-08 | 3.2e-08 |
| H1:ASC-REFL_A_RF9_I_PIT_OUT_DQ | 1.9e+00 | 1.9e-03 | 3.9e-01 | 2.0e-03 | 3.0e-03 | 6.4e-01 | 2.1e-05 | 3.7e-04 | 1.9e-05 | 8.8e-05 |
| H1:ASC-REFL_A_RF9_Q_PIT_OUT_DQ | 3.8e-01 | 2.6e-04 | 4.5e-02 | 4.0e-04 | 2.0e-04 | 7.5e-02 | 1.5e-05 | 1.0e-04 | 1.3e-05 | 1.3e-05 |
| H1:ASC-REFL_A_RF45_I_PIT_OUT_DQ | 2.0e+00 | 2.1e-03 | 1.4e-01 | 2.5e-03 | 1.3e-04 | 1.8e-01 | 3.4e-05 | 4.1e-04 | 4.1e-05 | 7.3e-05 |
| H1:ASC-REFL_A_RF45_Q_PIT_OUT_DQ | 4.9e-01 | 6.3e-04 | 6.7e-02 | 9.6e-04 | 1.1e-03 | 1.3e-01 | 1.4e-06 | 1.1e-04 | 1.3e-05 | 9.3e-06 |
| H1:ASC-REFL_B_DC_PIT_OUT_DQ | 1.6e-04 | 4.5e-08 | 7.2e-06 | 1.0e-06 | 1.9e-07 | 1.2e-05 | 3.4e-08 | 3.8e-08 | 1.3e-08 | 2.7e-08 |
| H1:ASC-REFL_B_RF9_I_PIT_OUT_DQ | 1.7e+00 | 6.1e-03 | 3.8e-01 | 2.3e-03 | 3.5e-03 | 6.7e-01 | 5.0e-05 | 3.4e-04 | 1.5e-05 | 7.8e-05 |
| H1:ASC-REFL_B_RF9_Q_PIT_OUT_DQ | 4.3e-01 | 1.2e-03 | 7.0e-02 | 4.4e-04 | 6.7e-04 | 1.2e-01 | 1.0e-05 | 4.7e-05 | 3.2e-06 | 1.5e-05 |
| H1:ASC-REFL_B_RF45_I_PIT_OUT_DQ | 1.9e+00 | 2.5e-03 | 2.0e-01 | 7.2e-04 | 4.4e-03 | 2.7e-01 | 4.8e-05 | 4.1e-04 | 3.6e-05 | 3.5e-05 |
| H1:ASC-REFL_B_RF45_Q_PIT_OUT_DQ | 6.5e-01 | 6.1e-04 | 1.1e-01 | 1.5e-03 | 3.2e-03 | 3.2e-01 | 2.7e-05 | 1.4e-04 | 2.3e-05 | 1.8e-05 |
| H1:ASC-POP_A_PIT_OUT_DQ | 1.3e-06 | 3.6e-08 | 1.0e-06 | 9.5e-08 | 2.1e-08 | 1.9e-06 | 3.6e-10 | 6.6e-09 | 5.4e-10 | 4.3e-10 |
| H1:ASC-POP_B_PIT_OUT_DQ | 7.0e-07 | 9.7e-08 | 7.0e-07 | 5.5e-08 | 2.0e-08 | 1.9e-06 | 2.1e-09 | 2.8e-09 | 1.0e-09 | 6.0e-10 |
| H1:ASC-X_TR_A_PIT_OUT_DQ | 1.0e-06 | 1.1e-08 | 5.6e-07 | 1.9e-08 | 1.9e-07 | 1.3e-05 | 1.2e-08 | 1.1e-08 | 6.8e-10 | 3.9e-10 |
| H1:ASC-X_TR_B_PIT_OUT_DQ | 9.3e-07 | 1.0e-08 | 5.1e-07 | 1.1e-08 | 1.8e-07 | 1.2e-05 | 1.1e-08 | 1.1e-08 | 1.1e-09 | 9.4e-11 |
| H1:ASC-Y_TR_A_PIT_OUT_DQ | 6.1e-07 | 1.3e-08 | 8.7e-07 | 1.4e-08 | 1.9e-07 | 1.6e-05 | 1.2e-08 | 1.2e-08 | 1.3e-09 | 1.2e-09 |
| H1:ASC-Y_TR_B_PIT_OUT_DQ | 4.7e-07 | 1.2e-09 | 1.5e-07 | 2.8e-09 | 5.6e-08 | 2.1e-06 | 1.8e-09 | 1.7e-09 | 1.9e-09 | 2.0e-09 |
| Excitation: | H1:ASC-INP1_P_SM_EXC | H1:ASC-PRC1_P_SM_EXC | H1:ASC-PRC2_P_SM_EXC | H1:ASC-MICH_P_SM_EXC | H1:ASC-SRC1_P_SM_EXC | H1:ASC-SRC2_P_SM_EXC | H1:ASC-DHARD_P_SM_EXC | H1:ASC-CHARD_P_SM_EXC | H1:ASC-DSOFT_P_SM_EXC | H1:ASC-CSOFT_P_SM_EXC |
| Monitor channel: | H1:ASC-INP1_P_SM_DQ | H1:ASC-PRC1_P_SM_DQ | H1:ASC-PRC2_P_SM_DQ | H1:ASC-MICH_P_SM_DQ | H1:ASC-SRC1_P_SM_DQ | H1:ASC-SRC2_P_SM_DQ | H1:ASC-DHARD_P_SM_DQ | H1:ASC-CHARD_P_SM_DQ | H1:ASC-DSOFT_P_SM_DQ | H1:ASC-CSOFT_P_SM_DQ |
| H1:ASC-AS_A_DC_PIT_OUT_DQ | 0.04 | 0.43 | 0.65 | 0.65 | 0.85 | 0.64 | 1.00 | 0.78 | 0.71 | 0.88 |
| H1:ASC-AS_A_RF36_I_PIT_OUT_DQ | 0.01 | 0.60 | 0.94 | 0.92 | 0.59 | 0.91 | 0.98 | 0.05 | 0.84 | 0.83 |
| H1:ASC-AS_A_RF36_Q_PIT_OUT_DQ | 0.01 | 0.29 | 0.64 | 0.98 | 0.66 | 0.89 | 0.94 | 0.15 | 0.97 | 0.78 |
| H1:ASC-AS_A_RF45_I_PIT_OUT_DQ | 0.01 | 0.30 | 0.89 | 0.89 | 0.58 | 0.88 | 0.27 | 0.23 | 0.94 | 0.01 |
| H1:ASC-AS_A_RF45_Q_PIT_OUT_DQ | 0.00 | 0.20 | 0.61 | 0.88 | 0.86 | 0.85 | 1.00 | 0.94 | 0.95 | 0.97 |
| H1:ASC-AS_B_DC_PIT_OUT_DQ | 0.00 | 0.90 | 0.98 | 0.40 | 0.94 | 0.70 | 1.00 | 0.54 | 0.65 | 0.78 |
| H1:ASC-AS_B_RF36_I_PIT_OUT_DQ | 0.00 | 0.07 | 0.63 | 0.75 | 0.73 | 0.90 | 0.98 | 0.32 | 0.69 | 0.87 |
| H1:ASC-AS_B_RF36_Q_PIT_OUT_DQ | 0.01 | 0.12 | 0.67 | 0.98 | 0.52 | 0.84 | 0.92 | 0.30 | 0.97 | 0.31 |
| H1:ASC-AS_B_RF45_I_PIT_OUT_DQ | 0.01 | 0.73 | 0.97 | 0.98 | 0.08 | 0.74 | 0.85 | 0.55 | 0.97 | 0.23 |
| H1:ASC-AS_B_RF45_Q_PIT_OUT_DQ | 0.01 | 0.71 | 0.95 | 0.91 | 0.91 | 0.73 | 1.00 | 0.97 | 0.97 | 0.98 |
| H1:ASC-AS_C_PIT_OUT_DQ | 0.01 | 0.88 | 0.99 | 0.79 | 0.94 | 0.97 | 1.00 | 0.72 | 0.87 | 0.97 |
| H1:ASC-REFL_A_DC_PIT_OUT_DQ | 0.16 | 0.76 | 0.99 | 0.01 | 0.03 | 0.02 | 0.08 | 0.08 | 0.00 | 0.03 |
| H1:ASC-REFL_A_RF9_I_PIT_OUT_DQ | 1.00 | 0.98 | 1.00 | 0.14 | 0.20 | 0.36 | 0.02 | 0.93 | 0.02 | 0.65 |
| H1:ASC-REFL_A_RF9_Q_PIT_OUT_DQ | 1.00 | 0.96 | 0.99 | 0.02 | 0.02 | 0.14 | 0.04 | 0.72 | 0.02 | 0.09 |
| H1:ASC-REFL_A_RF45_I_PIT_OUT_DQ | 1.00 | 0.99 | 0.97 | 0.03 | 0.00 | 0.06 | 0.01 | 0.69 | 0.01 | 0.13 |
| H1:ASC-REFL_A_RF45_Q_PIT_OUT_DQ | 1.00 | 0.98 | 0.99 | 0.20 | 0.37 | 0.29 | 0.00 | 0.92 | 0.08 | 0.15 |
| H1:ASC-REFL_B_DC_PIT_OUT_DQ | 1.00 | 0.80 | 0.92 | 0.05 | 0.14 | 0.02 | 0.06 | 0.10 | 0.01 | 0.16 |
| H1:ASC-REFL_B_RF9_I_PIT_OUT_DQ | 1.00 | 1.00 | 1.00 | 0.52 | 0.28 | 0.43 | 0.37 | 0.98 | 0.05 | 0.83 |
| H1:ASC-REFL_B_RF9_Q_PIT_OUT_DQ | 1.00 | 1.00 | 1.00 | 0.08 | 0.29 | 0.46 | 0.08 | 0.77 | 0.01 | 0.36 |
| H1:ASC-REFL_B_RF45_I_PIT_OUT_DQ | 1.00 | 0.99 | 0.99 | 0.02 | 0.53 | 0.12 | 0.11 | 0.93 | 0.04 | 0.18 |
| H1:ASC-REFL_B_RF45_Q_PIT_OUT_DQ | 0.99 | 0.95 | 0.99 | 0.54 | 0.61 | 0.52 | 0.36 | 0.97 | 0.26 | 0.49 |
| H1:ASC-POP_A_PIT_OUT_DQ | 0.46 | 0.99 | 0.97 | 0.19 | 0.10 | 0.03 | 0.01 | 0.65 | 0.01 | 0.02 |
| H1:ASC-POP_B_PIT_OUT_DQ | 0.34 | 1.00 | 0.97 | 0.05 | 0.19 | 0.06 | 0.08 | 0.19 | 0.02 | 0.02 |
| H1:ASC-X_TR_A_PIT_OUT_DQ | 0.13 | 0.77 | 0.78 | 0.22 | 0.70 | 0.33 | 0.99 | 1.00 | 0.30 | 0.31 |
| H1:ASC-X_TR_B_PIT_OUT_DQ | 0.13 | 0.76 | 0.78 | 0.40 | 0.70 | 0.32 | 1.00 | 1.00 | 0.89 | 0.23 |
| H1:ASC-Y_TR_A_PIT_OUT_DQ | 0.06 | 0.80 | 0.89 | 0.41 | 0.67 | 0.47 | 1.00 | 1.00 | 0.91 | 0.98 |
| H1:ASC-Y_TR_B_PIT_OUT_DQ | 0.41 | 0.44 | 0.82 | 0.15 | 0.79 | 0.19 | 0.99 | 0.99 | 0.98 | 1.00 |
| Excitation: | H1:ASC-INP1_P_SM_EXC | H1:ASC-PRC1_P_SM_EXC | H1:ASC-PRC2_P_SM_EXC | H1:ASC-MICH_P_SM_EXC | H1:ASC-SRC1_P_SM_EXC | H1:ASC-SRC2_P_SM_EXC | H1:ASC-DHARD_P_SM_EXC | H1:ASC-CHARD_P_SM_EXC | H1:ASC-DSOFT_P_SM_EXC | H1:ASC-CSOFT_P_SM_EXC |
| Monitor channel: | H1:ASC-INP1_P_SM_DQ | H1:ASC-PRC1_P_SM_DQ | H1:ASC-PRC2_P_SM_DQ | H1:ASC-MICH_P_SM_DQ | H1:ASC-SRC1_P_SM_DQ | H1:ASC-SRC2_P_SM_DQ | H1:ASC-DHARD_P_SM_DQ | H1:ASC-CHARD_P_SM_DQ | H1:ASC-DSOFT_P_SM_DQ | H1:ASC-CSOFT_P_SM_DQ |
| H1:ASC-AS_A_DC_PIT_OUT_DQ | -1.3e-07 + -2.4e-06i | 5.1e-09 + 2.0e-08i | -1.4e-06 + -8.9e-07i | -8.0e-07 + 5.4e-07i | -3.9e-07 + 1.1e-06i | 1.2e-05 + -7.3e-05i | -3.8e-07 + 2.1e-07i | 2.7e-08 + -1.4e-08i | -3.1e-08 + 2.4e-08i | 2.7e-08 + -1.1e-08i |
| H1:ASC-AS_A_RF36_I_PIT_OUT_DQ | -1.3e-03 + 1.7e-02i | 5.6e-04 + 1.7e-04i | -8.4e-02 + 2.4e-02i | 2.6e-03 + -2.4e-03i | -4.8e-04 + -1.1e-02i | -1.1e+00 + 1.2e+00i | 2.1e-04 + -1.6e-04i | 2.0e-06 + 5.1e-06i | -7.3e-05 + 5.0e-05i | -3.6e-05 + 1.7e-05i |
| H1:ASC-AS_A_RF36_Q_PIT_OUT_DQ | -2.4e-02 + 1.8e-02i | 4.3e-04 + 1.8e-04i | -4.5e-02 + -3.7e-03i | -6.8e-03 + 4.5e-03i | 1.8e-02 + -6.9e-03i | -2.5e+00 + -6.7e-01i | 3.1e-05 + -1.6e-04i | 9.9e-06 + 9.8e-06i | 2.3e-04 + -1.7e-04i | -3.2e-05 + 2.9e-05i |
| H1:ASC-AS_A_RF45_I_PIT_OUT_DQ | 2.6e-03 + 2.3e-03i | 6.3e-05 + 1.7e-05i | -1.2e-02 + 5.7e-03i | 1.4e-03 + -9.0e-04i | -2.2e-03 + -5.4e-04i | 2.0e-01 + 2.9e-01i | 7.7e-07 + 1.0e-05i | 5.3e-06 + -5.4e-06i | -5.0e-05 + 3.5e-05i | -4.7e-07 + -4.5e-07i |
| H1:ASC-AS_A_RF45_Q_PIT_OUT_DQ | -6.0e-04 + 1.0e-03i | -5.2e-05 + -1.8e-04i | 1.9e-02 + 3.9e-03i | -4.7e-03 + 3.3e-03i | -1.6e-02 + -2.2e-03i | -1.1e+00 + 3.1e-01i | -2.7e-03 + 1.4e-03i | 2.1e-04 + -8.6e-05i | -2.4e-04 + 1.4e-04i | 1.6e-04 + -6.8e-05i |
| H1:ASC-AS_B_DC_PIT_OUT_DQ | 4.6e-07 + 3.5e-07i | -8.0e-08 + -2.1e-08i | 8.8e-06 + -5.6e-06i | 4.7e-07 + -2.7e-07i | 1.4e-06 + -1.9e-06i | -2.0e-05 + 8.8e-05i | 2.6e-07 + -1.5e-07i | -1.5e-08 + 5.5e-09i | 2.5e-08 + -1.5e-08i | -2.0e-08 + 1.1e-08i |
| H1:ASC-AS_B_RF36_I_PIT_OUT_DQ | -2.5e-03 + -1.3e-02i | -1.6e-04 + -6.3e-05i | 3.7e-02 + 7.6e-03i | -2.2e-03 + 2.2e-03i | -3.4e-03 + 2.0e-02i | 1.5e+00 + -1.6e+00i | -2.3e-04 + 2.1e-04i | -2.1e-05 + 8.9e-06i | 5.2e-05 + -4.4e-05i | 5.2e-05 + -3.5e-05i |
| H1:ASC-AS_B_RF36_Q_PIT_OUT_DQ | -1.5e-02 + -1.1e-02i | -8.1e-05 + 1.7e-04i | 9.2e-03 + -3.1e-02i | -6.7e-03 + 6.2e-03i | 9.7e-03 + 1.7e-03i | -1.1e+00 + -1.3e+00i | -1.3e-04 + -1.0e-05i | 1.3e-05 + -1.6e-05i | 2.2e-04 + -1.6e-04i | -8.3e-06 + 1.3e-05i |
| H1:ASC-AS_B_RF45_I_PIT_OUT_DQ | -1.1e-03 + -2.9e-03i | -1.0e-04 + -4.8e-05i | 1.7e-02 + -5.9e-03i | -1.0e-03 + 6.0e-04i | 3.8e-04 + -9.6e-05i | -1.1e-01 + -1.8e-01i | 2.2e-05 + -1.5e-05i | -6.4e-06 + 2.2e-06i | 3.6e-05 + -2.3e-05i | -1.1e-07 + 1.7e-06i |
| H1:ASC-AS_B_RF45_Q_PIT_OUT_DQ | 3.8e-03 + -1.3e-02i | -5.2e-04 + -2.1e-07i | 5.2e-02 + -3.8e-02i | 3.8e-03 + -2.4e-03i | 1.9e-02 + -1.9e-03i | 9.7e-01 + -1.3e-01i | 2.5e-03 + -1.0e-03i | -2.2e-04 + 3.6e-05i | 2.1e-04 + -1.2e-04i | -1.7e-04 + 5.7e-05i |
| H1:ASC-AS_C_PIT_OUT_DQ | 5.7e-09 + 1.5e-06i | 7.5e-08 + 7.7e-08i | -1.5e-05 + 1.4e-07i | 1.4e-07 + -1.3e-07i | -2.9e-06 + 4.2e-08i | 1.3e-04 + -4.8e-05i | 8.2e-08 + -4.4e-08i | -3.7e-09 + 8.6e-10i | 6.1e-09 + -3.2e-09i | -7.7e-09 + 3.9e-09i |
| H1:ASC-REFL_A_DC_PIT_OUT_DQ | 4.3e-07 + -3.5e-06i | -2.6e-08 + -2.8e-08i | -1.2e-05 + 1.8e-06i | -8.2e-07 + -7.1e-07i | -4.7e-08 + 6.2e-08i | 9.7e-06 + -5.4e-06i | 3.6e-08 + -7.3e-08i | 2.2e-08 + -7.7e-08i | 1.0e-08 + -5.5e-09i | -3.1e-08 + -8.5e-09i |
| H1:ASC-REFL_A_RF9_I_PIT_OUT_DQ | 4.7e-01 + -1.8e+00i | -1.4e-03 + -1.3e-03i | 3.9e-01 + -2.2e-02i | 1.0e-03 + -1.7e-03i | -2.9e-03 + -5.1e-04i | 1.0e-01 + 6.3e-01i | 2.1e-05 + -7.9e-07i | 3.4e-04 + -1.4e-04i | -1.6e-05 + 1.0e-05i | 8.7e-05 + -1.6e-05i |
| H1:ASC-REFL_A_RF9_Q_PIT_OUT_DQ | 9.2e-02 + -3.7e-01i | -1.9e-04 + -1.9e-04i | 4.5e-02 + -2.0e-03i | 1.6e-04 + -3.7e-04i | 1.1e-04 + 1.6e-04i | 1.4e-02 + 7.4e-02i | 6.2e-06 + -1.3e-05i | 9.0e-05 + -4.8e-05i | 3.3e-06 + 1.2e-05i | 5.8e-06 + -1.1e-05i |
| H1:ASC-REFL_A_RF45_I_PIT_OUT_DQ | 4.7e-01 + -1.9e+00i | 1.8e-03 + 1.1e-03i | -1.4e-01 + 1.6e-02i | -2.2e-03 + 1.2e-03i | 1.2e-04 + 6.2e-05i | -9.4e-02 + -1.6e-01i | -2.7e-05 + 2.1e-05i | 3.9e-04 + -1.2e-04i | -1.0e-05 + -4.0e-05i | 3.2e-05 + 6.6e-05i |
| H1:ASC-REFL_A_RF45_Q_PIT_OUT_DQ | 1.1e-01 + -4.8e-01i | 4.9e-04 + 4.0e-04i | -6.7e-02 + 5.8e-03i | -6.4e-04 + -7.2e-04i | 8.1e-04 + 6.9e-04i | -4.8e-02 + -1.2e-01i | -1.5e-08 + 1.4e-06i | 1.0e-04 + -3.4e-05i | 9.4e-06 + 8.6e-06i | -8.5e-06 + 3.8e-06i |
| H1:ASC-REFL_B_DC_PIT_OUT_DQ | -3.5e-05 + 1.6e-04i | -4.4e-08 + -1.3e-08i | 7.0e-06 + -1.3e-06i | 7.1e-07 + -7.7e-07i | -1.1e-07 + -1.5e-07i | -2.2e-06 + 1.2e-05i | -3.0e-08 + -1.5e-08i | -3.8e-08 + -1.0e-09i | -5.7e-09 + 1.2e-08i | 1.7e-09 + -2.7e-08i |
| H1:ASC-REFL_B_RF9_I_PIT_OUT_DQ | -4.0e-01 + 1.6e+00i | -4.7e-03 + -3.9e-03i | 3.8e-01 + -2.1e-02i | 2.1e-03 + -9.4e-04i | -3.1e-03 + -1.7e-03i | 3.8e-02 + 6.7e-01i | -4.4e-05 + 2.4e-05i | 3.0e-04 + -1.6e-04i | -1.3e-05 + 5.6e-06i | 7.0e-05 + -3.5e-05i |
| H1:ASC-REFL_B_RF9_Q_PIT_OUT_DQ | -1.1e-01 + 4.2e-01i | -9.4e-04 + -7.7e-04i | 7.0e-02 + -4.2e-03i | 4.2e-04 + -1.3e-04i | -5.8e-04 + -3.3e-04i | 4.7e-03 + 1.2e-01i | -1.0e-05 + 1.6e-06i | 3.7e-05 + -2.8e-05i | 3.2e-06 + -2.4e-07i | 1.0e-05 + -1.2e-05i |
| H1:ASC-REFL_B_RF45_I_PIT_OUT_DQ | -4.9e-01 + 1.8e+00i | -1.9e-03 + -1.6e-03i | -2.0e-01 + 1.8e-02i | -7.1e-04 + -1.3e-04i | 4.3e-03 + 1.2e-03i | -1.1e-01 + -2.5e-01i | -4.8e-05 + -9.7e-07i | 3.6e-04 + -2.0e-04i | 2.5e-05 + 2.6e-05i | -3.3e-05 + -1.2e-05i |
| H1:ASC-REFL_B_RF45_Q_PIT_OUT_DQ | -1.7e-01 + 6.3e-01i | -5.3e-04 + -3.1e-04i | -1.1e-01 + 7.2e-03i | -6.9e-04 + 1.3e-03i | 2.7e-03 + 1.7e-03i | -7.3e-02 + -3.1e-01i | -2.1e-05 + 1.7e-05i | 1.2e-04 + -6.5e-05i | 1.3e-05 + -1.9e-05i | -1.7e-05 + 5.4e-06i |
| H1:ASC-POP_A_PIT_OUT_DQ | -4.0e-07 + 1.2e-06i | 3.0e-08 + 2.0e-08i | -9.8e-07 + 2.0e-07i | -9.4e-08 + 1.2e-08i | 1.8e-08 + 1.1e-08i | -1.9e-06 + 9.5e-09i | -2.4e-10 + 2.6e-10i | 5.7e-09 + -3.3e-09i | 3.2e-10 + -4.3e-10i | 3.0e-10 + -3.1e-10i |
| H1:ASC-POP_B_PIT_OUT_DQ | -1.2e-07 + 6.9e-07i | 7.8e-08 + 5.8e-08i | 6.9e-07 + -1.1e-07i | -4.8e-08 + -2.7e-08i | -2.0e-08 + 1.2e-09i | 1.8e-06 + -1.9e-07i | 2.0e-09 + -1.7e-10i | -2.4e-09 + 1.3e-09i | 1.0e-09 + -1.6e-10i | -1.4e-10 + -5.8e-10i |
| H1:ASC-X_TR_A_PIT_OUT_DQ | 3.6e-07 + -9.4e-07i | 7.9e-09 + 7.4e-09i | -5.6e-07 + 7.2e-09i | -1.6e-08 + 9.6e-09i | -1.7e-07 + -9.1e-08i | -1.2e-05 + 5.4e-06i | -1.0e-08 + 5.9e-09i | -9.9e-09 + 5.6e-09i | -2.7e-10 + 6.2e-10i | 3.6e-10 + -1.3e-10i |
| H1:ASC-X_TR_B_PIT_OUT_DQ | 3.4e-07 + -8.7e-07i | 7.2e-09 + 6.9e-09i | -5.1e-07 + 6.0e-10i | -8.5e-09 + 6.8e-09i | -1.6e-07 + -8.6e-08i | -1.1e-05 + 5.0e-06i | -9.6e-09 + 5.1e-09i | -9.4e-09 + 5.1e-09i | -8.6e-10 + 7.0e-10i | -5.3e-11 + 7.8e-11i |
| H1:ASC-Y_TR_A_PIT_OUT_DQ | 2.3e-07 + -5.7e-07i | 7.2e-09 + 1.1e-08i | -8.6e-07 + -1.4e-07i | 1.2e-08 + -6.4e-09i | 1.7e-07 + 6.6e-08i | 1.3e-05 + -9.4e-06i | 1.0e-08 + -5.6e-09i | -1.1e-08 + 5.8e-09i | 1.2e-09 + -5.7e-10i | -1.0e-09 + 5.4e-10i |
| H1:ASC-Y_TR_B_PIT_OUT_DQ | -7.6e-08 + 4.7e-07i | 9.1e-10 + 7.9e-10i | -1.5e-07 + 4.6e-08i | 2.6e-09 + -9.7e-10i | 5.5e-08 + 1.4e-08i | 1.6e-06 + -1.4e-06i | 1.5e-09 + -9.2e-10i | -1.5e-09 + 8.4e-10i | 1.7e-09 + -8.8e-10i | -1.7e-09 + 9.3e-10i |