Hang, Stefan
We went through the whole initial alignment today. The hickups along the way were:
- Because the green cameras are off-line, we turned off the ITM green camera centering loops: all four H1:ALS-[X|Y]_CAM_ITM_[PIT|YAW]_ERR OUTPUT OFF
- This meant that the best reference on the ITM was the baffle-pointing from the TMS - we found arm alignments that correspond to those TMS pointing positions.
- Input alingment and PRM alignment were simple.
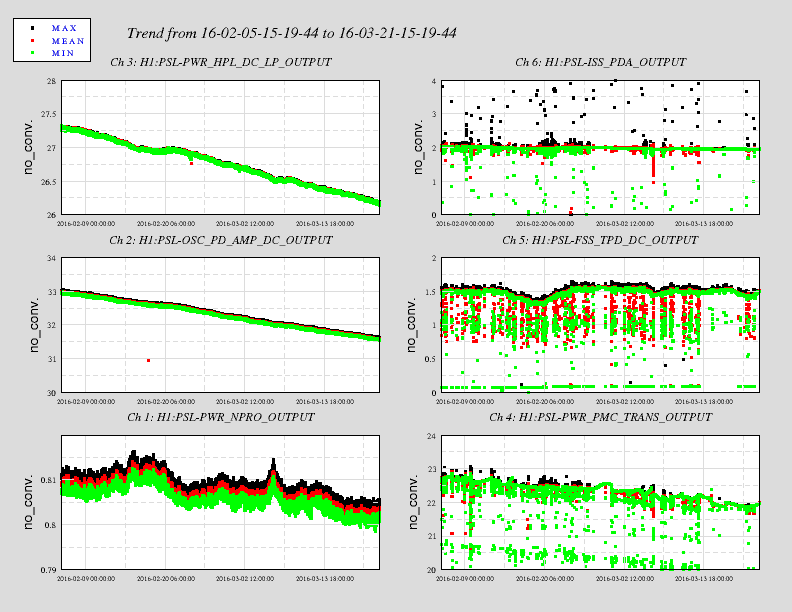
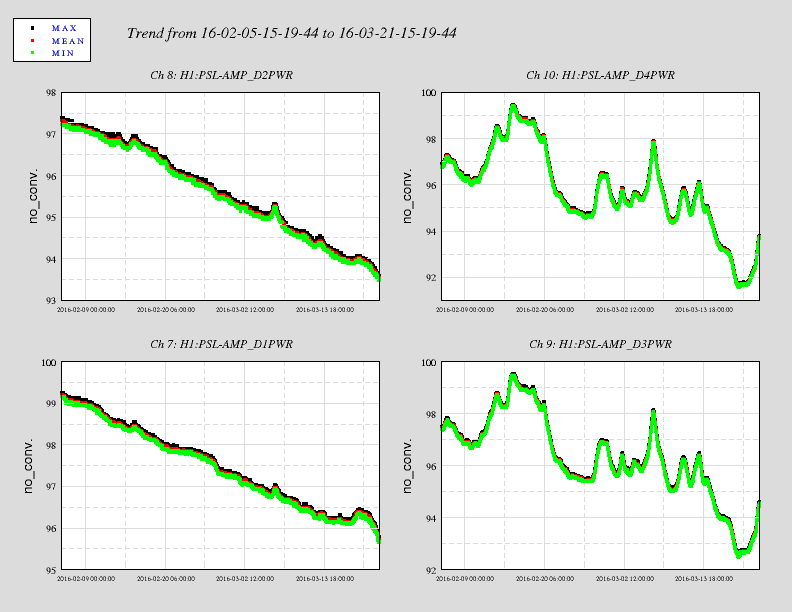
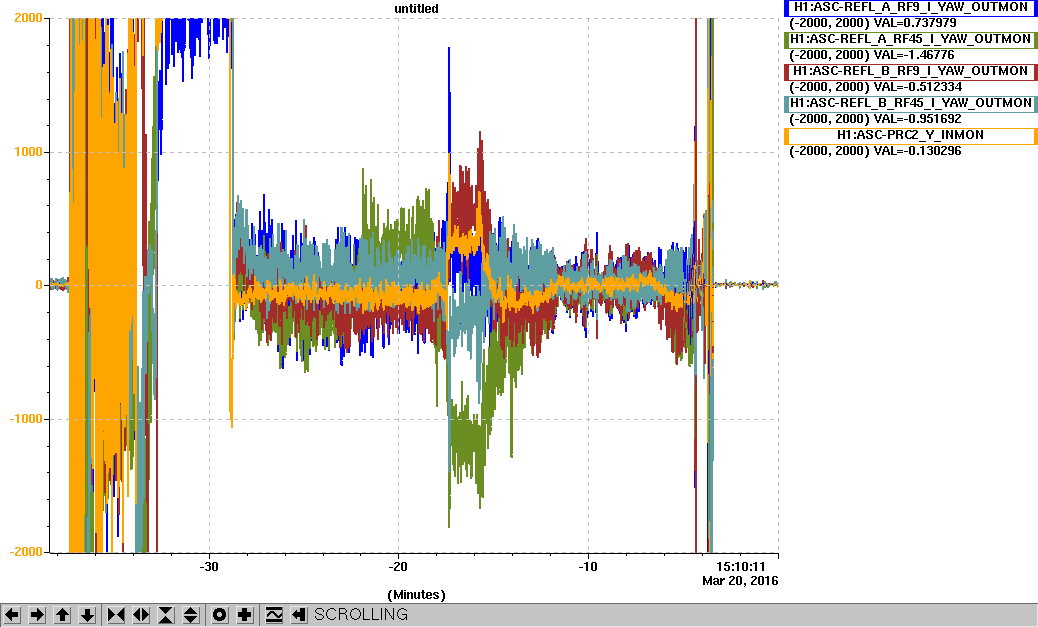
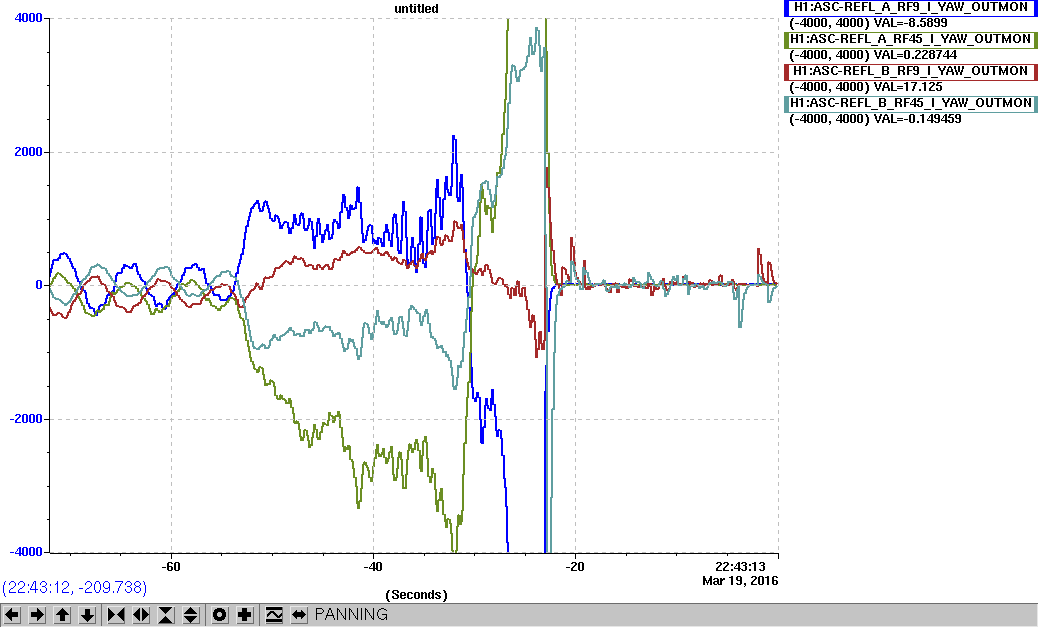
- Next we had trouble locking both MICH_DARK and the SRY cavity - we tracked it down to large electronic offsets on the AS 45 diode. We set the dark offsets on all LSC and ASC RF photodiodes.
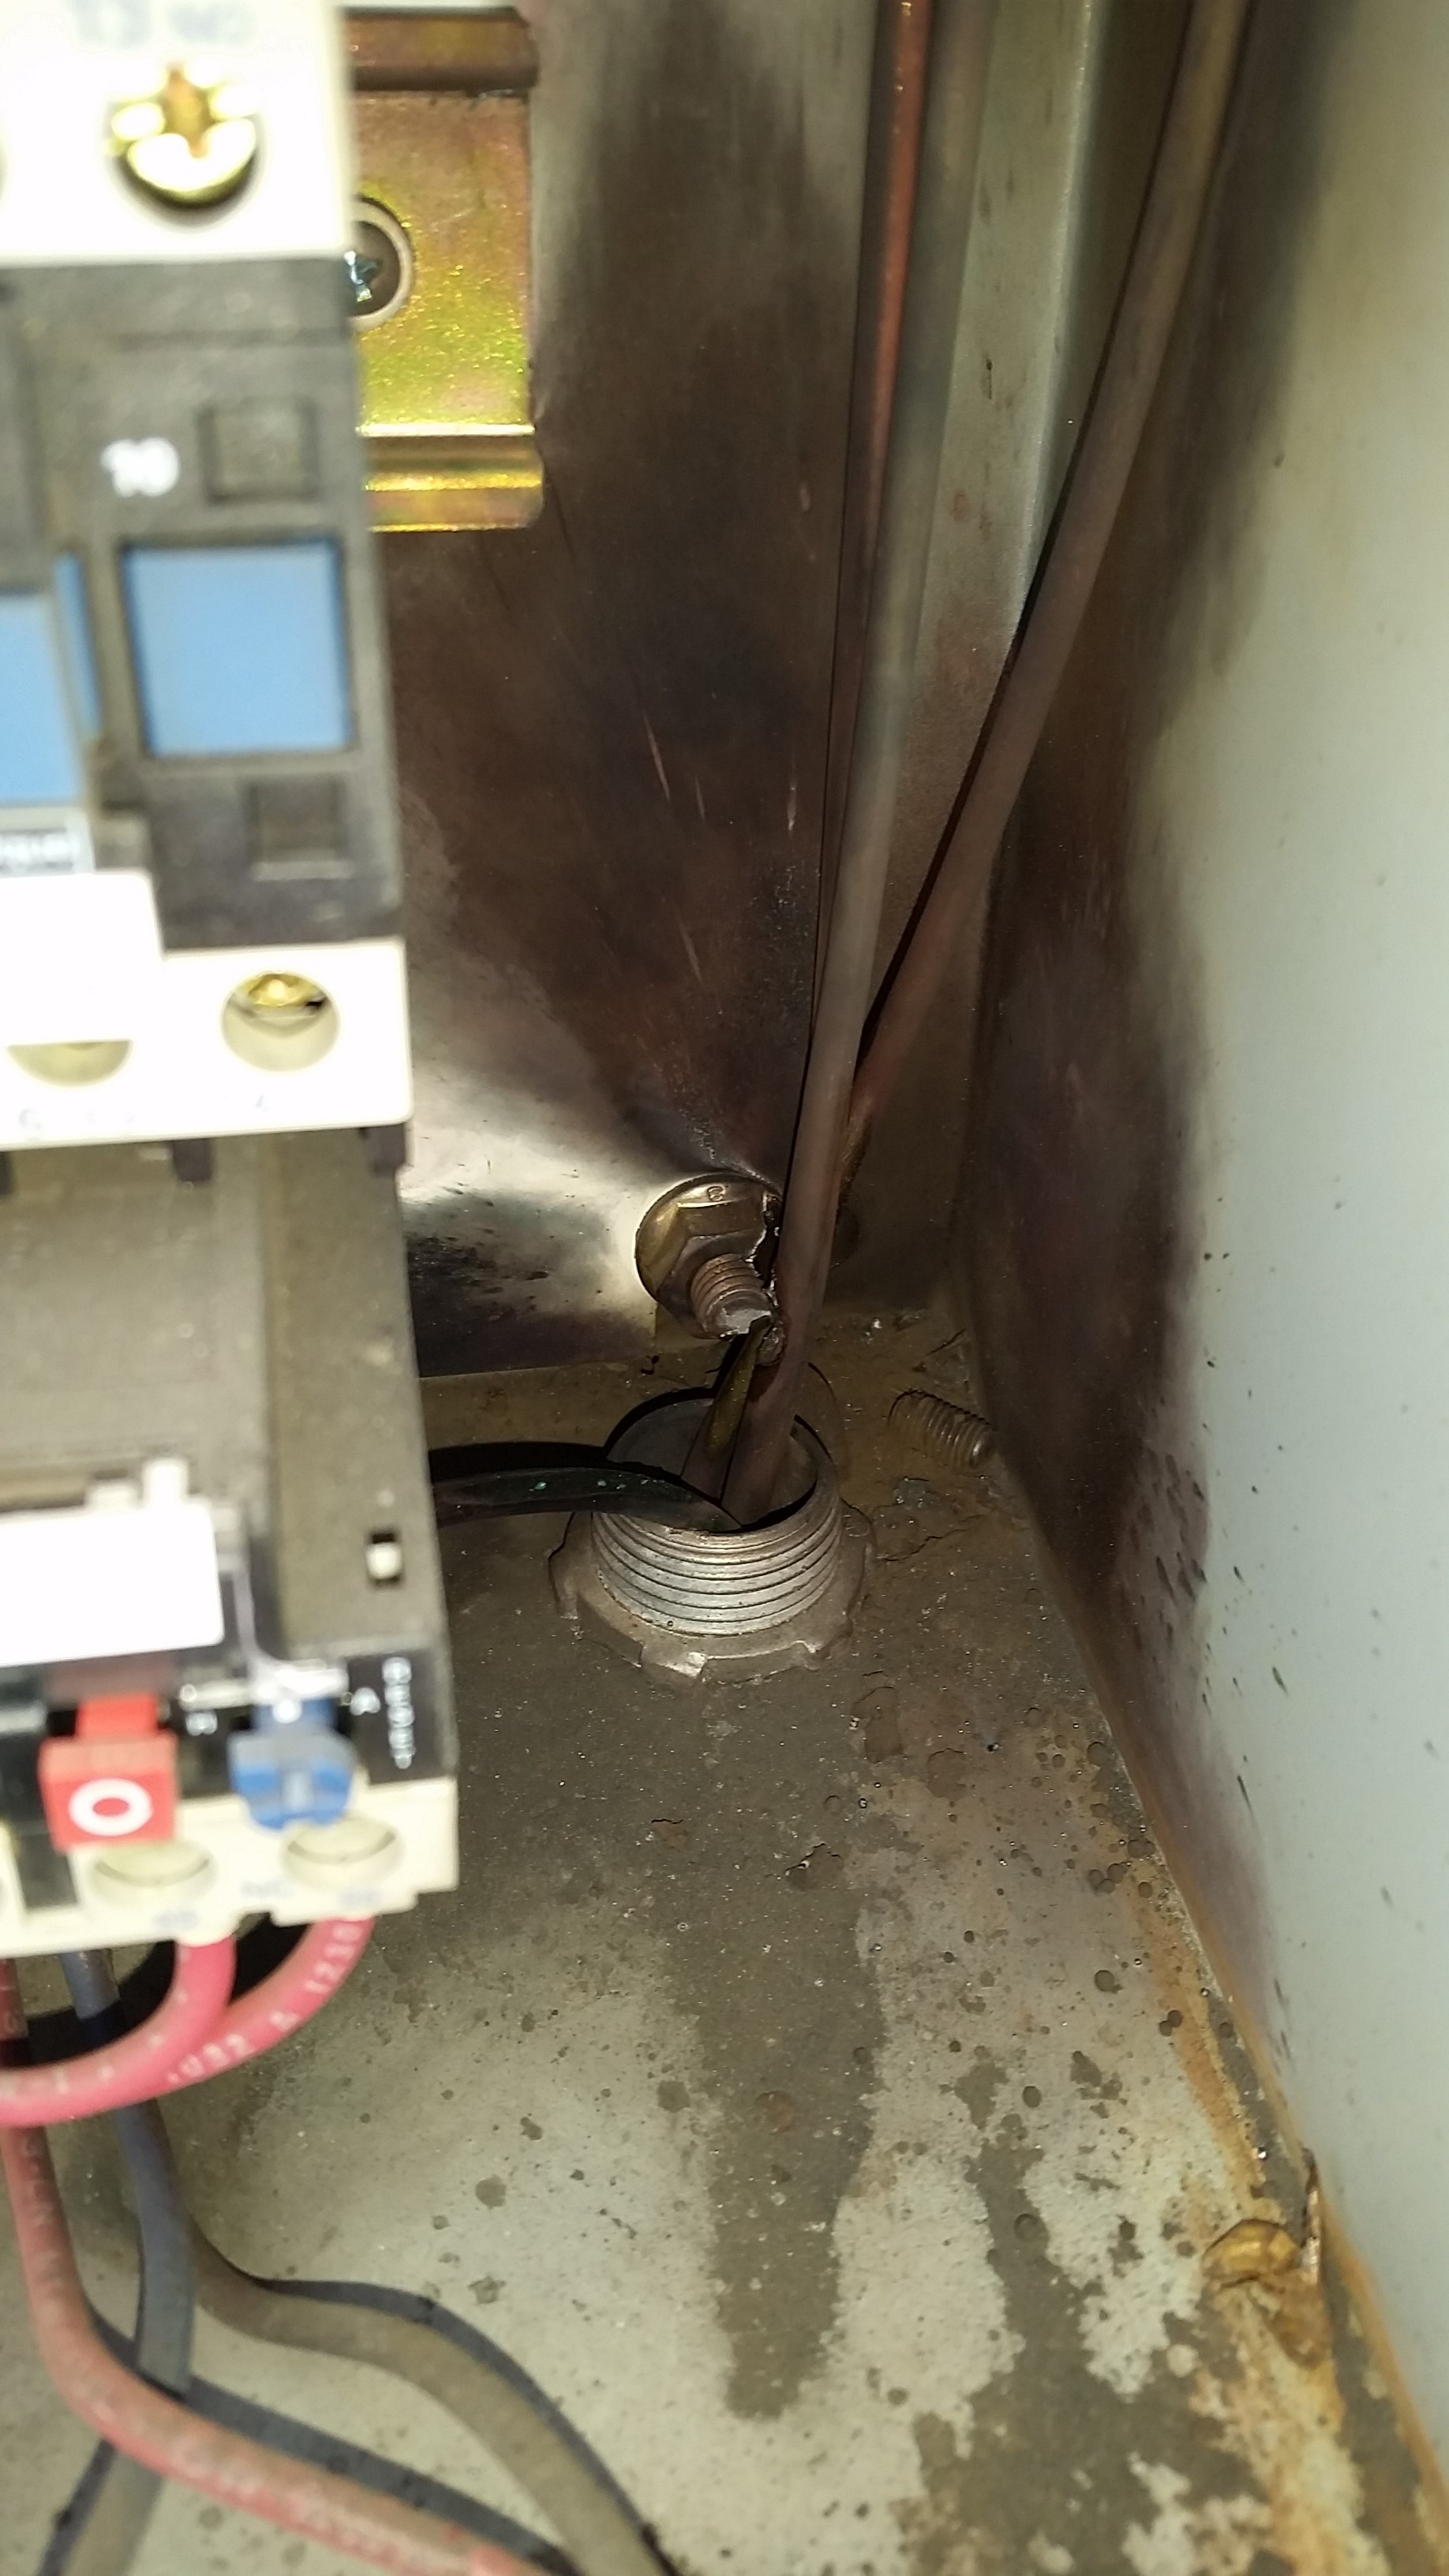
- Then ALS DIFF wouldn't lock. Also took a while to track it down to an ESD that was switched off.
- Next we tried to lock DRMI, but ALS got kicked during locking transients. We first suspected the BS OPLEVs, but they were fine. Turns out the SRCL FF was left on - so SCRL kicked the ITMs. We updated the down script to turn FF off.
- After all that the alignment had drifted enought than we needed to realign the corner, which then was enough to lock DRMI.
- Next DRMI always lost lock on ASC engaging. Turns out the input matrix element for MICH_P was not properly set up (two lines of code were commented out)
- With that we reached DRMI_LOCKED, and continued all the way to DARM_OFFSET.
- Finally ENGAGE_ASC_PART1 failed, due to a run away PR3 YAW loop.
That's there we left it for the day.