patrick.thomas@LIGO.ORG - posted 14:35, Tuesday 12 April 2016 (26551)
Accidently disabled CDS NIC on h0veex
Drove to end X and re-enabled it.
Drove to end X and re-enabled it.
I noticed during my site inspection that the X-mid in-house vacuum cleaner was running for some unknown reason -> I unplugged it.
Chandra, Kyle

Chandra noticed that IP8 had shut-down.  The LPC controller was displaying an error "High Voltage not detected" -> This error isn't listed in the "list of error codes" but was the result of a loose HV connector in the back of the controller -> Deenergized controller, reseated connectors, pwrd on - OK now.
After a LN2 delivery the liquid level control valve setting was lowered to 18%, previous setting of 20%.
Per the Ops Daily Checksheet for Tuesday, I reset the following HEPI L4C Watchdogs: HAM3, HAM4, HAM5, ITMx, BS, ETMx, & ETMy.
Have had this alarm since about 3:39am (10:39utc).
(However, not sure what channels this is looking at. HAM6 is hovering around 10^-5 Torr, but it's been trending low since yesterday afternoon.)
The light level on the first loop power stabilisation photodiodes was adjusted to
give ~9.6V on PDA and ~10.2V on PDB.  Other than (mis)aligning each photodiode there
is no way to adjust the output of each separately as the half waveplate is common
in both paths.

We tried engaging the power stabilisation servo without success.

The DC output voltage of the photodiodes reported on the MEDM screen are different from
those measured by a voltmeter.  Even though these DC values are calculated from the AC
output, once the value exceeds ~7V the discrepancy becomes quite large with 10V as
measured with a voltmeter being reported as ~6V on the MEDM screen.


Jason, Peter
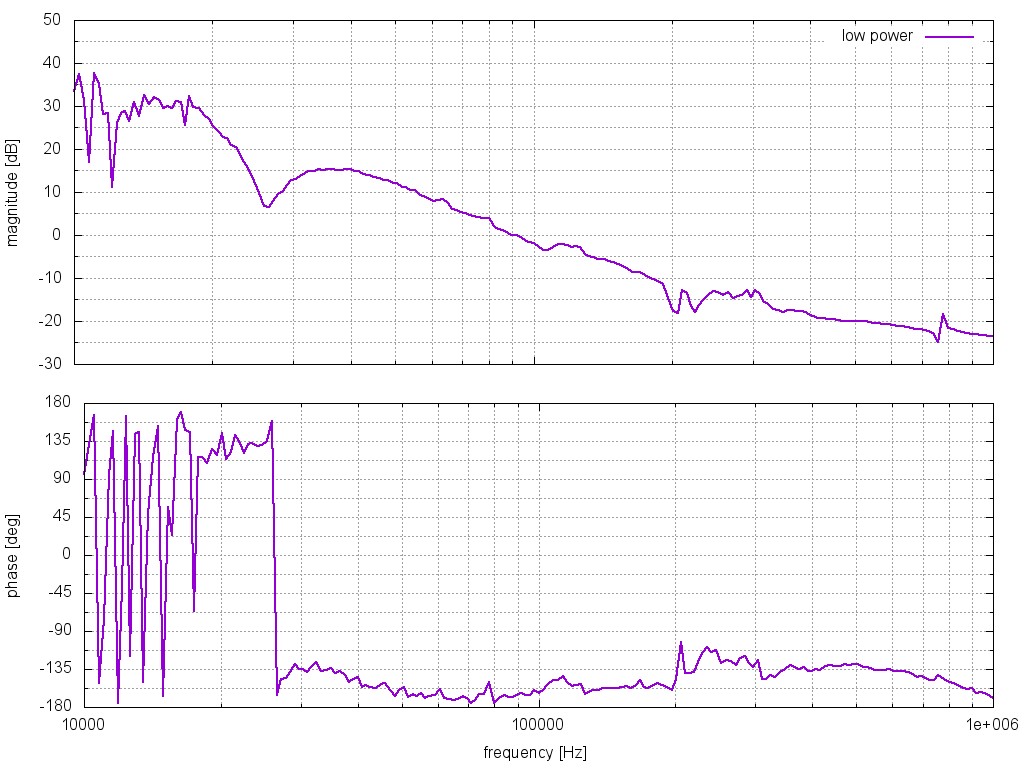
The transfer function measurement of the frequency stabilisation servo are attached.
The unity gain frequency is ~180 kHz with a phase margin of ~25 degrees.  Recall that
because of the way the readout monitor ports are, the unity gain should read at -10dB.

The measured values are a little lower than what was measured with just the front end
laser running.  Although not too far off.

Not quite sure what the dip in the magnitude around 25.5 kHz is but it might be related
to the injection locking electronics.

The current gain slider settings are fast gain = 22 dB, common gain = 16 dB.  The output
of the RF photodiode is 50-60 mV locked, 230-320 mV unlocked.


Jason, Peter
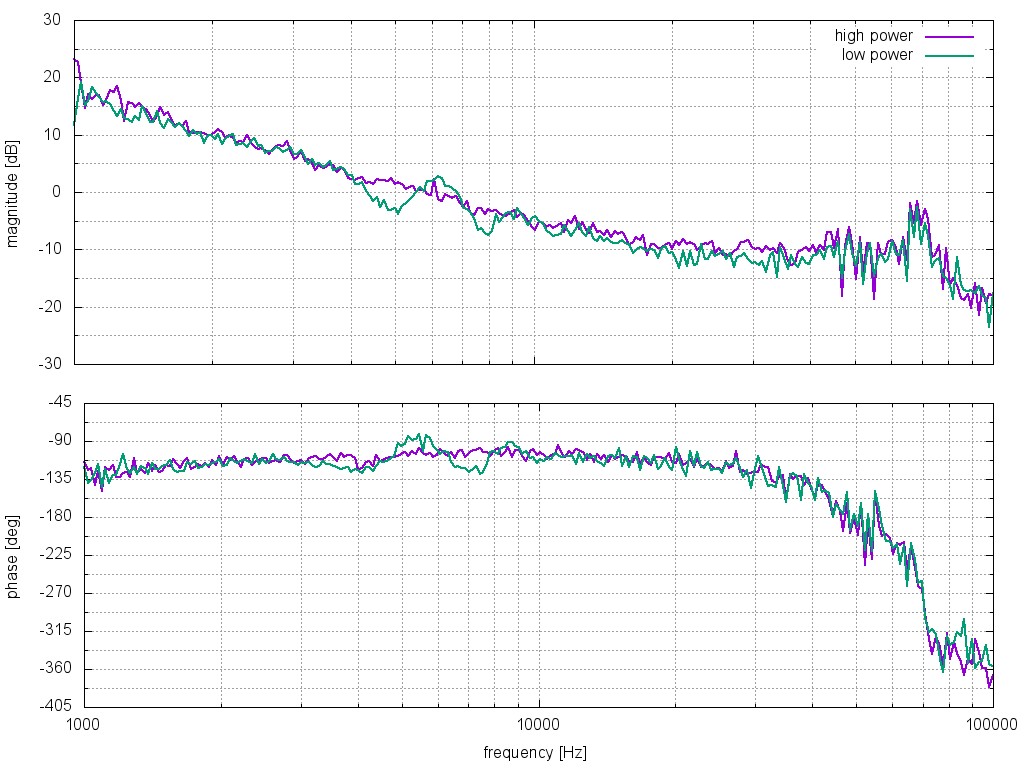
The power incident on the pre-modecleaner was increased from ~30W to ~138W.
The power transmitted by the pre-modecleaner, as measured by a power meter
located right after the pre-modecleaner, was ~123W.  This is consistent with
the visibility measurement conducted last week.

The transfer function for the low and high power modes are similar.  In the
high power mode, the unity gain frequency was ~6 kHz with a phase margin of
~ 80 degrees.

There is a problem with the transmission photodiode.  Whilst the filter
file for the photodiode appears to be okay, the output of the photodiode is
not consistent with the amount of incident light.  For the factor of ~4
increase in light power we observed an increase of less than 1 in the
photodiode output.  This problem does not show up in the low power mode.
The photodiode was given a cursory inspection and appears to be okay.  The
signal cable was temporarily swapped but made no difference.

This is a 2mm InGaAs photodiode (D1002929).  I suspect one of the voltage
regulators is sporadic.  Perhaps the LM317S providing the bias voltage.
This will be checked later today.

Jason, Peter
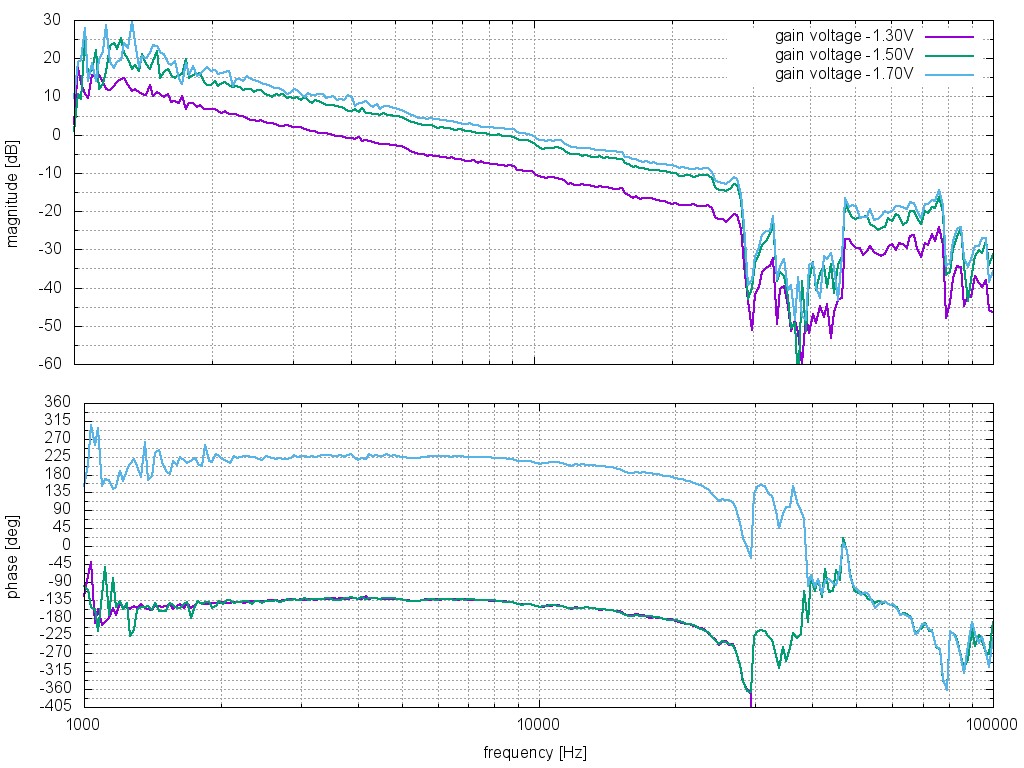
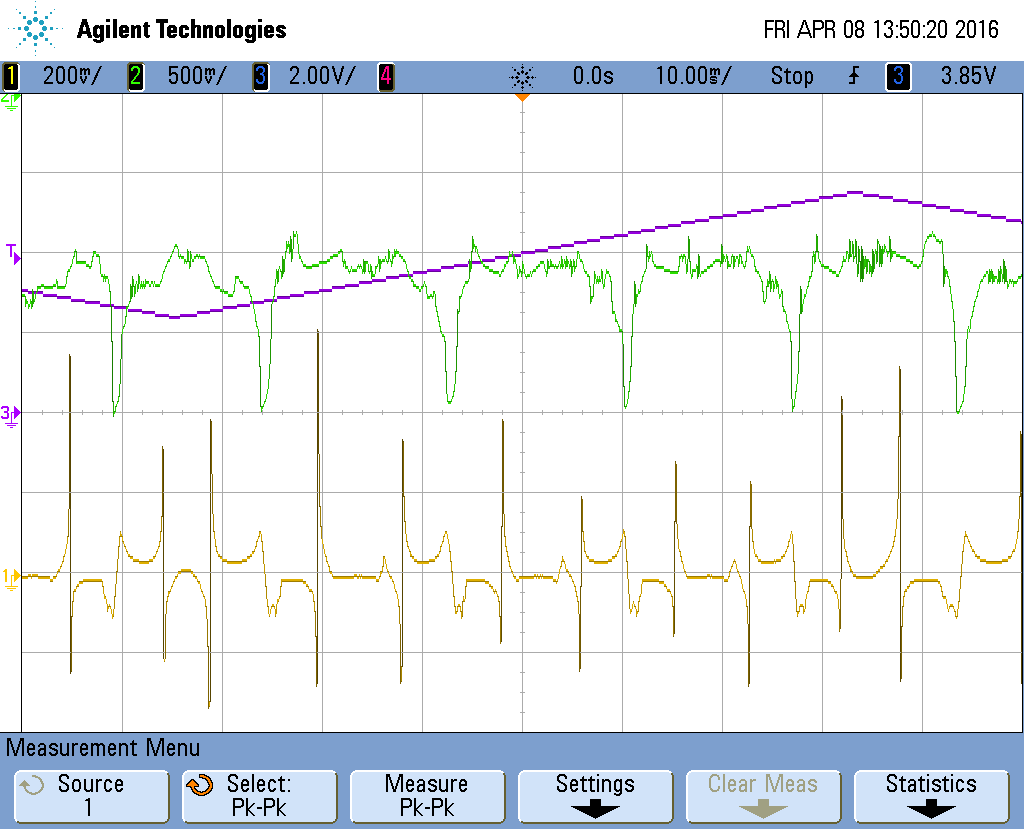
Transfer functions of the injection locking servo electronics were taken.
The previous measurements from when the PSL underwent acceptance testing
are posted in the DCC under
  https://dcc.ligo.org/DocDB/0100/E1300129/001/tf.pdf
That result listed the unity gain and phase margin as being 2.8 kHz and
57 degrees respectively.

With the previous setting of gain = -1.50V, the unity gain is ~8.5 kHz
with about 40 degrees of phase margin.  Setting the gain to -1.70V, upped
the unity gain to ~10 kHz.  This is consistent with the acceptance test
result from L1, which is in the DCC under
  https://dcc.ligo.org/DocDB/0068/E1100716/006/injection_locking_tf.pdf

Also attached is the oscilloscope image of the injection locking error
signal.


Jason, Peter
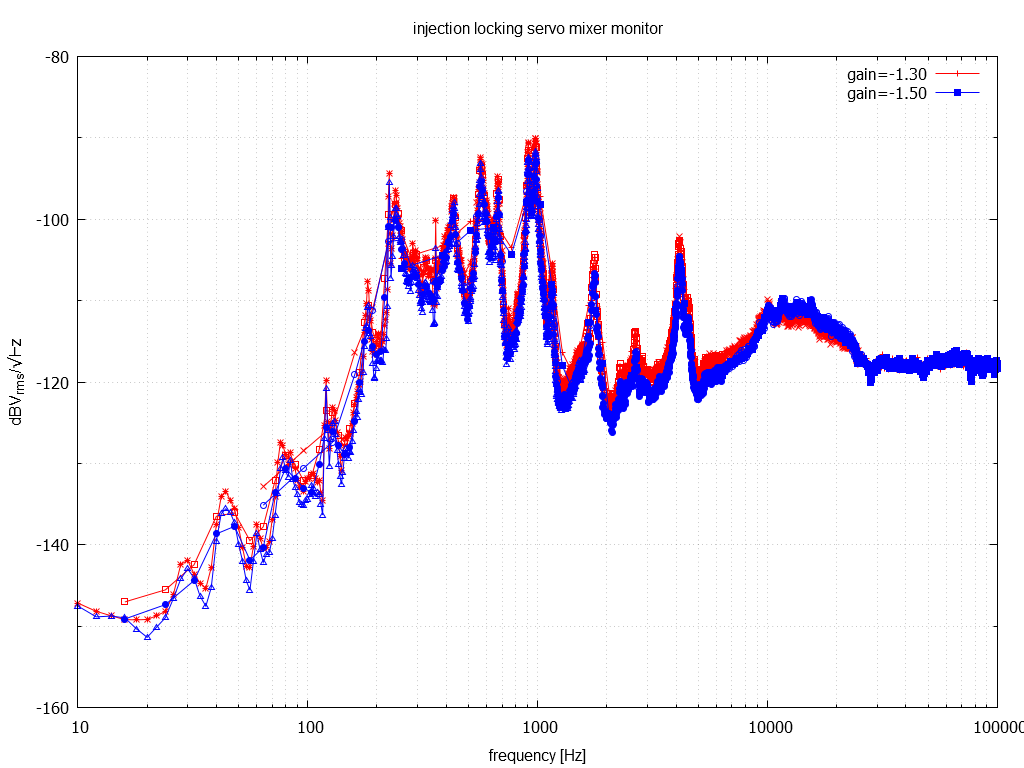
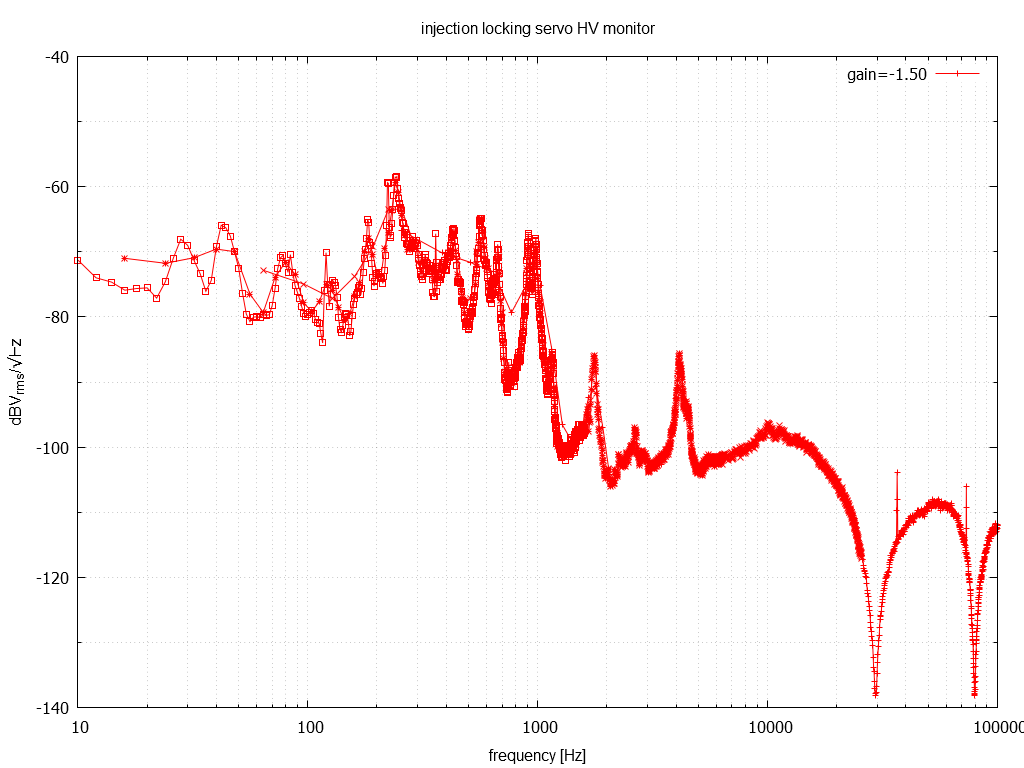
Attached are spectra of the injection locking servo mixer monitor and
high voltage monitor output.
C. Cahillane

I have generated a C01 and C02 calibration systematic error spectrogram for all of O1.

The spectrogram takes the calibration from every day of O1. The frequency vector goes from 5 to 3000 Hz.
These plots are preliminary because my veto definer files do not veto all bad times, so I still have to hack together some vetoes of my own.  This is mostly a concern for the LHO C01 plots.  This will be resolved ASAP.

The plots have dashed blue lines at Sep 14 2015, Oct 11 2015, and Dec 26 2015.
For reference I have included LHO Dec 26 Uncertainty Budgets for both C01 and C02.  These should correspond to the third dashed blue line in the spectrogram.

Next, once the vetoes are properly applied, I will post revamped systematic error spectrograms alongside Total O1 Uncertainty Budgets.  Without the correct vetoes my Total O1 Budgets are not yet useful.

For the LLO All of O1 Calibration Spectrograms, please see LLO aLOG 25618
Log:
01:30 Evan and Craig back from EY
~09:00 Japanese film crew came back to report that they left two cameras on the hill along the Y arm between "4th and 5th door" (door counting from corner station). That's somewhere between corner station and mid Y.
Kyle, Gerardo, Chandra

Received HV pump cables and custom length power cords that had been ordered last week -> HAM7, BSC4 and HAM12 annulus pumps started today -> pump carts moved from HAM9 to HAM8 and BSC4 to HAM6.

Gerardo
Routed and terminated CDS signal cables to HAM7 and HAM12 annulus ion pump controllers

Kyle
Pumping HAM5/HAM6 annulus volume with pump carts at each pump port -> Energized HAM5 and HAM6 ion pump controllers
Kyle, Chandra

Opened valves that were soft closed a week ago.
GV 7 needed 40 psig. GV 5 needed 45 psig to open.

Attached is plot of pressures on either side of each valve before and after opening. Before we realized to pump the gate annulus after a week, we had already set pressure against pistons to 20 psig, shifting gate slightly and releasing annulus gas into beam tube.
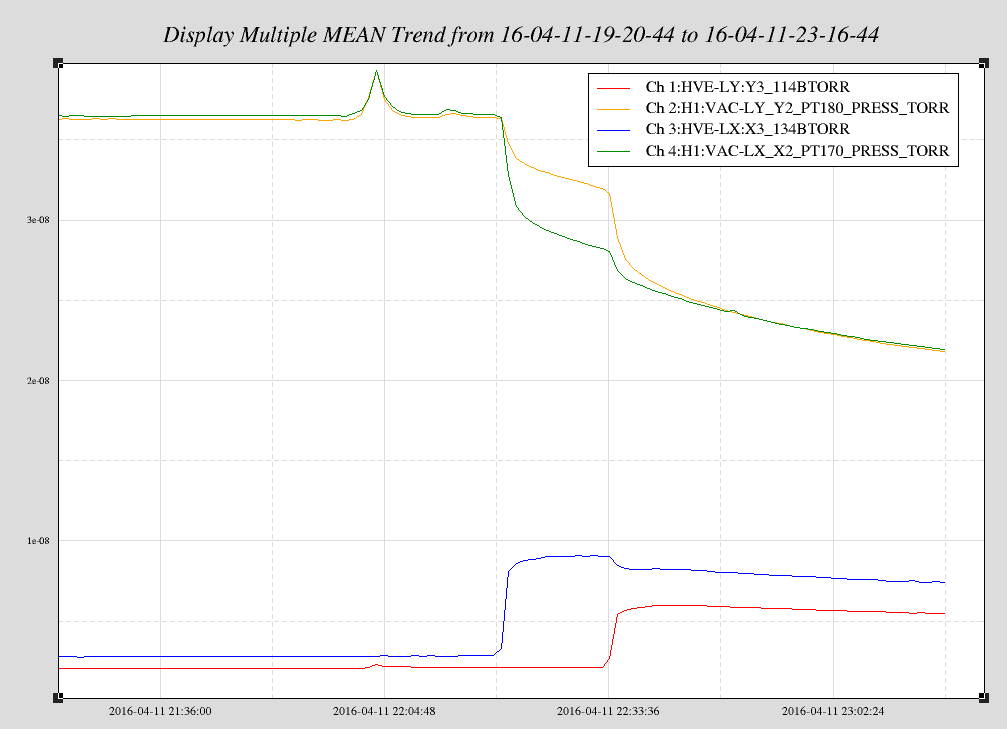
The take away from this observation is that O-rings of GV5 and GV7 must have been in full contact with their sealing surface whilst soft-closed, i.e with 5 - 10 psi applied to the top of their pistons.  This is as intended.  Had they not been in full contact, the gate annulus volumes would have been pumped by the adjacent vacuum volume(s) and no gas release would have occurred when the gates where stroked open.  Typically we would have "burped" the un-pumped gate annulus volume into the rest of the annulus piping before opening the gate valves.

In summary, soft-closing GV5 and GV7 does provide protection to the Beam Tubes.
John, Patrick, Richard

The EPICS state code that controls the enabling and disabling of the cold cathode gauges was not installed for the gauges that got added to HAM1 and HAM6 (PT100 and PT110). However, the on/off toggle buttons on the medm screens for these gauges were writing to the state code request channels. This is why toggling these buttons had no effect. I updated the H0VE_LX_Y0.adl and H0VE_LY_X0.adl medm screens to use the channels that output directly to hardware instead of the state code request channels:

request channel        hardware channel
HVE-LY:X0_HSCCONOFF -> HVE-LY:X0_HS100
HVE-LX:Y0_HSCCONOFF -> HVE-LX:Y0_HS110
Kyle, Chandra

Pumped down HAM6 from atmosphere to 0.5 Torr in 3 hrs.
Turned turbo pump ON. It tripped once (overload) after many minutes of spinning up.
Restarted turbo; it came up to speed in normal time. It felt hot to the touch so we placed a fan near it.

Current HAM6 pressure = 4.5e-5 Torr
Day's Activities:
"Operator note: One can tell if Beckhoff goes down by looking at the Slow Controls section on the CDS Overview....if anything is frozen, it's not running."
As a reminder, the DIAG_MAIN has a test to look for exactly that. Though, it has become saturated and lit up from all of the vent and PSL work going on.

The reason for the repetition of this alarm is that the the channel HVE-LX:Y0_110BTORR has been passing through the threshold value (1e-5) since about 10:35 UTC. When we vented it just reported this alarm once, as it should, and then stayed "in alarm" until now. As it has been pumped down, it will switch from being "in alarm" to no alarm and then back forth again. I have turned off Verbal for now as to not annoy the entire control room. The point of the vacuum system alarm in the Verbal system is not necessarily to catch a failure of some sort, the vacuum and CDS teams already have a system in place to alert any sudden changes of pressure and inform the correct people. Rather, it is just a way to inform the operator that one of these failures have may have occured and to make sure that the correct people have already been informed or that venting has truely began.
A possible fix for this is to average the channels over some time, but taking these averages adds a significant amount of time to the loop. Since venting is a very rare event, I think we can just live with it. I don't see any problems with turning off Verbal for a handful of hours while it settles past this threshold. Option B would be to remove this test from Verbal entirely. As I previously said, the VE system is already monitored by other, more precise, systems but my worry is that the operator may not know if there was something going on.
Attached a trend of the channel .