Following the grouting of the HAM5&6 HEPI piers, and in light of JeffK's work untangling my designs (in LHO alog 26002), I wanted to review the design of the HAM 4/5 S0-1 feedforward. To do this I took a new set of measurements for HAM's 4 and 5 so I could see how similar the different transfer functions were. The measurements I took were: the transmissibility from the FF L4Cs on St0 to the St1 GS13s with the ISI in both damped and isolated states, and the actuator to GS13 tfs in both the isolated and damped states. I got all 24 measurments for HAM4, but I only got the all of the Z measurements for HAM5, so I looked at that dof filter design.
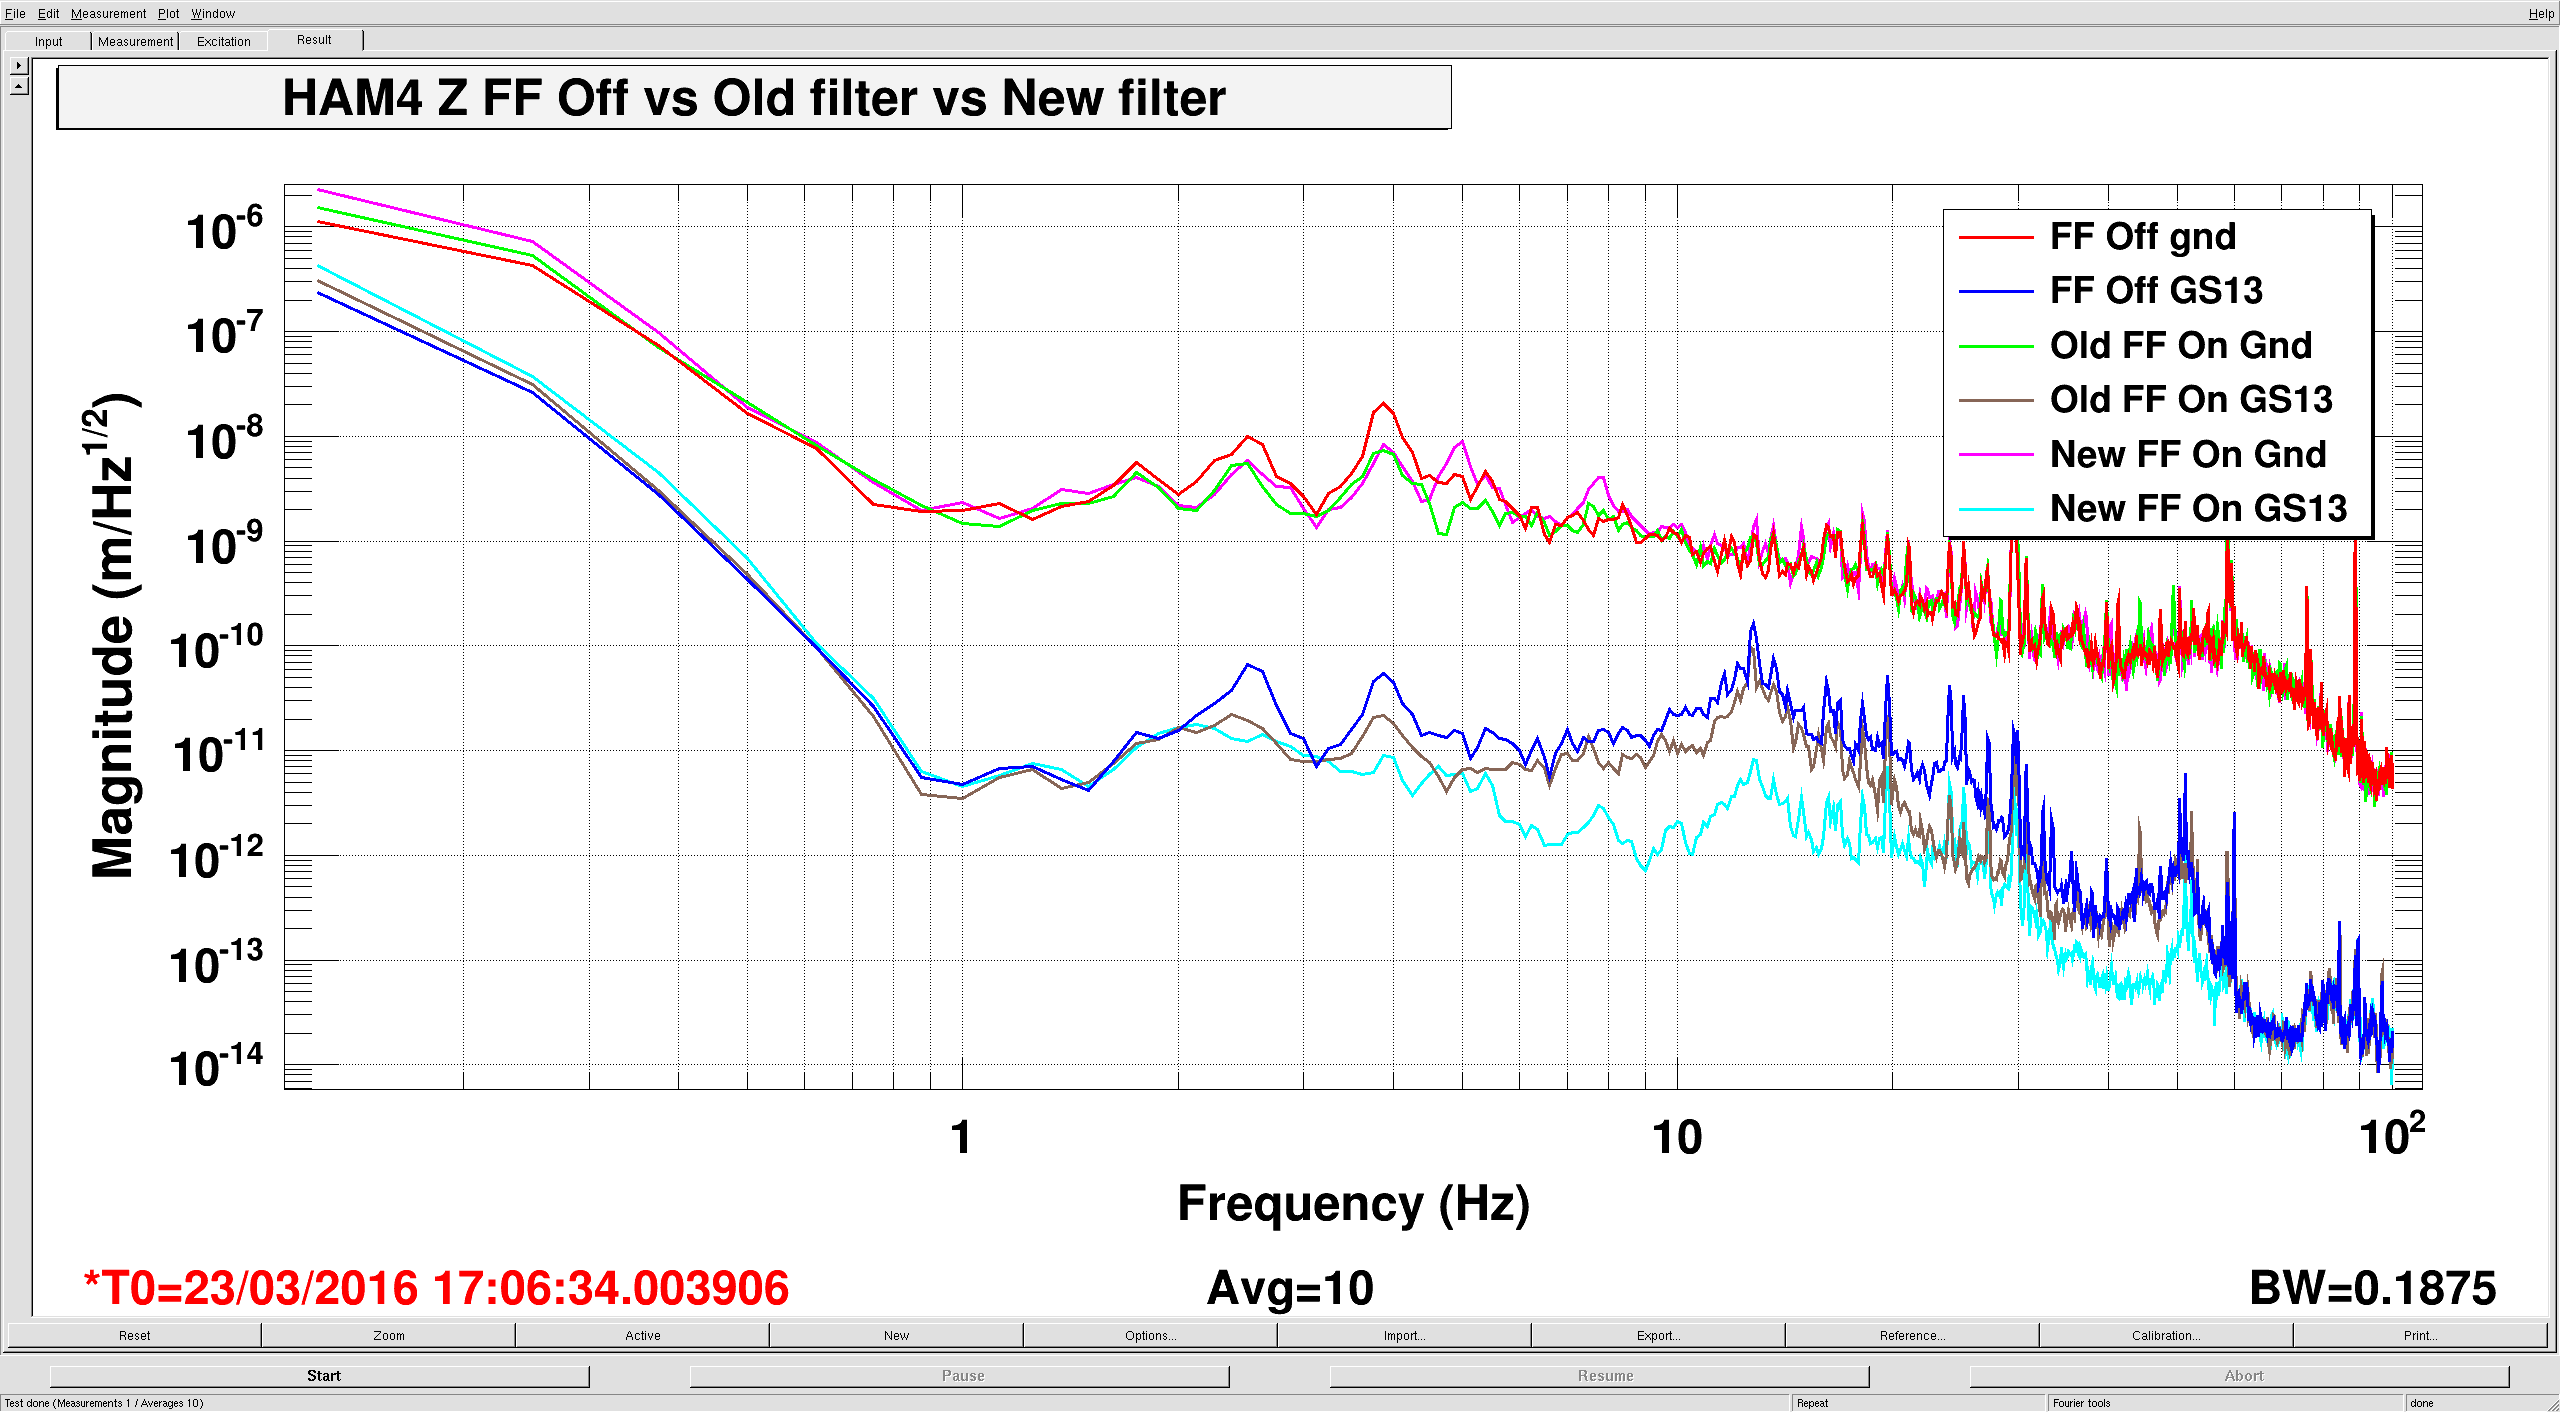
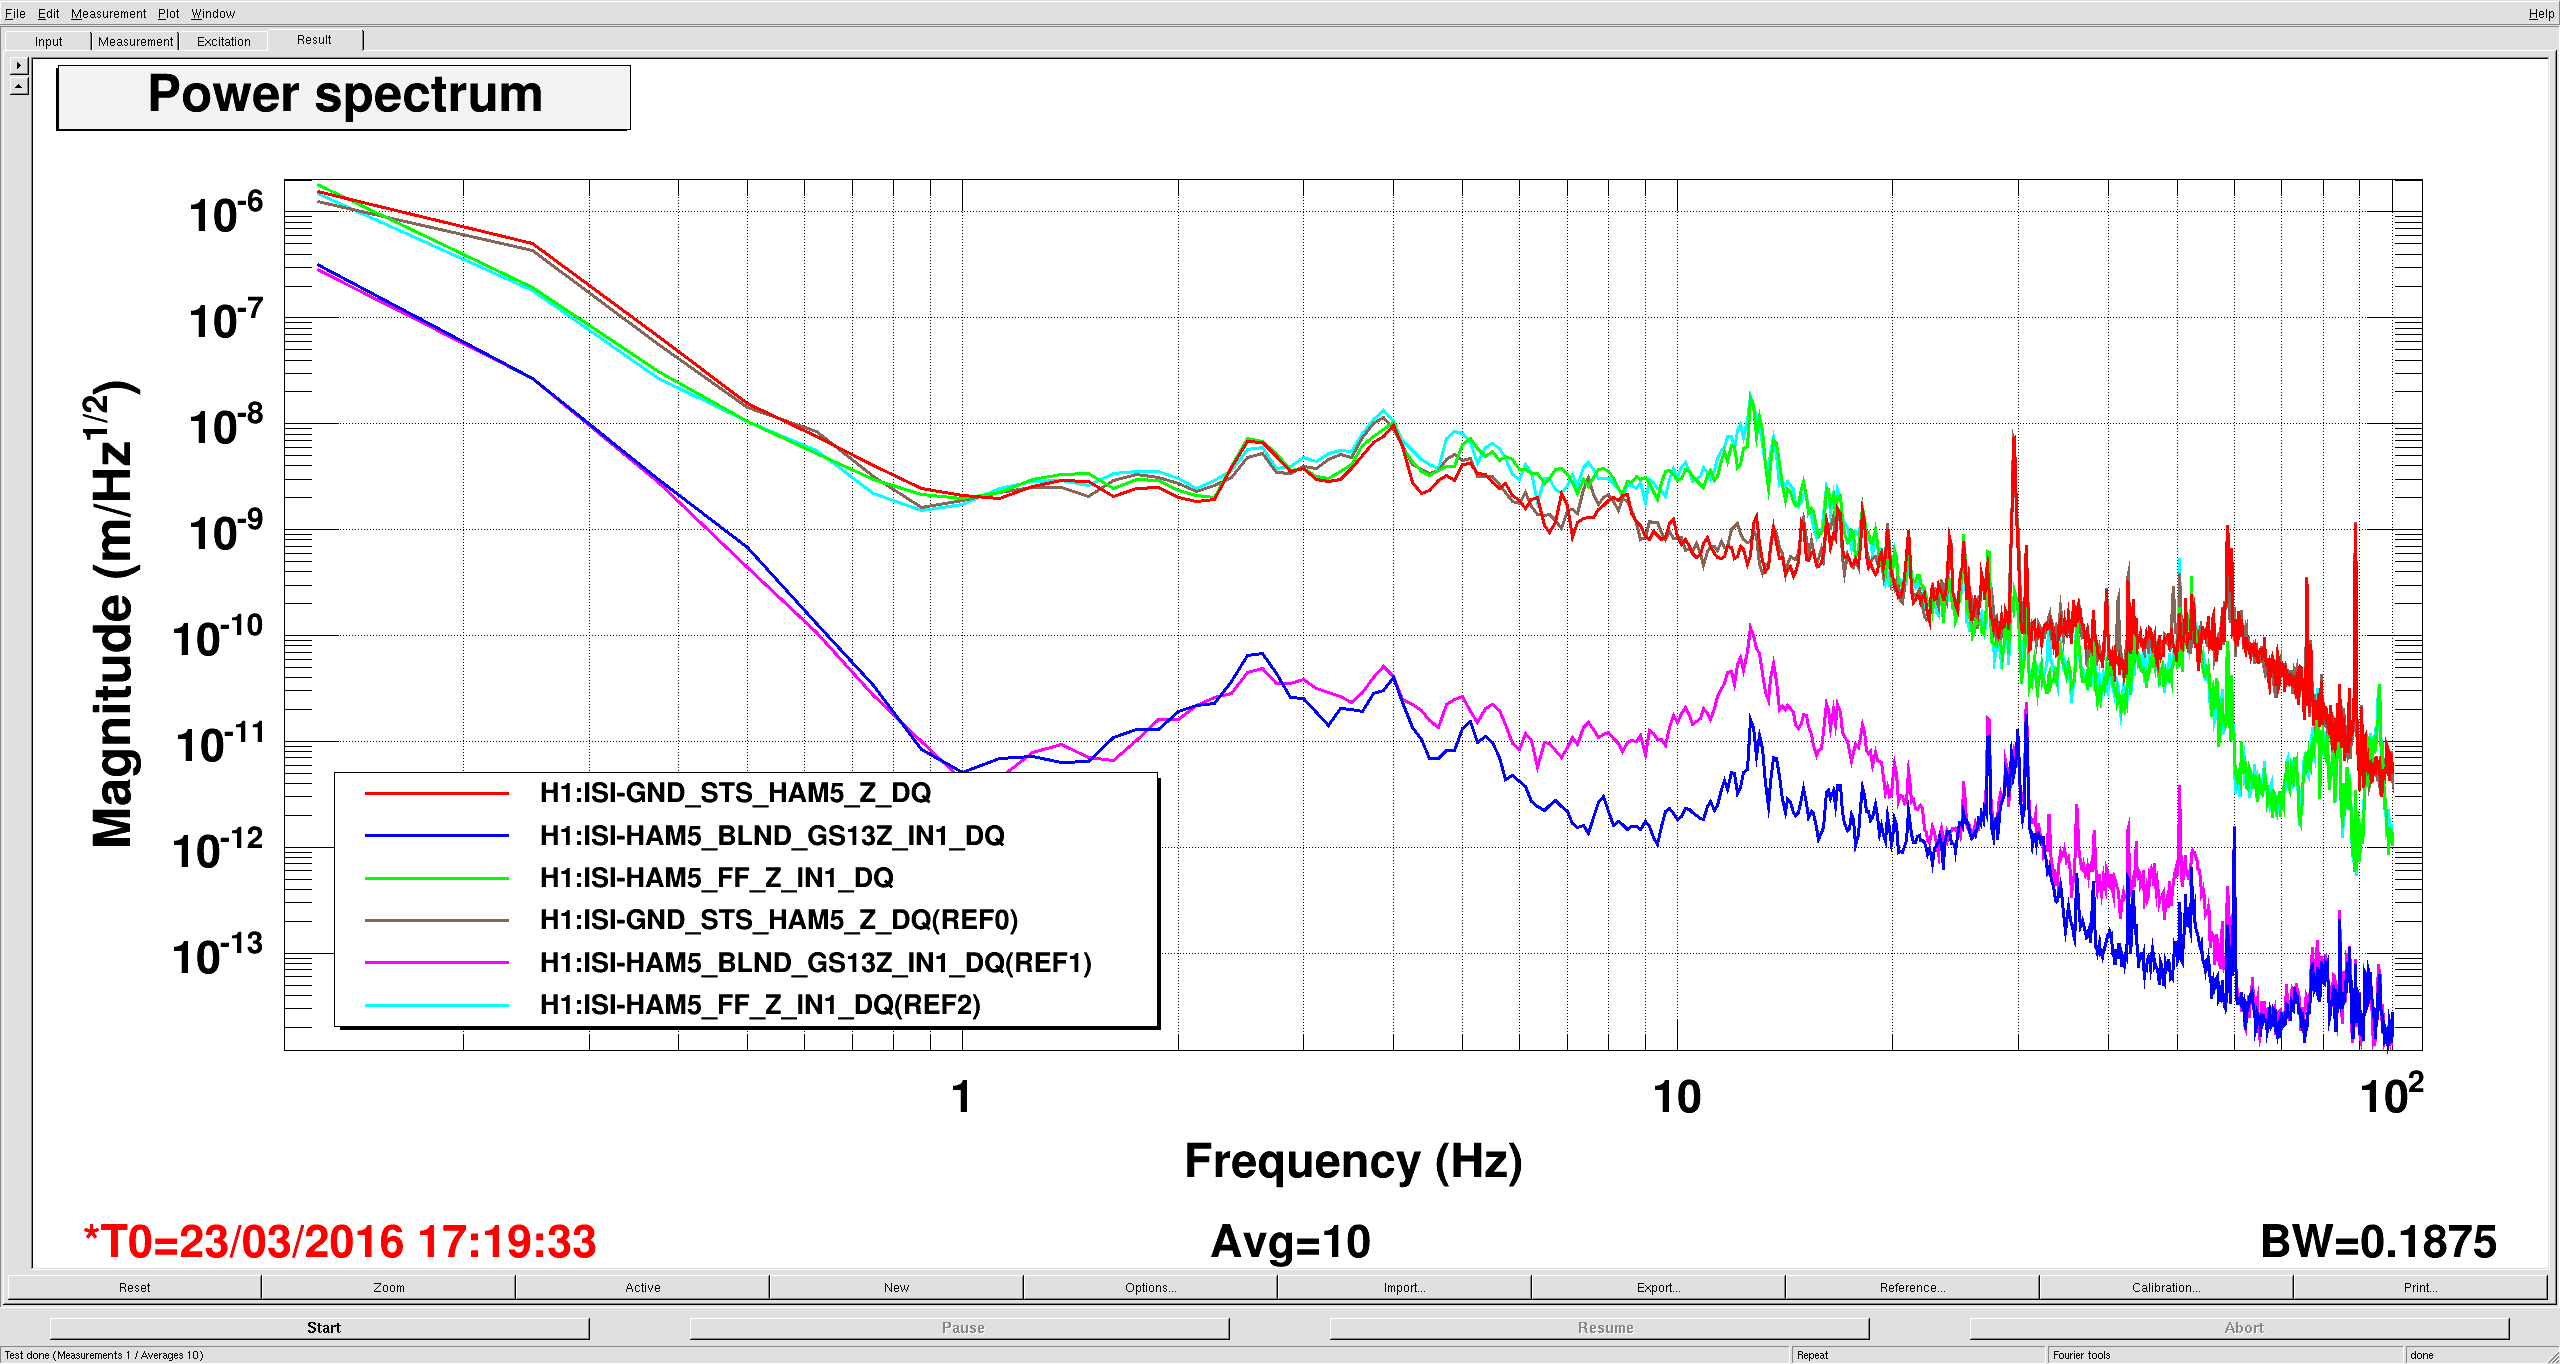
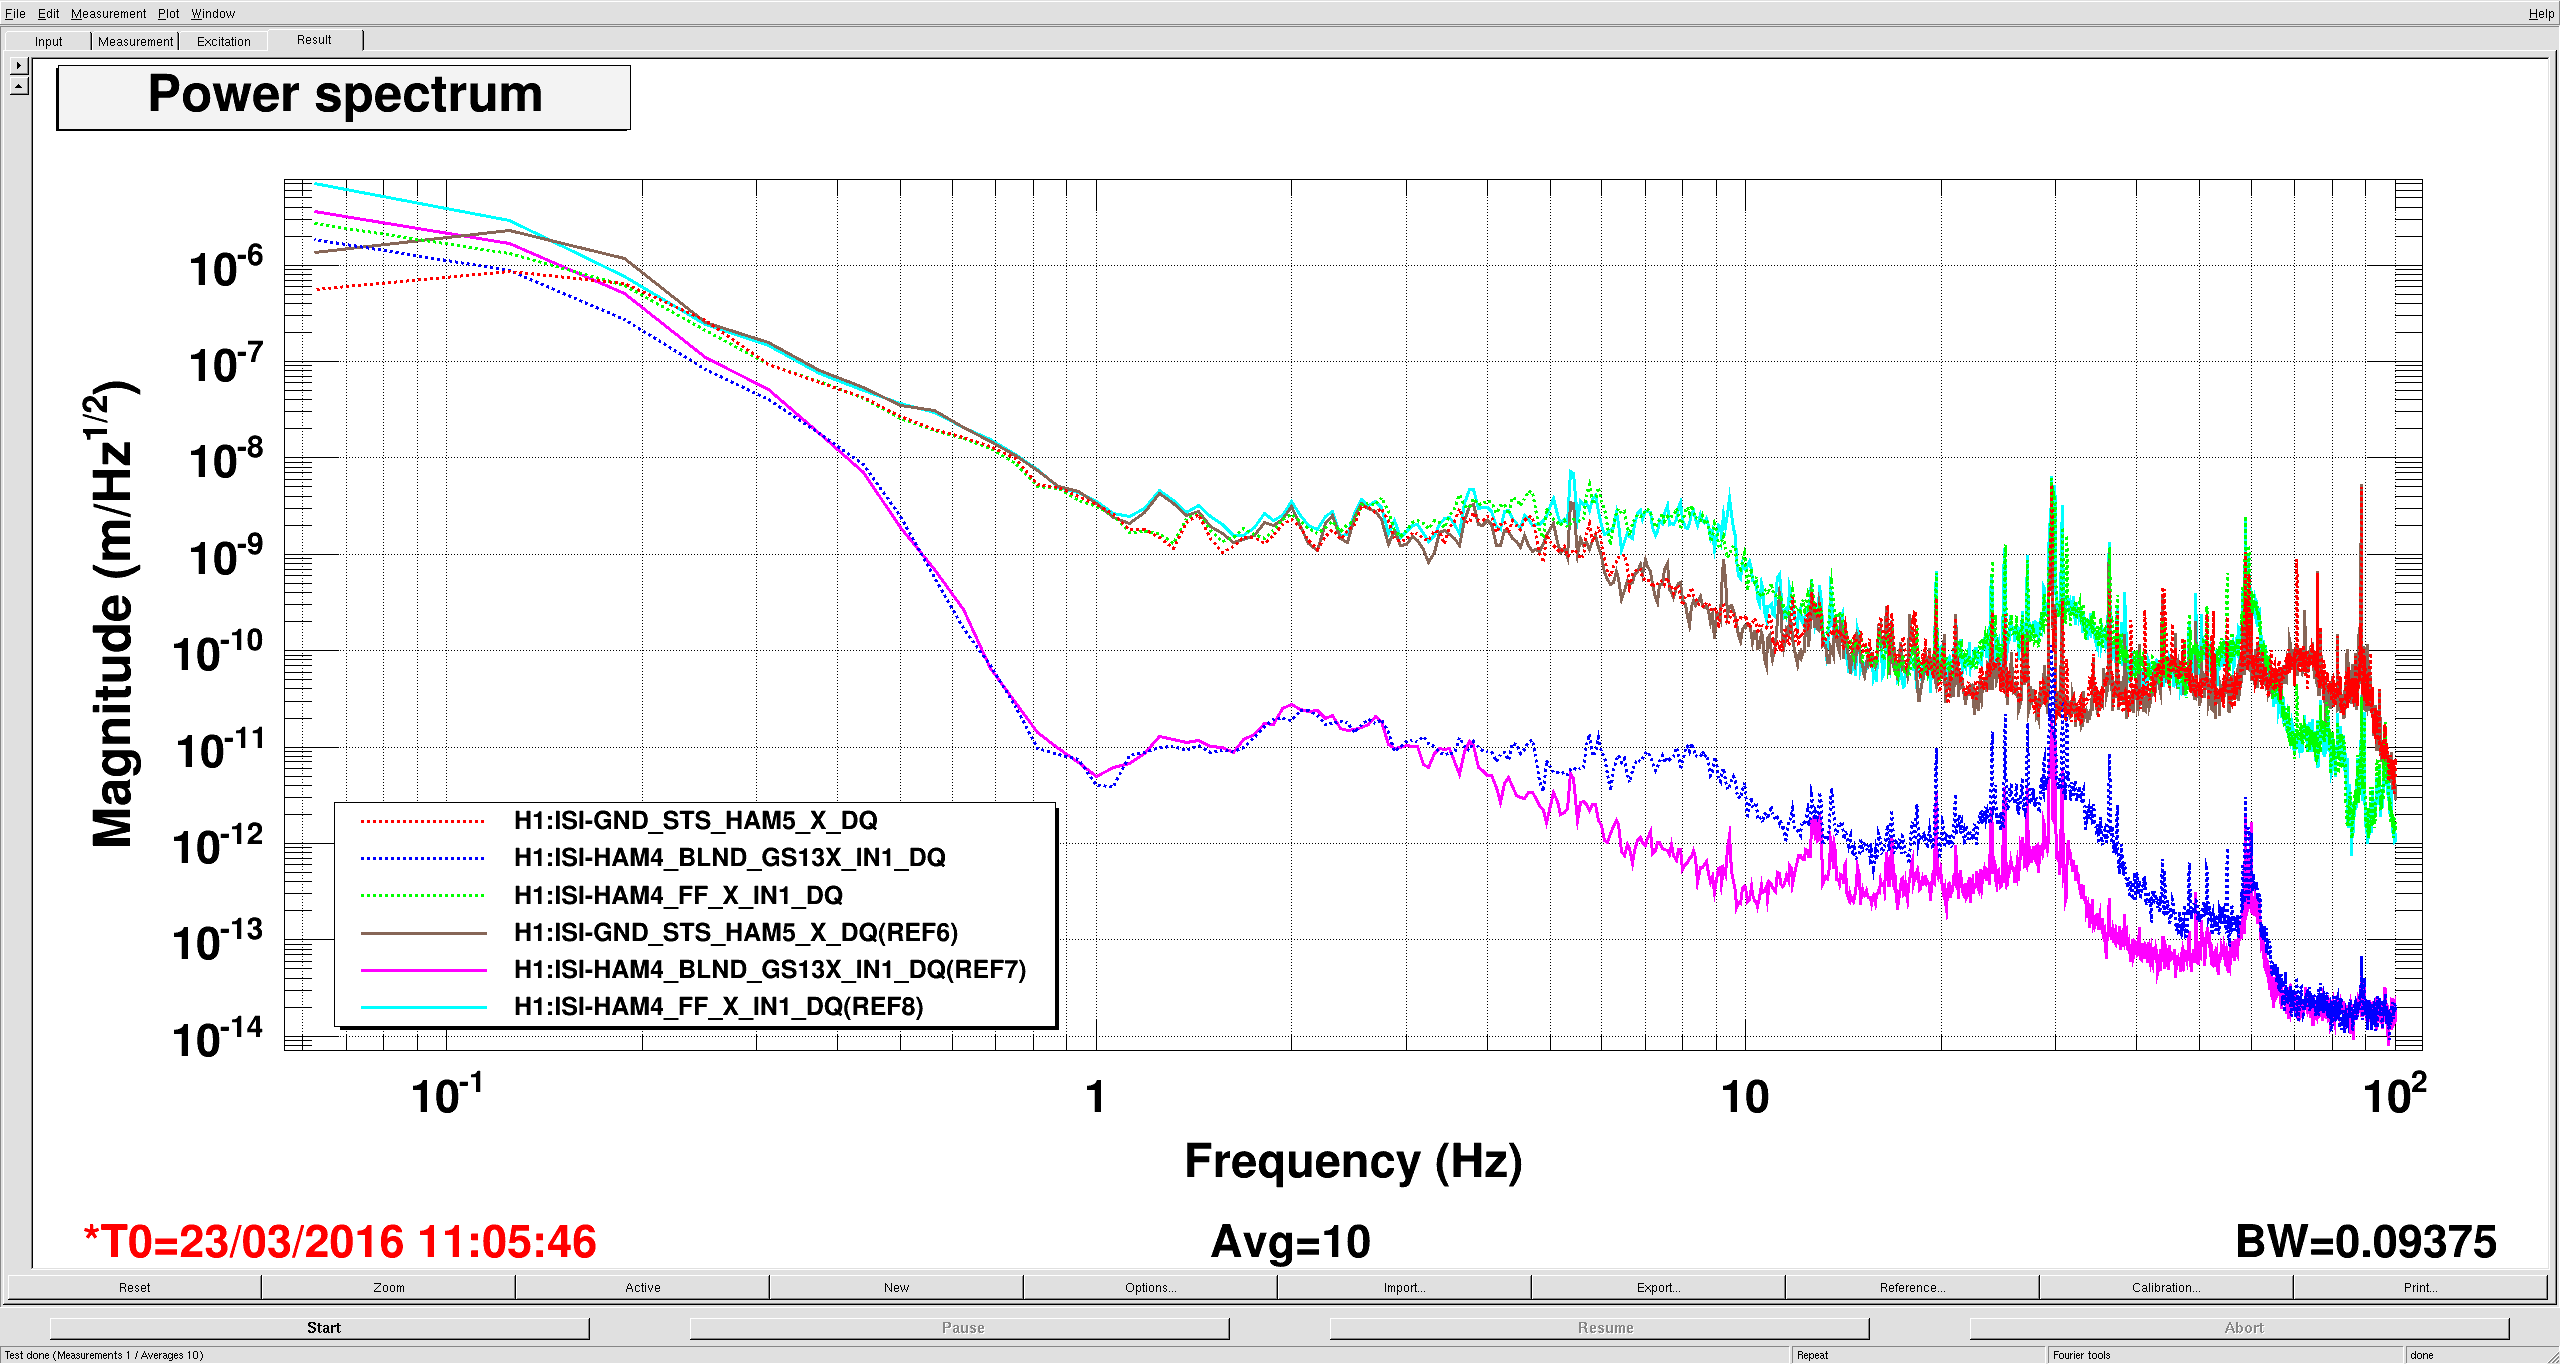
Jumping straight to the punchline (first plot, calibrated ground and GS13 spectra for HAM4) I have a new Z FF filter that does a lot better and makes more sense, installed on HAMs 4&5, and I'm working on similar redesigns for the remaining dofs. The two traces to really look at are brown and light blue, the GS13 measured displacement with the old and new FF filters. Compared to dark blue (FF off), the old FF filter mostly improved motion between 20 and 30 hz and only worked well with a gain of .5, something I couldn't explain when I installed it. The new filter works better from a few hz to almost 60 hz.
The second plot is the transmissibilties for HAM 4 (blue) and 5 (green) in both damped (solid) and isolated(dashed) states. The damped states are very similar, though I'm not sure why there is a gain difference. The Isolated tf's are more different, but probably it's probably due to some differences in the feedback loops, I should probably take a look at that.
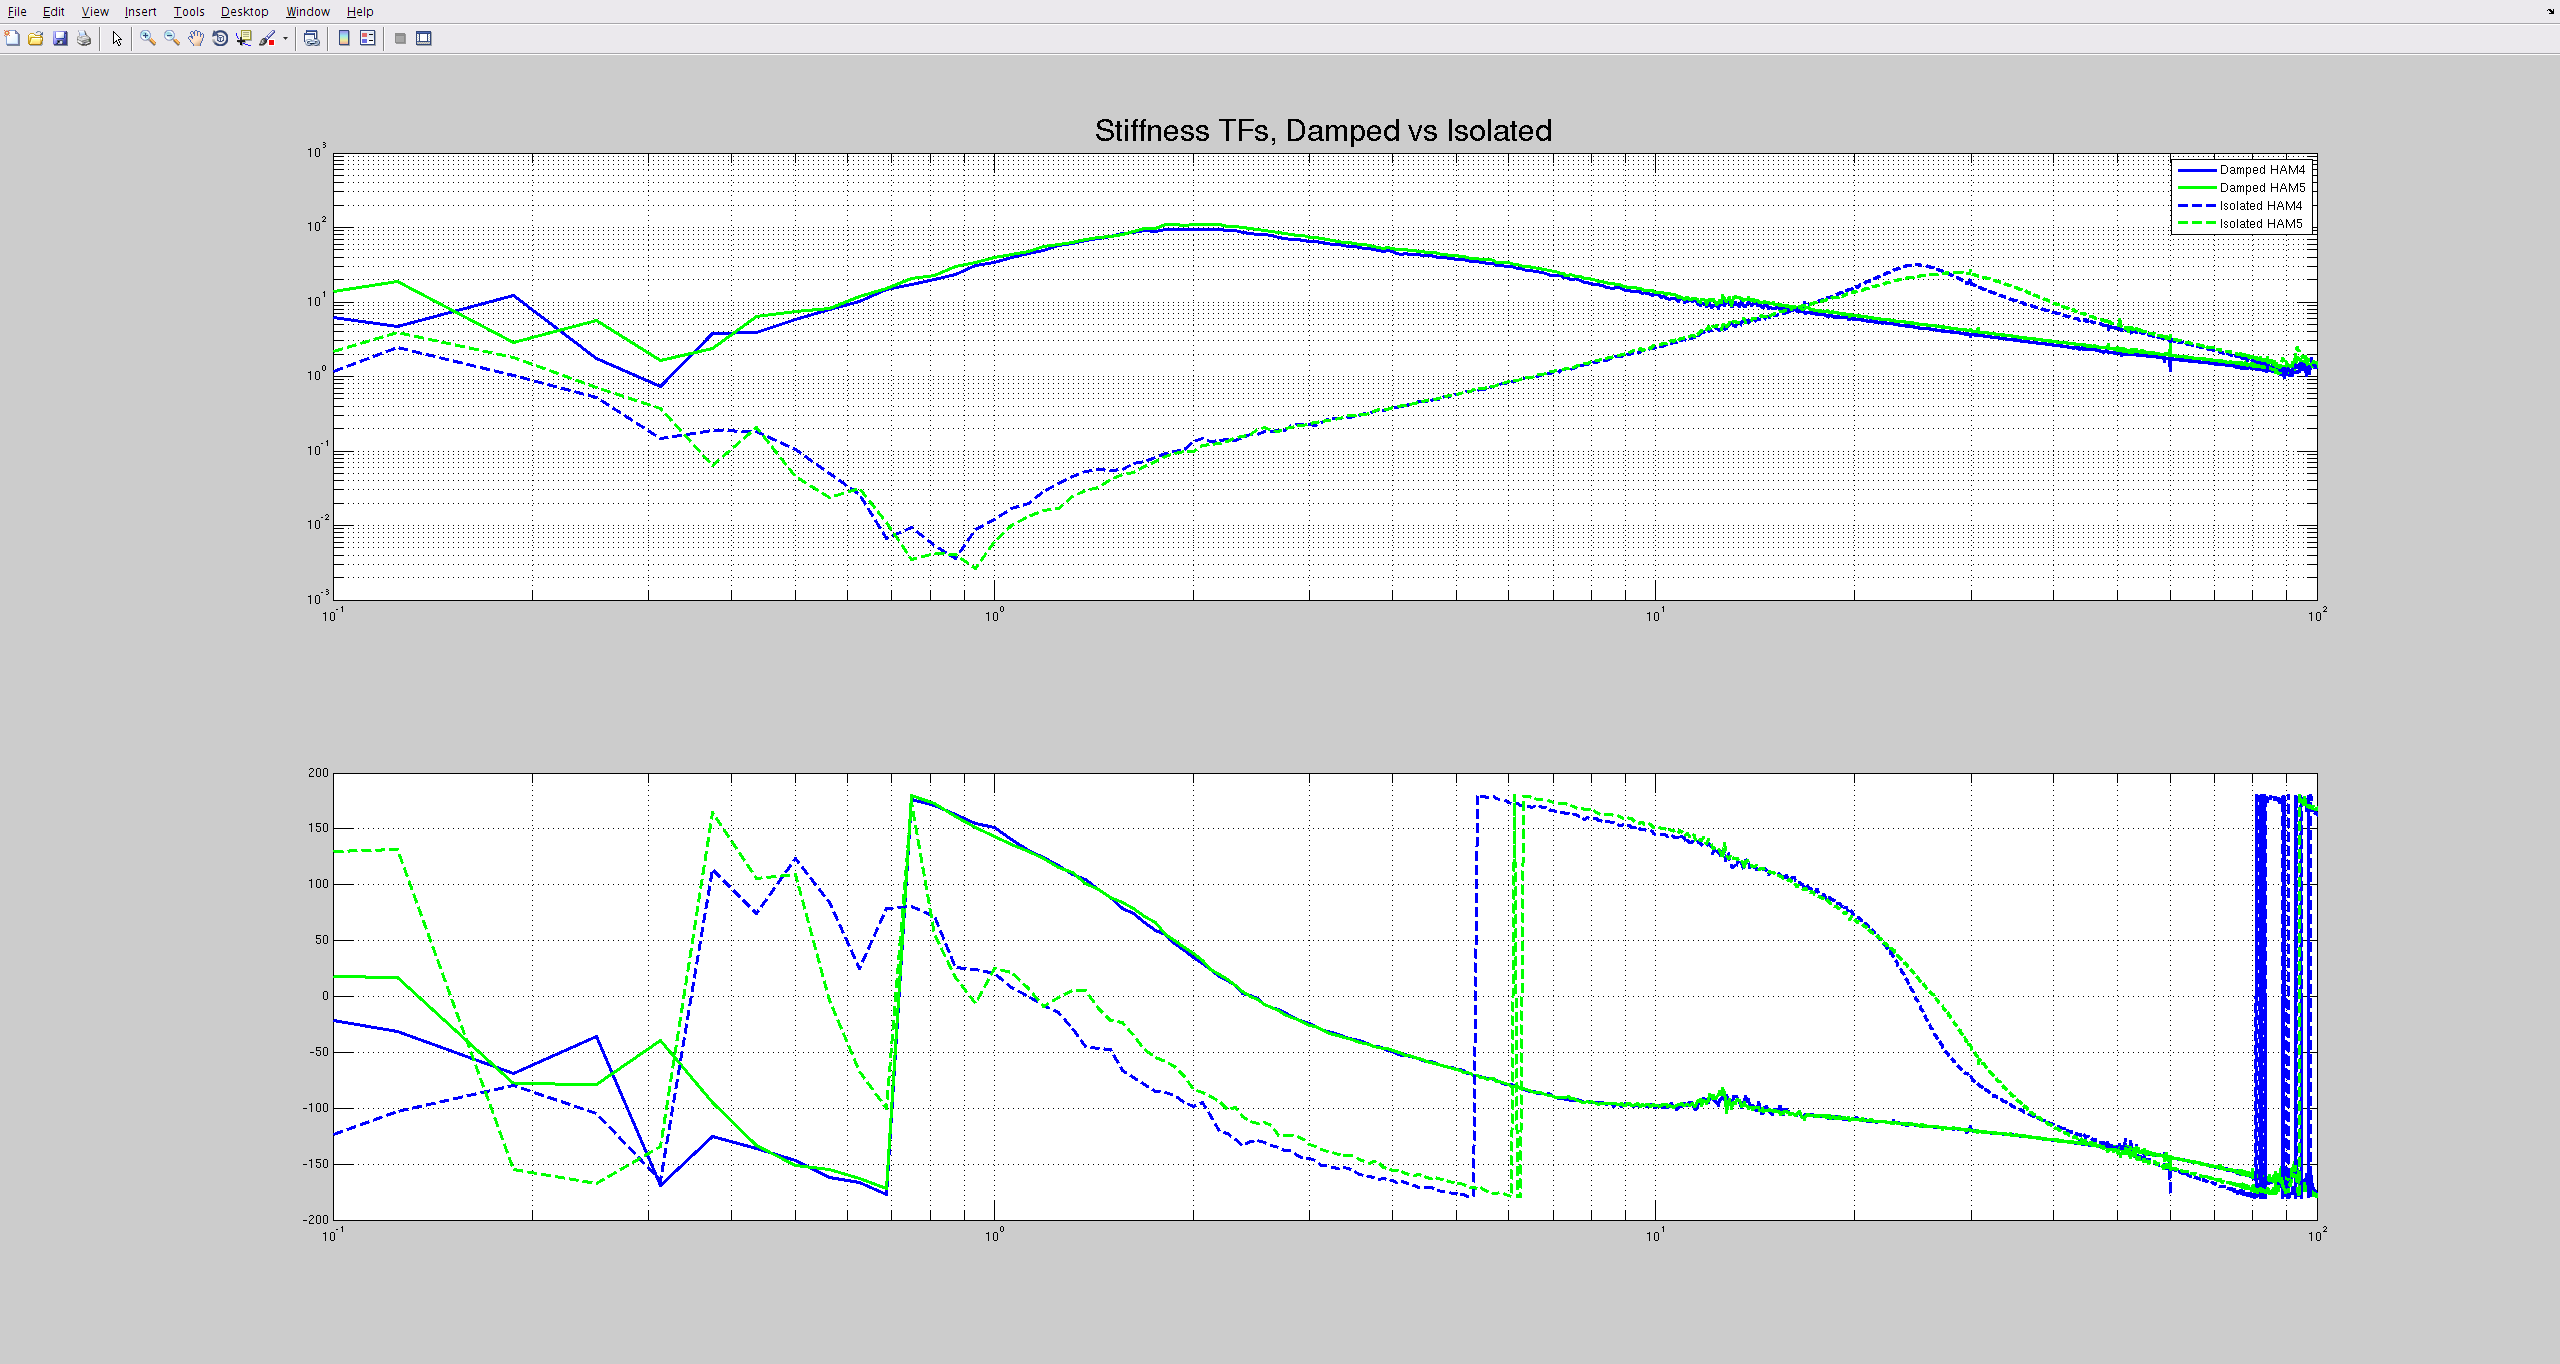
The third plot is the stiffness tf, color key is the same, HAM 4 (blue) and 5 (green) in both damped (solid) and isolated(dashed) states. Again the damped states are similar, the isolated measurments are a little more different. Importantly, the differences are consistent with the transmissibility measurements, which means the filter design ends up looking the same between the chambers, as shown in my next plot.
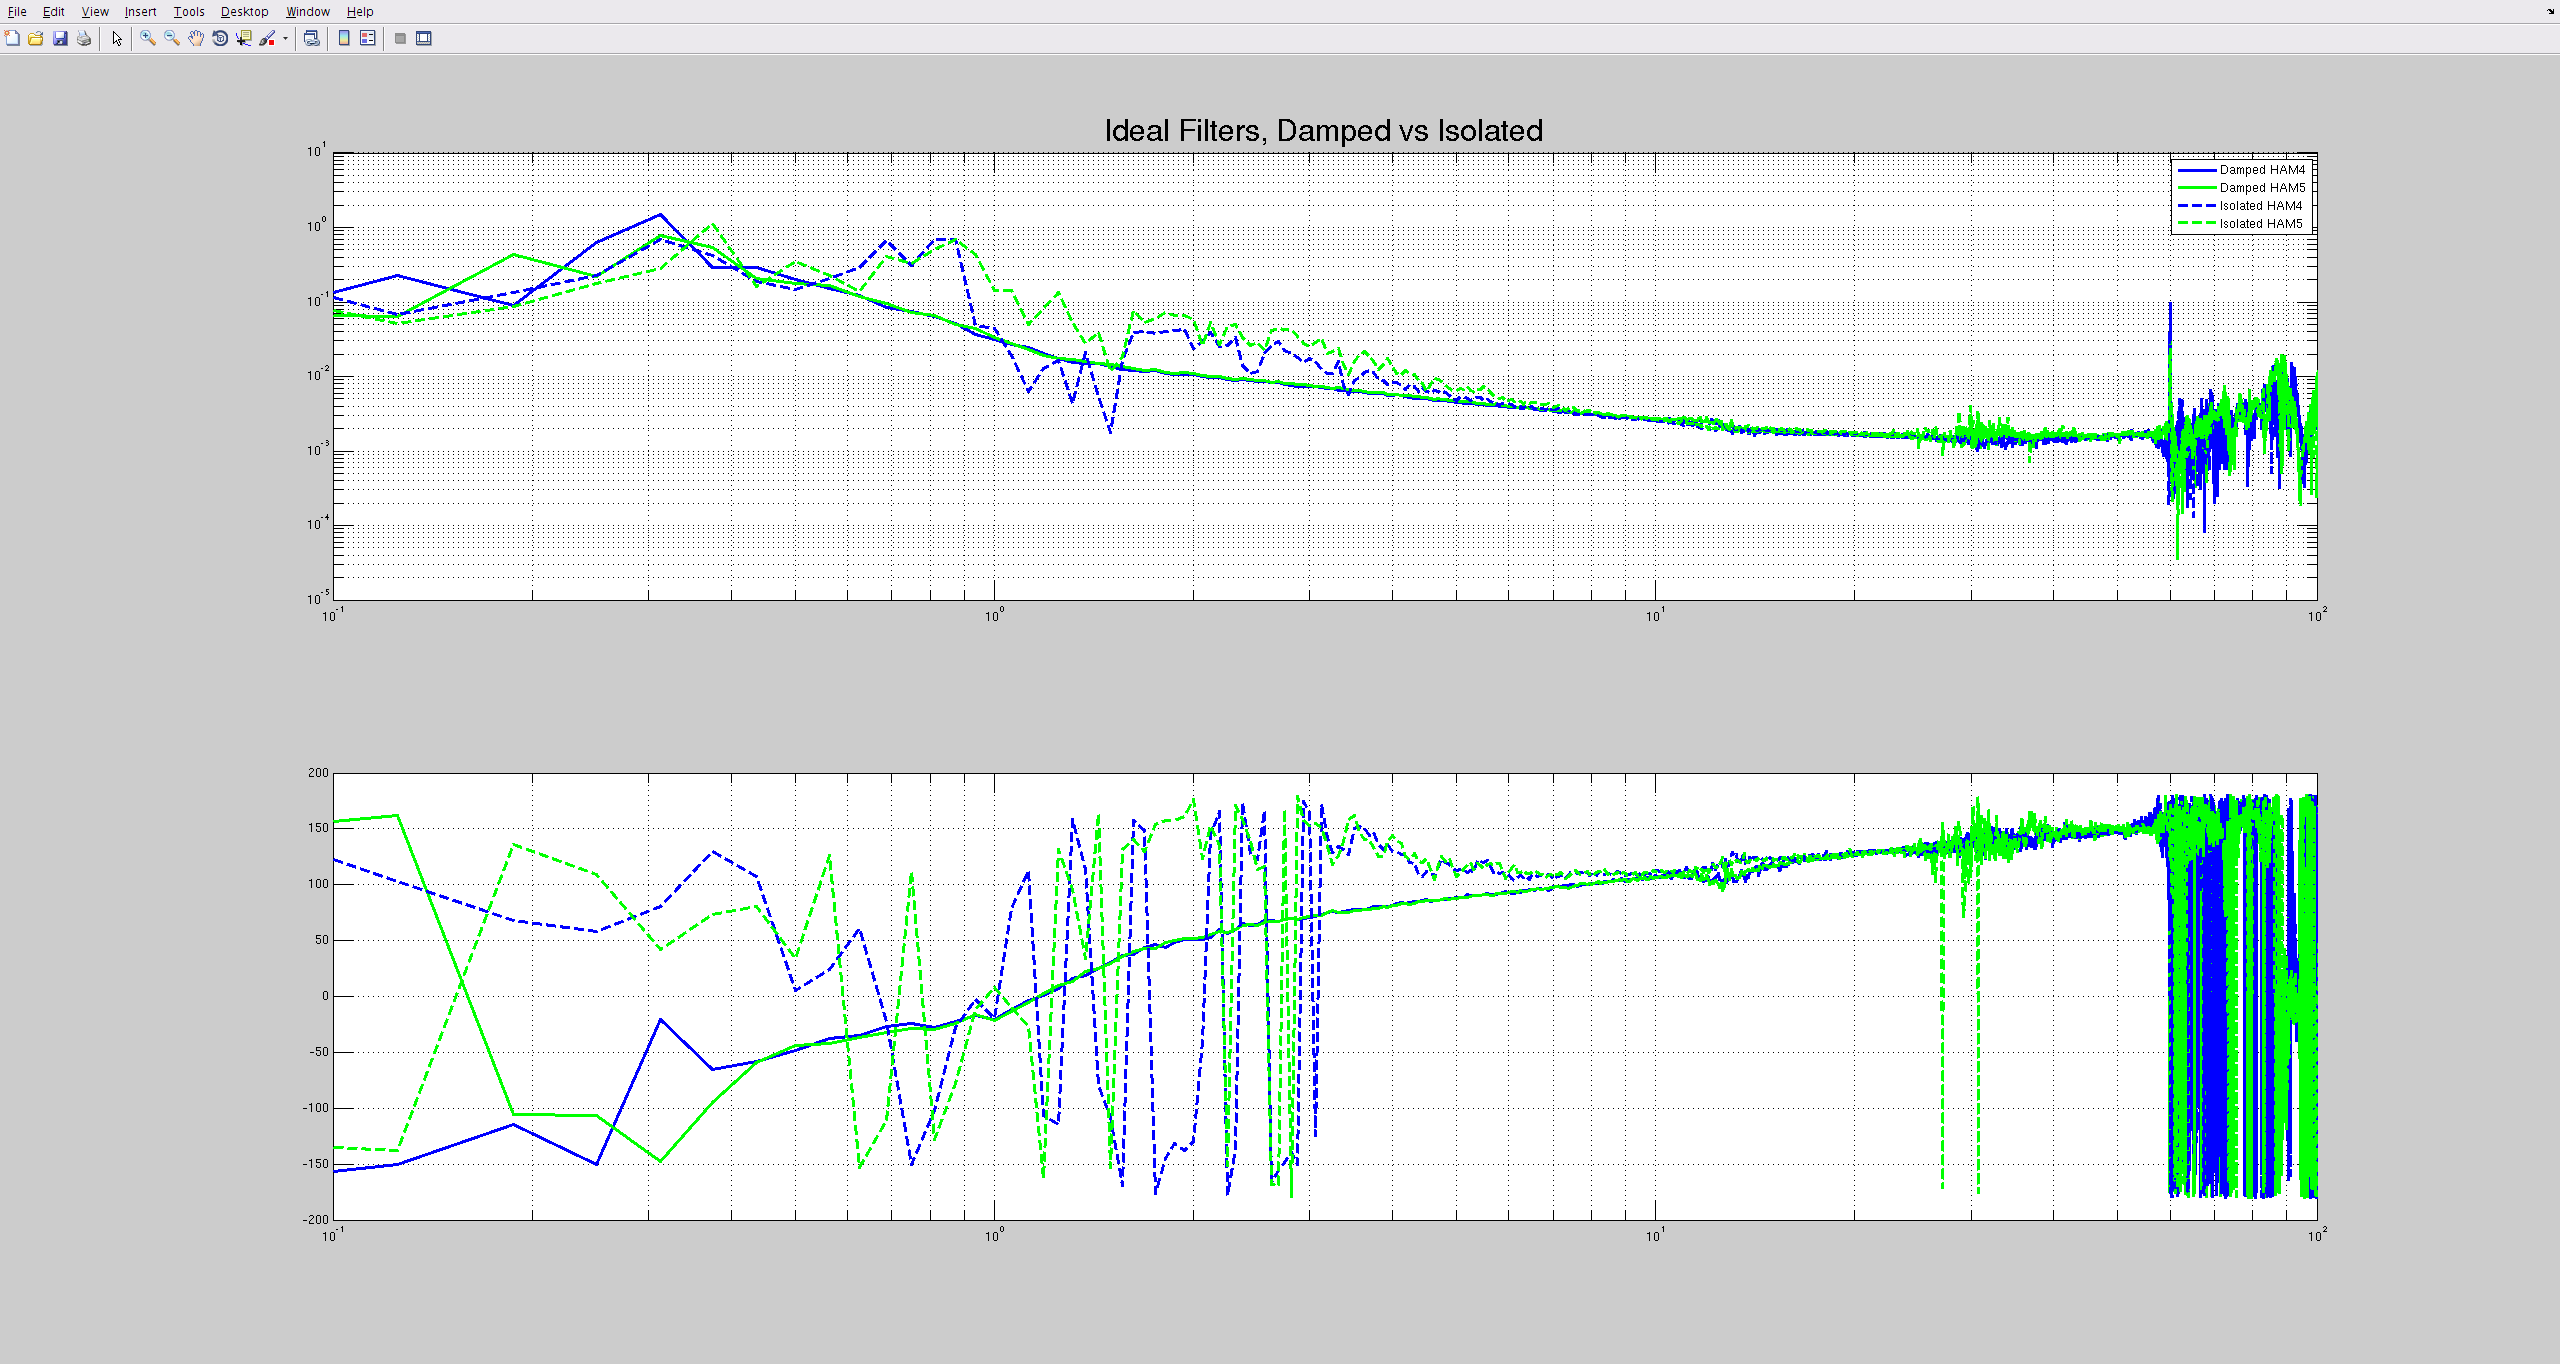
The fourth plot is the ideal filter design for HAMs 4&5. This is done following the process outlined in JeffK's 26002 alog, where the ideal filter is roughly speaking the transmissibility over the stiffness. One of the other things I wanted to look at was what state the ISI needed to be in when designing the filter, as I thought that I had found in the past that the ISI needed to be isolated for both the transmissibility measurment and the stiffness measurement. It looks like it doesn't much matter as far as the final filter design is concerned. The isolated design is a little different at a few hz, though it's hard to see because the data is crappy. The data is much cleaner with the damped transfer functions. UGF's for this loop are on the order of 35hz, so feedback is not doing a lot at 10 hz, that probably explains why the isolated and damped filters end up looking the same, and why they differ more at lower frequency. Also nice to see that the filters for HAM 4 & 5 should be the same, regardless of the either ISI's state. The cleaner data for the damped configuration is a strong argument for using that configuration for my future redesigns.
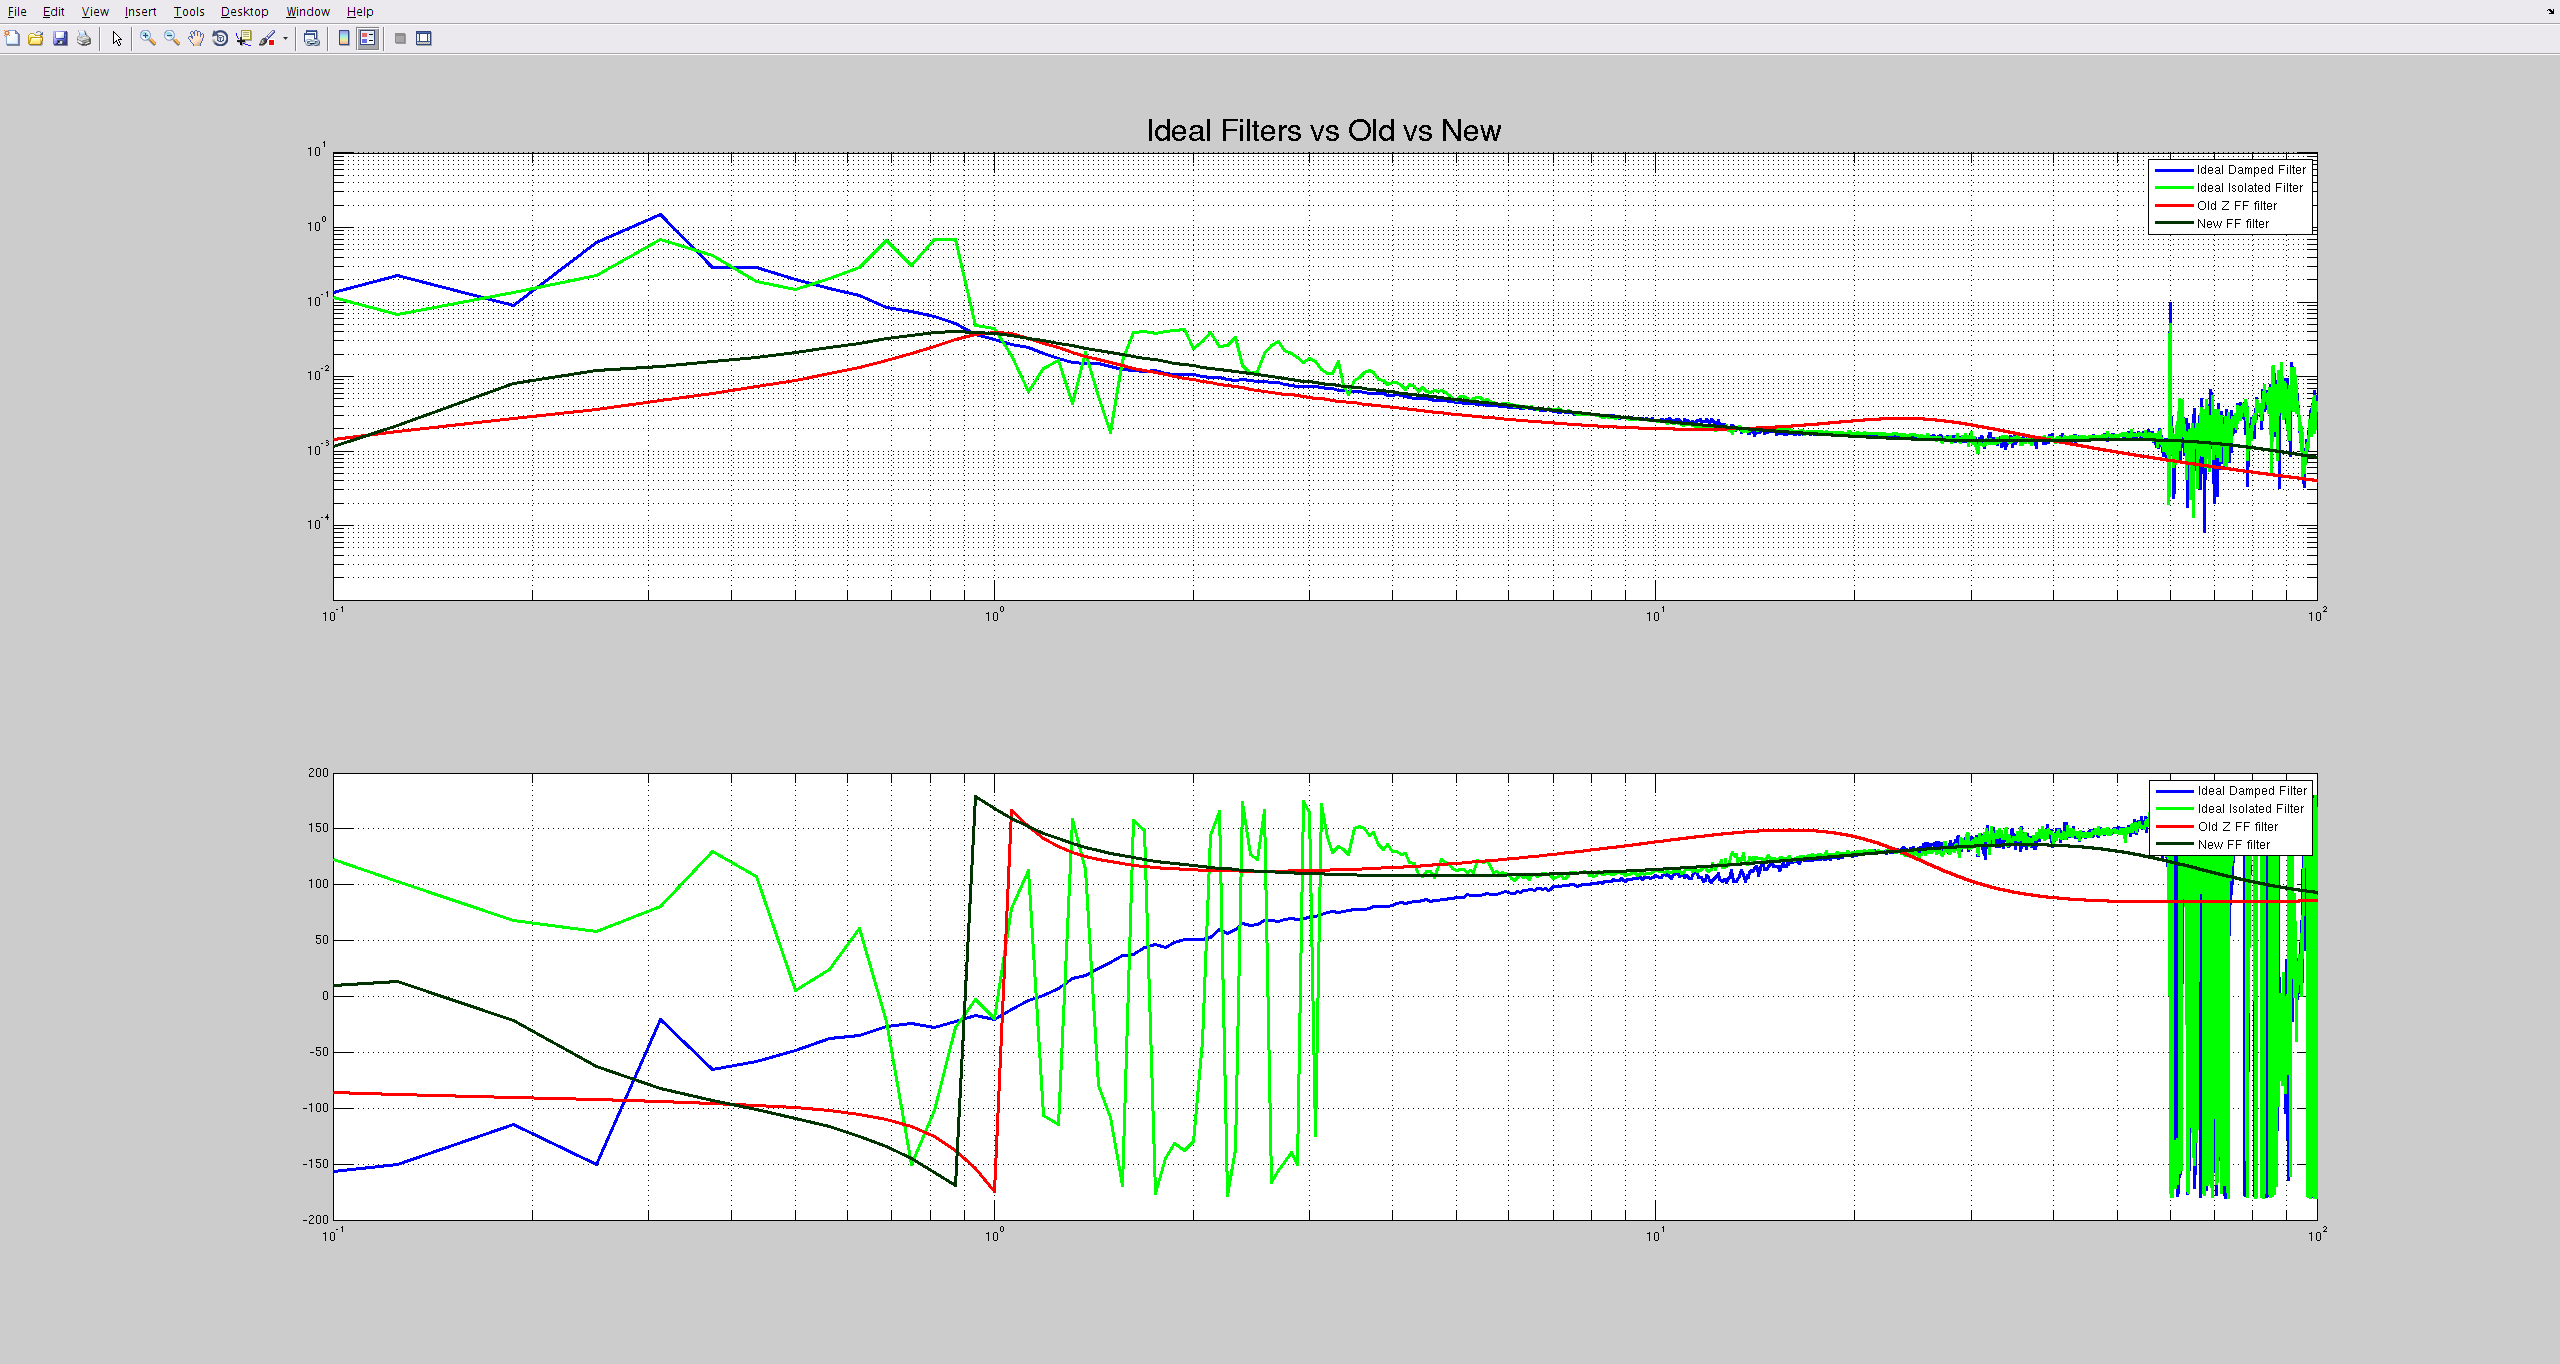
The fifth plot is a comparison of the HAM4 ideal filters(blue and green), the old filter (red), and the new filter (black). You can see that the black line matches green and blue very well between 10 and ~40 hz, but red only matches well in phase right at about 25 hz. This explains why the old filter only did well at 20-30hz. The gain mismatch at 25hz also explains why the old filter needed a gain of .5 to work. The new filter works well from a few hz up to almost 60 hz, with a gain of 1.
I still have my data and the script that I used for the orginal design, Jeff rehashes it in his log. I still don't understand the differences, what I screwed up originally. I think the approach used both times was the same, but I clearly did something wrong the first time around. I'm in the process of repeating this for the other dofs.
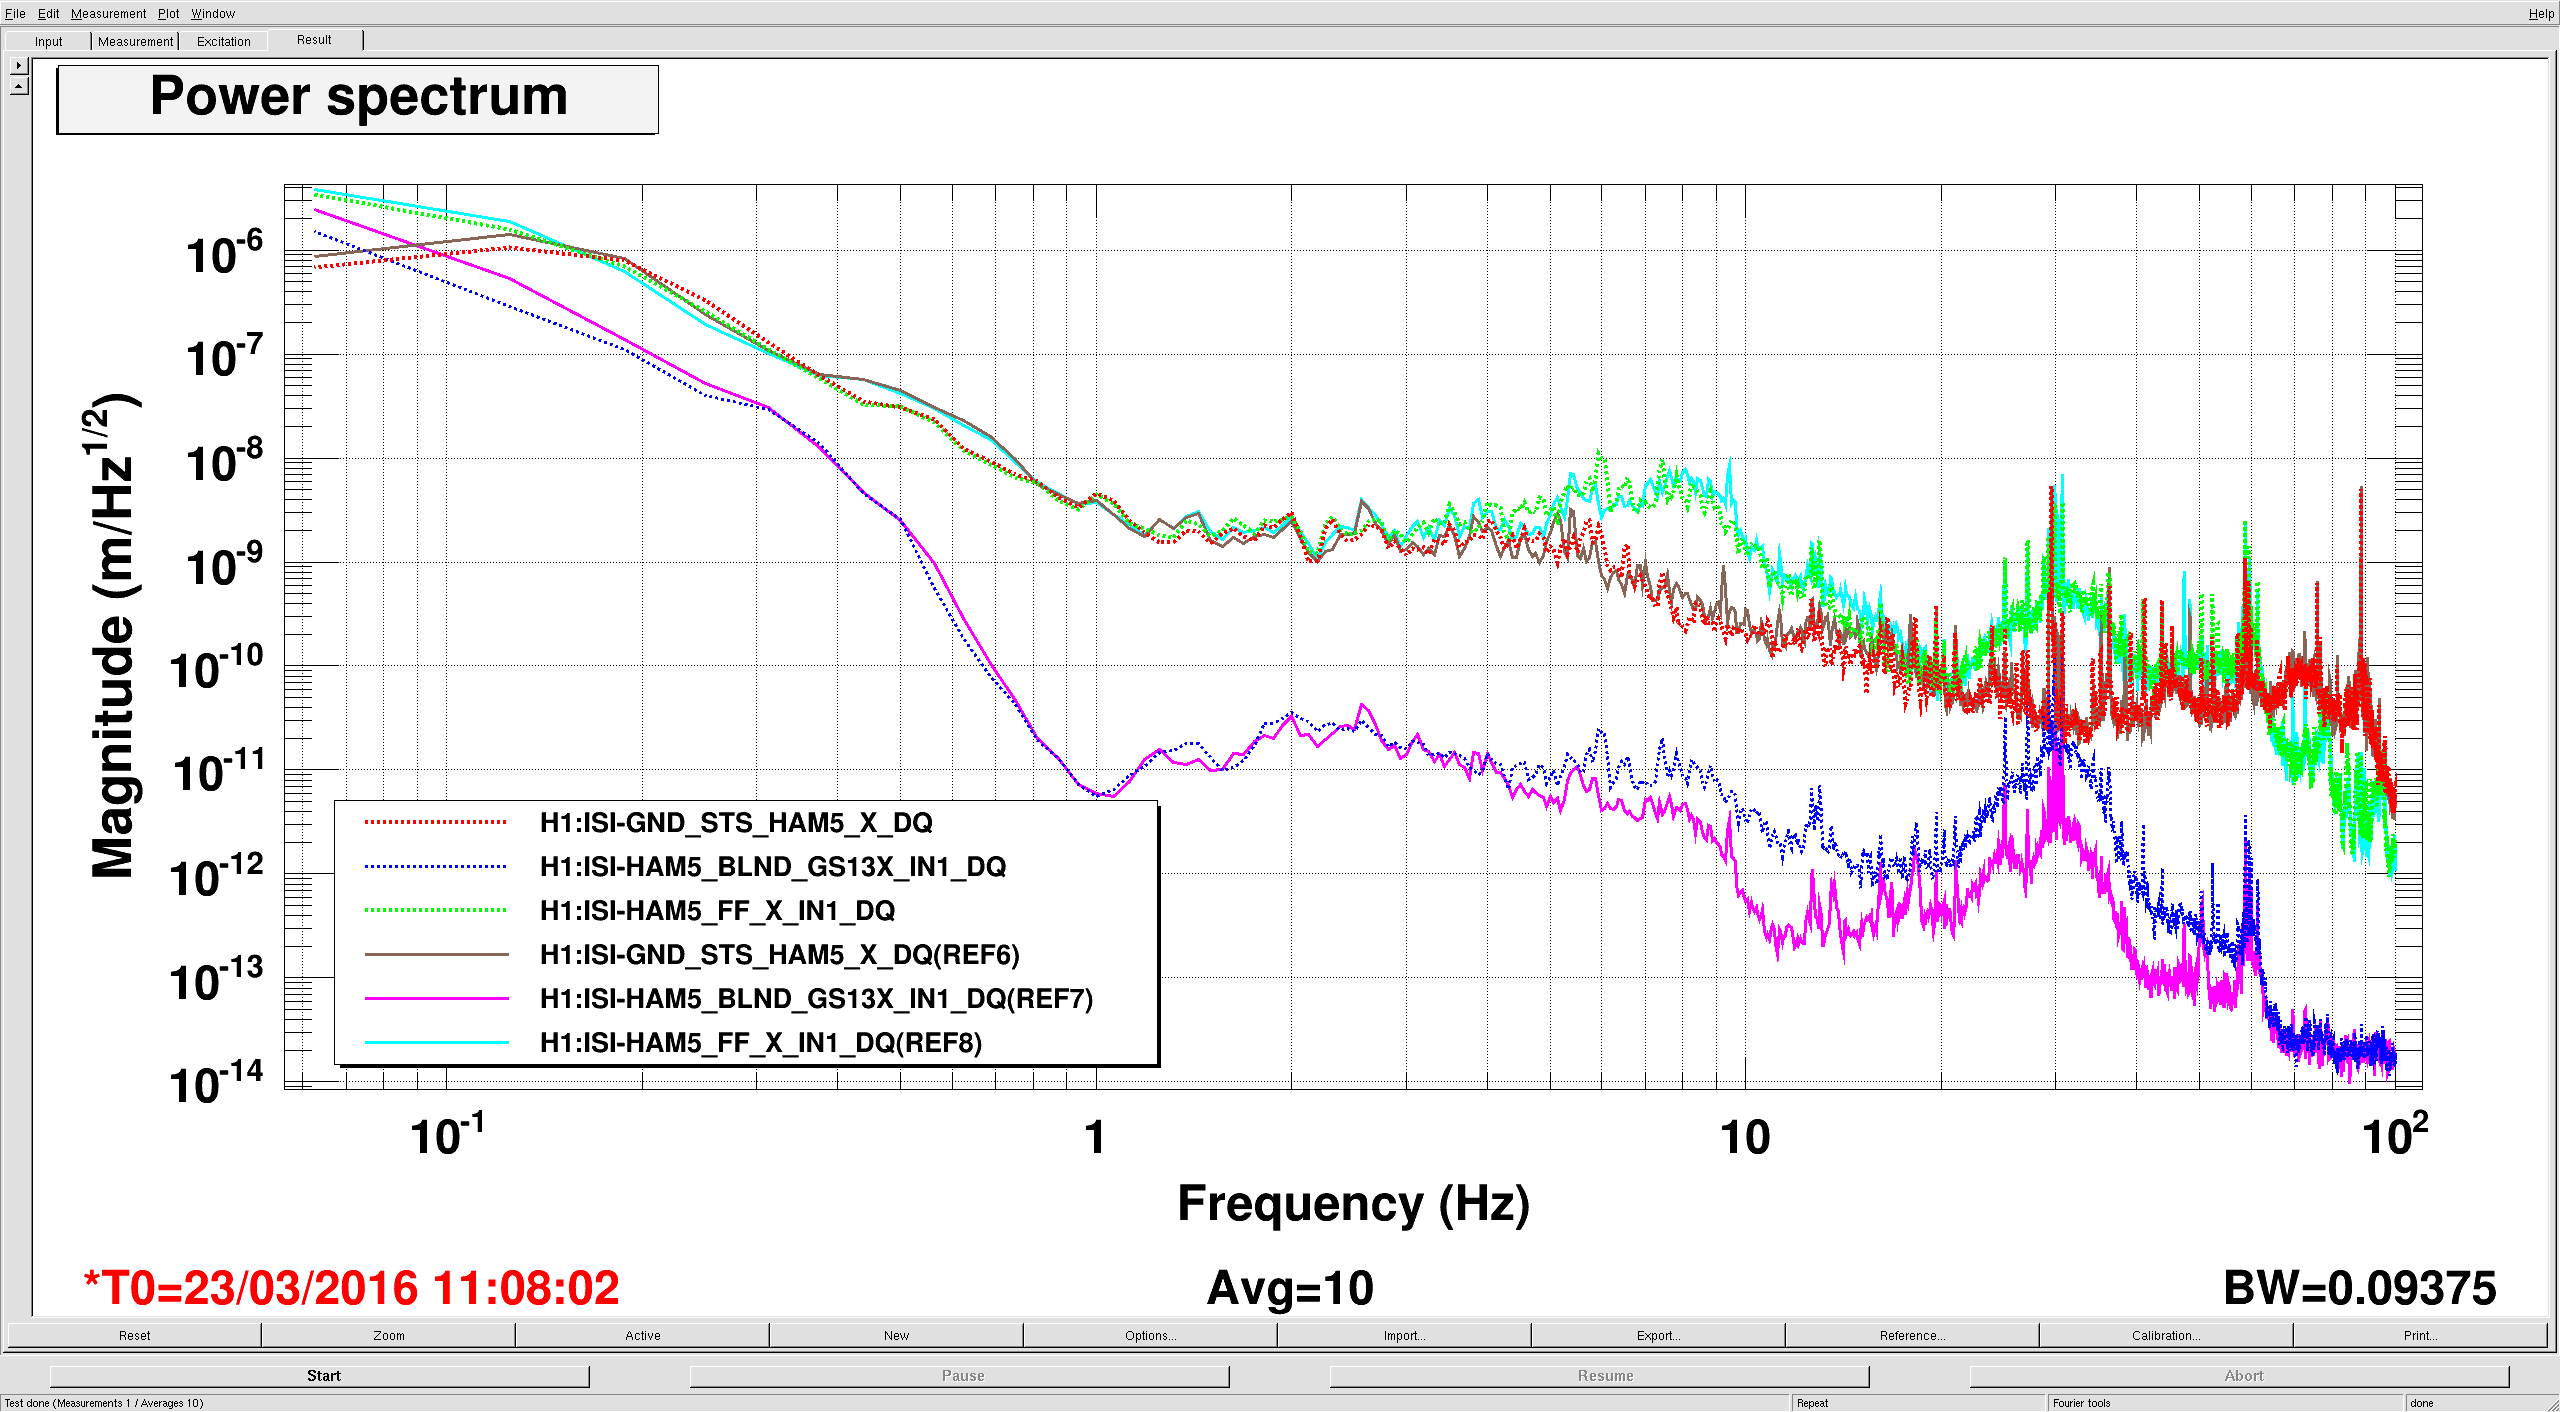
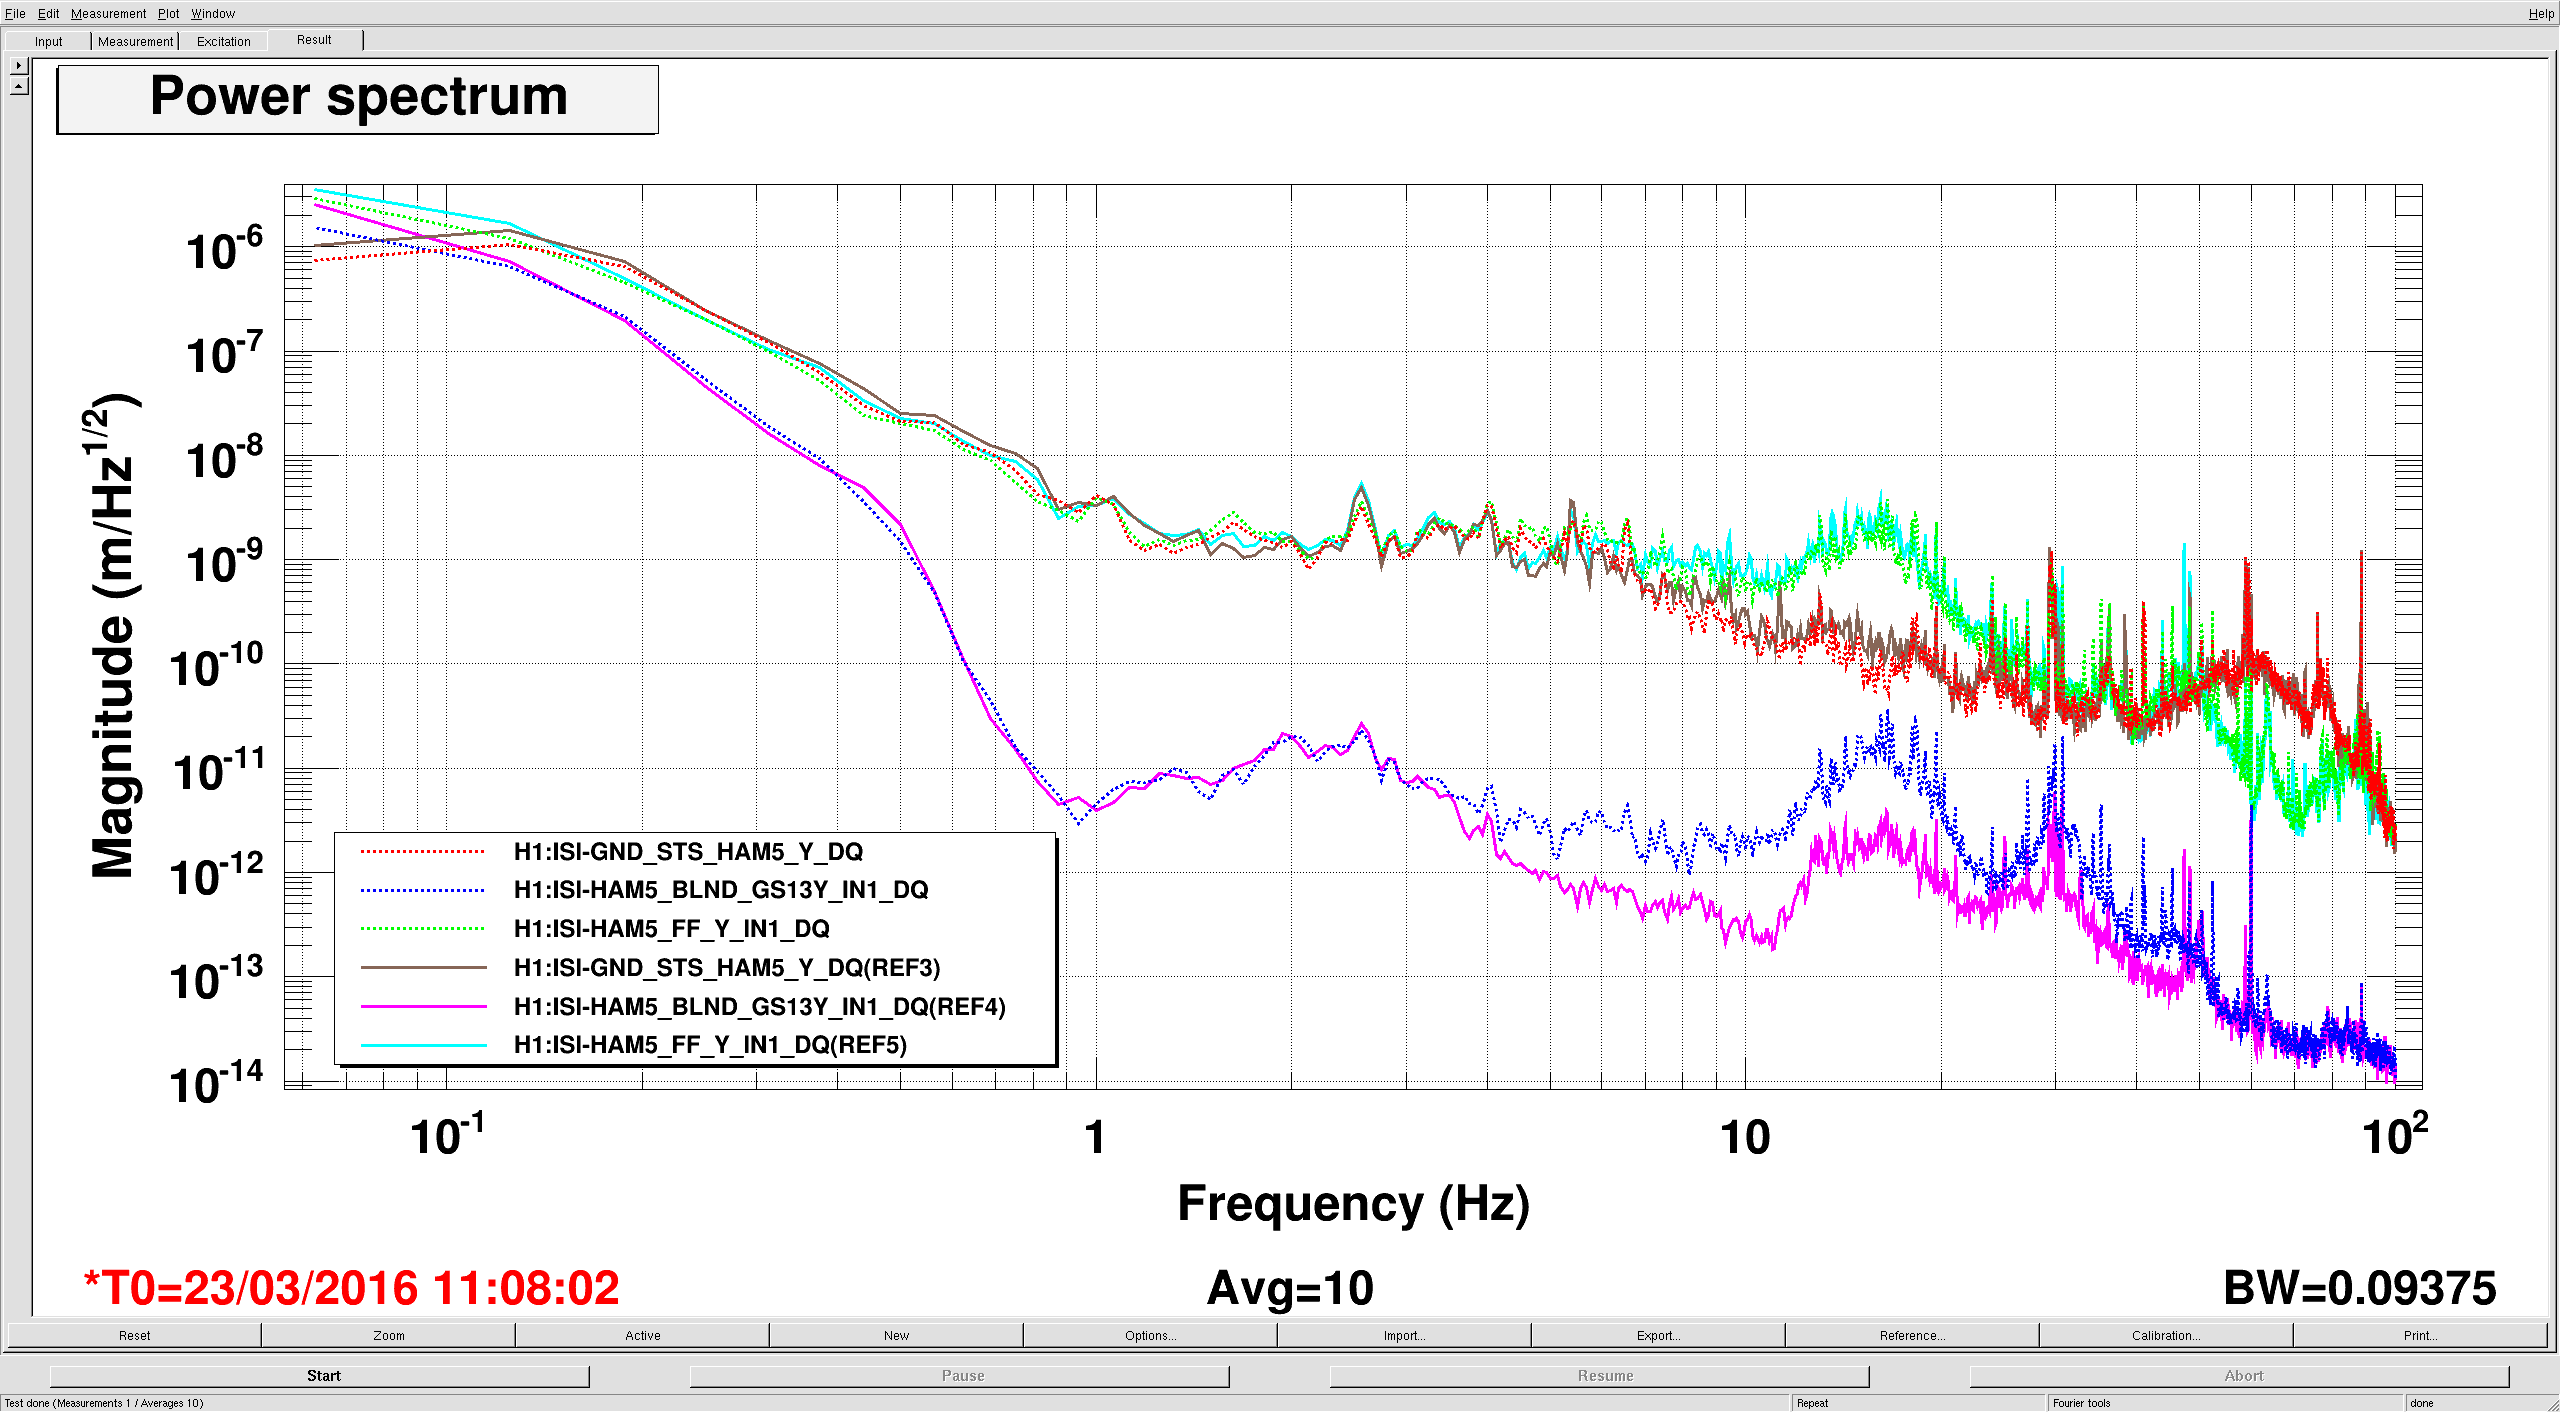
The last plot is HAM5, comparing the old FF filter to the new. Red, blue green are with the new filter, brown, pink and light blue are with the old filter.