WP 5765 See T1600062 SEI log 897
Changed data storage rate for BSC:
1) ISI-optic_STi_MASTER_H(V)j_DRIVE & ST2_BLND_dof_GS13_CUR_IN1
This change means that for the next week or so, inquiries of these channels for times from ~5 days ago to before the restart will need to be via nds2. And, one must avoid selecting a request or data that spans the change. Middle of a maintenance day...maybe that should just be avoided anyway.
2) Increased allowable saturations on L4Cs, GS13s & ACTs to reduce unwarranted tripping.
3) Replaced some utility channels with lower case characters with upper case.
4) Replaced a momentary with LONG_PULSE for STS2 mass centering function.
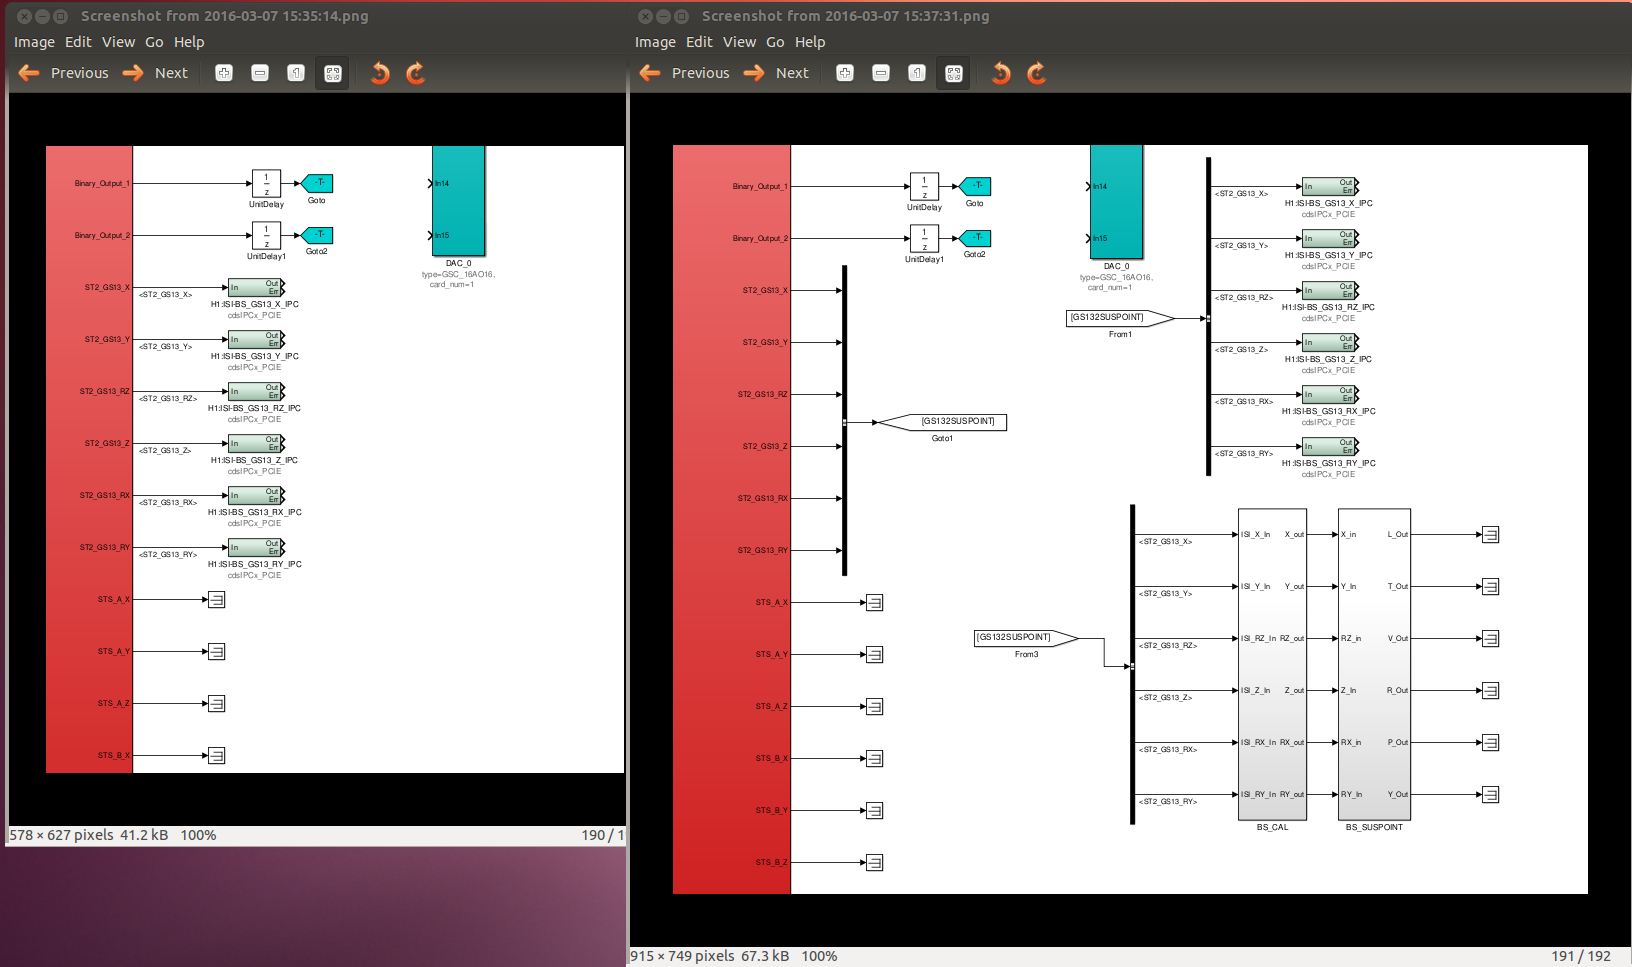
5) Added SUS Point calculation blocks (detailed in 25913.) ISI will take the overhead of calculating this to ease the load of the SUS model.
6) Added Stage2 senscorr DQ channels for T240 & CPS.