jeffrey.bartlett@LIGO.ORG - posted 10:23, Wednesday 03 February 2016 - last comment - 11:39, Wednesday 03 February 2016(25347)
FAMIS #4365 T240 Centering
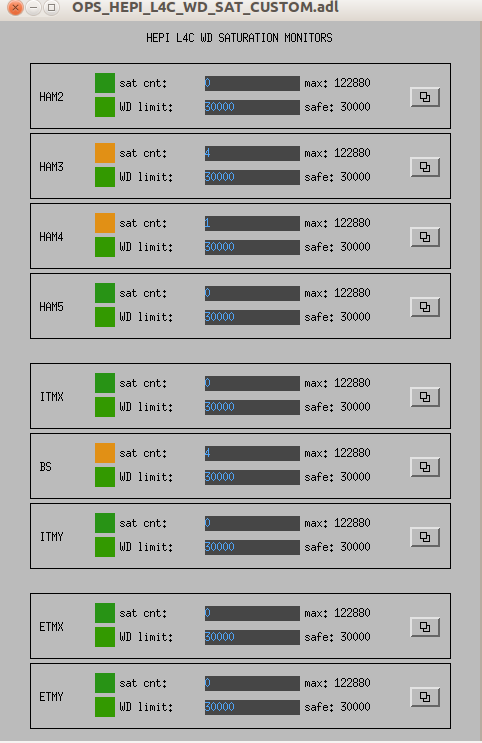
T240 Centering script results:

There are 18 T240 proof masses out of range ( > 0.3 [V] )!
ITMX T240 1 DOF X/U = -3.297 [V]
ITMX T240 1 DOF Z/W = 0.439 [V]
ITMX T240 2 DOF Y/V = 0.505 [V]
ITMX T240 3 DOF X/U = -3.301 [V]
ITMX T240 3 DOF Z/W = -0.341 [V]
ITMY T240 1 DOF X/U = -0.433 [V]
ITMY T240 1 DOF Y/V = 0.359 [V]
ITMY T240 1 DOF Z/W = 0.34 [V]
ITMY T240 2 DOF Y/V = 0.43 [V]
ITMY T240 2 DOF Z/W = -0.345 [V]
ITMY T240 3 DOF X/U = -0.941 [V]
ITMY T240 3 DOF Y/V = -0.319 [V]
ITMY T240 3 DOF Z/W = -3.275 [V]
BS T240 1 DOF Y/V = 0.904 [V]
BS T240 1 DOF Z/W = 0.384 [V]
BS T240 2 DOF X/U = 0.96 [V]
BS T240 2 DOF Z/W = 0.481 [V]
BS T240 3 DOF Z/W = 0.927 [V]


All other proof masses are within range ( < 0.3 [V] ):
ETMX T240 1 DOF X/U = 0.158 [V]
ETMX T240 1 DOF Y/V = 0.143 [V]
ETMX T240 1 DOF Z/W = 0.19 [V]
ETMX T240 2 DOF X/U = 0.061 [V]
ETMX T240 2 DOF Y/V = -0.052 [V]
ETMX T240 2 DOF Z/W = 0.168 [V]
ETMX T240 3 DOF X/U = 0.153 [V]
ETMX T240 3 DOF Y/V = 0.008 [V]
ETMX T240 3 DOF Z/W = 0.113 [V]
ETMY T240 1 DOF X/U = 0.066 [V]
ETMY T240 1 DOF Y/V = 0.006 [V]
ETMY T240 1 DOF Z/W = 0.046 [V]
ETMY T240 2 DOF X/U = -0.126 [V]
ETMY T240 2 DOF Y/V = 0.059 [V]
ETMY T240 2 DOF Z/W = 0.148 [V]
ETMY T240 3 DOF X/U = 0.045 [V]
ETMY T240 3 DOF Y/V = 0.038 [V]
ETMY T240 3 DOF Z/W = 0.152 [V]
ITMX T240 1 DOF Y/V = -0.16 [V]
ITMX T240 2 DOF X/U = -0.227 [V]
ITMX T240 2 DOF Z/W = 0.219 [V]
ITMX T240 3 DOF Y/V = 0.18 [V]
ITMY T240 2 DOF X/U = 0.219 [V]
BS T240 1 DOF X/U = 0.207 [V]
BS T240 2 DOF Y/V = 0.182 [V]
BS T240 3 DOF X/U = 0.072 [V]
BS T240 3 DOF Y/V = 0.241 [V]


ITMX & ITMY T240 Masses Centered WP 5719
JeffB's post of the Mass Positions prompted us to center the ITM ISI T240s. This was successful. The BS T240 masses are a bit above action level but not by much; we'll wait a few before we mess with it.