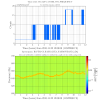
Looking over the past 3 weeks of data for the Laser Room temperature, the attached plot shows 4 deviations from the norm. The first two coincide with maintenance activities carried out by Jason and myself. The third from the left by Cheryl and Robert doing some IO work. The fourth one from the activity this week. Each incursion results in a change in the pre-modecleaner body temperature with perhaps the largest change occuring this week. Since most times we probably touch up the pre-modecleaner alignment a little, this probably masked the effect of the pre-modecleaner body length change on the alignment.
This is a follow up to this entry about the excess noise in the EX TR QPD signals. The OSEM fix did not help this, so they seem to be unrelated. I looked at the PIT and YAW signals, and found that they are very coherent with SUM in the 5-100 Hz band where the excess noise appears (plot 1), and that the phase of the transfer function in that region is 0 (e.g., SUM, PIT and YAW all have the same sign and phase). This appears to point to a problem in segment 1, though I cannot confirm that with offline data. I looked at the OUT16 channels for all segment and didn't see anything obviously wrong (plot 2). Interestingly, the same signal appears in QPD A and B, so this is not a single channel problem.
To do: investige the individual segment signal in the online data... is this just sement 1?
Most of the night IFO was with commissioners.
Earthquake about 2 hours ago kept us from relocking for a while.
IFO has made it through to Engage ASC a few times, so transition to CARM is ok.
I've been having the IFO sit in Engage ASC, which I thought was very stable, but it has not been this morning, and we have not had any locks that are long or that make it up to DC Readout+.
The main story of the day is related to the non stationary low frequency noise first seen early in the morning. It seems to come from CHARD noise, which could be coupling to DARM more now because of a change in alignment.
A few ideas for next steps:
We also worked on a few other things today...
Here is a measurement of CHARD Yaw at high power, overlaid with yesterday's measurements at 23W. The 23W measurement includes the MsBoost, but not any 23W boost or the lead-plus-cutoff filters that Sheila designed.
Here is how I retuned the A2L. I injected some band limited noise (ellip band pass 1-100 Hz, amplitude 20000 cts) on ETMX_L2 L2L, P2P and Y2Y paths, with the P2L and Y2L gains set to zero. The measurements were good between 20 and 100 Hz. The ratios -P2P/L2L and -Y2Y/L2L are what we need to implement in the correction paths. Those trasnfer functions are quite constant above 30 Hz, but not so much below 30 Hz. We would need a better (sweep sine) measurement if we want to improve the decoupling below 20 Hz.
I changed the gains of the P2L and Y2L of ETMX as follows:
P2L from 1.18 to 1.03
Y2L from 1.33 to 1.23
Coherence of DARM with CHARD reduced at low frequency. However, we reverted to the old numbers to investigate the low frequency non stationary noise.
I ran Hang's latest A2L script (see aLog 20013), after the realignment work that was done tonight (Sheila is writing up her entry as I type).
We stil have excess noise at low frequency, but maybe there's a bit less than when I started the script? The noise we're seeing is totally non-stationary, so it's hard to say. Certainly the A2L didn't eliminate it.
I checked the results of the latest a2l run. It seemed that the decoupling worked only for ETMX pitch and ITMX pitch, and the optimal gains changed only by 7% and 2%. On the other hand, it failed for ETMY pitch and ITMX yaw. I attached a worked result and a failed one for comparison.
By examining the results, the bad ones had a flatter slope and were more likely to have "outliers". We thus might be able to get a better result by increasing the steps between two measurements, or increase the number of gains to be measured. Nonetheless, it seemed to also indicate that we were already near the optimal spot that such an linear, single frequecy decoupling could achieve...
Dan, Nutsinee
Tonight we identified and damped more ITM first harmonics.
Frequency | Test Mass | Damp Setting |
991.7478 | ITMY | 260dB, -60deg |
991.9345 | ITMY | 260dB, 120deg |
992.4256 | ITMX | 260dB, +/-180deg |
997.8868 | ITMY | 260dB, +/-180deg |
They will be added to the violin wikipage.
All Times in UTC
(Dan, Corey)
Around 5:30UTC (22:50PT), Dan noticed a rung up roll mode on DARM spectrum, and from the Bounce/Roll monitor, the culprit was ITMy.
Brought up the bounceroll.stp StripTool from the Ops Template & could see ITMroll channel high. From the ITMy SUS screen, opened the DARM BR DAMP filter bank screen.
Initial Values: -60degrees & a gain of +40.
New Values: +60degrees & a gain of -80.
This took care of ITMy, and should be fine for this current lock. Whether we want to keep ITMy like this remains to be seen. Should see how we look after a few locks.
After the PSL temperature adventure on monday afternoon, it seems as though the PMC alignment shifted. We now get less transmitted power, although the sum of refl and trans has not changed much.
In looking at the data around the period of the temperature excursion, all the power monitoring photodiodes indicate a change in power monitored. The ones located before the pre-modecleaner return to their previous values. The ISS photodiodes after the pre-modecleaner return to their previous values however the transmission and reflection signals are lower than before. The pre-modecleaner reflected spot doesn't look substantially different, however the pre-modecleaner heater output did not return to its previous level. It has remained at an elevated level since the temperature excursion. The coefficient of thermal expansion for aluminium is approximately 22 microns per degK. The attached plot suggests the body of the pre-modecleaner changed by 0.5 degK and stayed at the higher temperature. It should be noted that the pre-modecleaner heater did its job and relieved the PZT high voltage. In doing so the length of the spacer is different and this may be the cause of any mis-alignment. The plot also shows the Laser Room temperature. It might be worth trying reducing (presumably reducing, might also be increasing) the heater offset to bring the pre-modecleaner temperature back down to 304.5 degK from its current value of 305.0 degK to see if this peaks the power transmitted by the pre-modecleaner.
Attached is the output of the quadrant photodiode in the ISS photodiode box with the corresponding temperature measurement. Clearly a change in the beam position is indicated, with the vertical not returning to its previous value. The horizontal seems to track the room temperature.
FRS 3247 The h1hwinj0 computer has been renamed to h1hwinj2.
Scott L. Ed P. Rodney H. 8/11/15 After filling the water tank, the crew moved the fans and re-strung the lights. 45 meters of tube and bellows were cleaned ending at station HSW-2-012. Cleaning results posted here. 8/12/15 60.6 meters of tube and bellows cleaned ending at station HSW-2-009.
I took a look at the scattering noise we see in all lock since last night .
I computed the band-limited RMS between 20 ans 120 Hz, and this is a good indicator of the scattering noise level. Then I looked at correlations with all suspension motions (using M0 and M1 signals, as Keita did for the OMC).
So I'm able to reconstruct the noise variation over time, using a linear combination of all the suspension signals and their squared values. However, I'm not able to pick point one single mirror which is moving more, as shown in the ranking of the most important channels for the BLRMS reconstruction.
I compared the suspension motion spectra from tonight (GPS 1123422219) and few days ago (GPS 1123077617). The most relevant difference is that all test masses YAW motion have now a large bump at 3 Hz. ITMY also has large lines at 0.45 and 0.63 Hz. Finally ETMY pitch shows a large line at 6 Hz and some excess noise above that frequency.
Not sure if all of this is really relevant...
Some random commissioning tasks from tonight:
LSC rephasing
In full lock, the phases of POP9 and POP45 were adjusted to minimize the appearance of PRCL in POP9Q and the appearance of SRCL in POP45Q. Then the input matrix element for POP9I→SRCL was tuned to minimize the appearance of a PRCL excitation in the SRCL error signal. New settings attached.
We should take a sensing matrix measurement sometime soon.
LSC OLTFs
I took OLTFs of PRCL, MICH, and SRCL. The data are attached.
[I also did some noise injections into CARM for frequency budgeting purposes. Those are attached too.]
Front-end LSC triggering
Jamie and I started this a few weeks ago, and now it is completed.
There are occasions when the DOWN state of the ISC_LOCK guardian (which, among other things, turns off feedback to the suspensions) is not run immediately after a lockloss (e.g., because the guardian is paused or in manual mode). Therefore, Jamie and I set up the LSC trigger matrix so that PRCL, MICH, SRCL, DARM, and MCL are turned off if POP DC goes below 100 normalized counts. This is set in the DRMI_ON_POP state.
CARM gain redistribution in the Guardian
The state REFL_IN_VACUO now redistributes the CARM gain slightly in order to improve the noise performance of the CARM loop. This state has not been tested and has been left commented out.
The CARM gain code was uncommented and seems to work fine.
I looked into the glitches created by Robert's dust injections. In brief: some of the glitches, but not all of them, look very similar to the loud glitches we are hunting down
Here is the procedure:
In this way I could detect a total of 42 glitches. The last plot shows the time of each glitch (circles) compared with the time of Robert's taps (horizontal lines). They match quite well, so we can confidently conclude that all the 41 glitches are due to dust. The times of my detected glitches are reported in the attached text file, together with a rough classification (see below)
I then looked at all the glitches, one by one, to classify them based on the shape. My goal was to see if they are similar to the glitches we've been hunting.
A few of them (4) are not clear (class 0), some others (14) are somehow slower than what we are looking for (class 3). Seven of them have a shape very close to the loud glitches we are looking for (class 1), and 16 more are less obvious but they could still be of the same kind, just larger (class 2).
See the attached plots for some examples of classes.
It seems the text file of glitch times didn't make it into the attachments, would you mind trying to attach it again?
Ops! Here's the file with the glitch times.
Gabriele, Did you check which of Robert's glitches caused any ADC/DAC adjurations? The glitch shape will start changing significantly once the amplitude is big enough to start saturations. PS: The ODC master channel has a bit that will toggle to red (0) is any of the subsystems reports a saturation (with 16k resolution) - it might be exactly what you need in this case.
Stefan, I checked for some ADC and DAC overflows during this data segment. The OMC DCPDs ADCs overflowed during several of these. There were still some with SNRs of 10,000 that didn't overflow like this. The segments are pasted below. They're a bit conservative because I'm using a 16 Hz channel without great timing. There were no ADC overflows in POP_A, and no DAC overflows in the L2 or L3 of the ETMs. I didn't check anything else. This is not quite the same as what the ODC does, which is a little more stringent. I'm just looking for changes in the FEC OVERFLOW_ACC channels. 1123084682.4375 1123084682.5625 1123084957.3750 1123084957.5000 1123086187.3750 1123086187.5000 1123086446.8125 1123086447.3750 1123088113.0625 1123088113.1875 1123088757.4375 1123088757.6250 1123088787.1875 1123088787.3125 1123088832.3125 1123088832.4375 1123089252.6250 1123089252.7500 1123089497.2500 1123089497.3750