Den, Kiwamu, Evan
We continued investigations into locking robustness and low-frequency noise.
Notes on robustness:
>> Engaging the soft loops is still painful, particularly in yaw. When the loops are ramped up to their nominal gains (a few tens of millihertz bandwidth), the SRM yaw loop misaligns the SRM in yaw, which causes POP90 to rise and causes lockloss after about 1 minute. If the SRM yaw loop is turned off, this misalignment does not occur. So far, the most reliable way to engage the ASC is to (1) engage the soft loops with the −20 dB filters, and let them run for a few minutes, (2) turn off the SRM yaw loop, (3) turn off the −20 dB filters in the soft loops, and then (4) once the soft loop error points have reached 0, turn the SRM yaw loop back on. This has not been added to the guardian.
>> Den retuned the PR2 actuator feedforward which decouples MICH from PRCL, but this has not been added to the guardian yet.
Notes on noise:
>> Similar to yesterday's frequency noise test, we injected high-frequency noise into the ISS first-loop error point. We drove several volts (both sine waves and broadband noise) up to 10 MHz, but we did not see any nonlinear coupling.
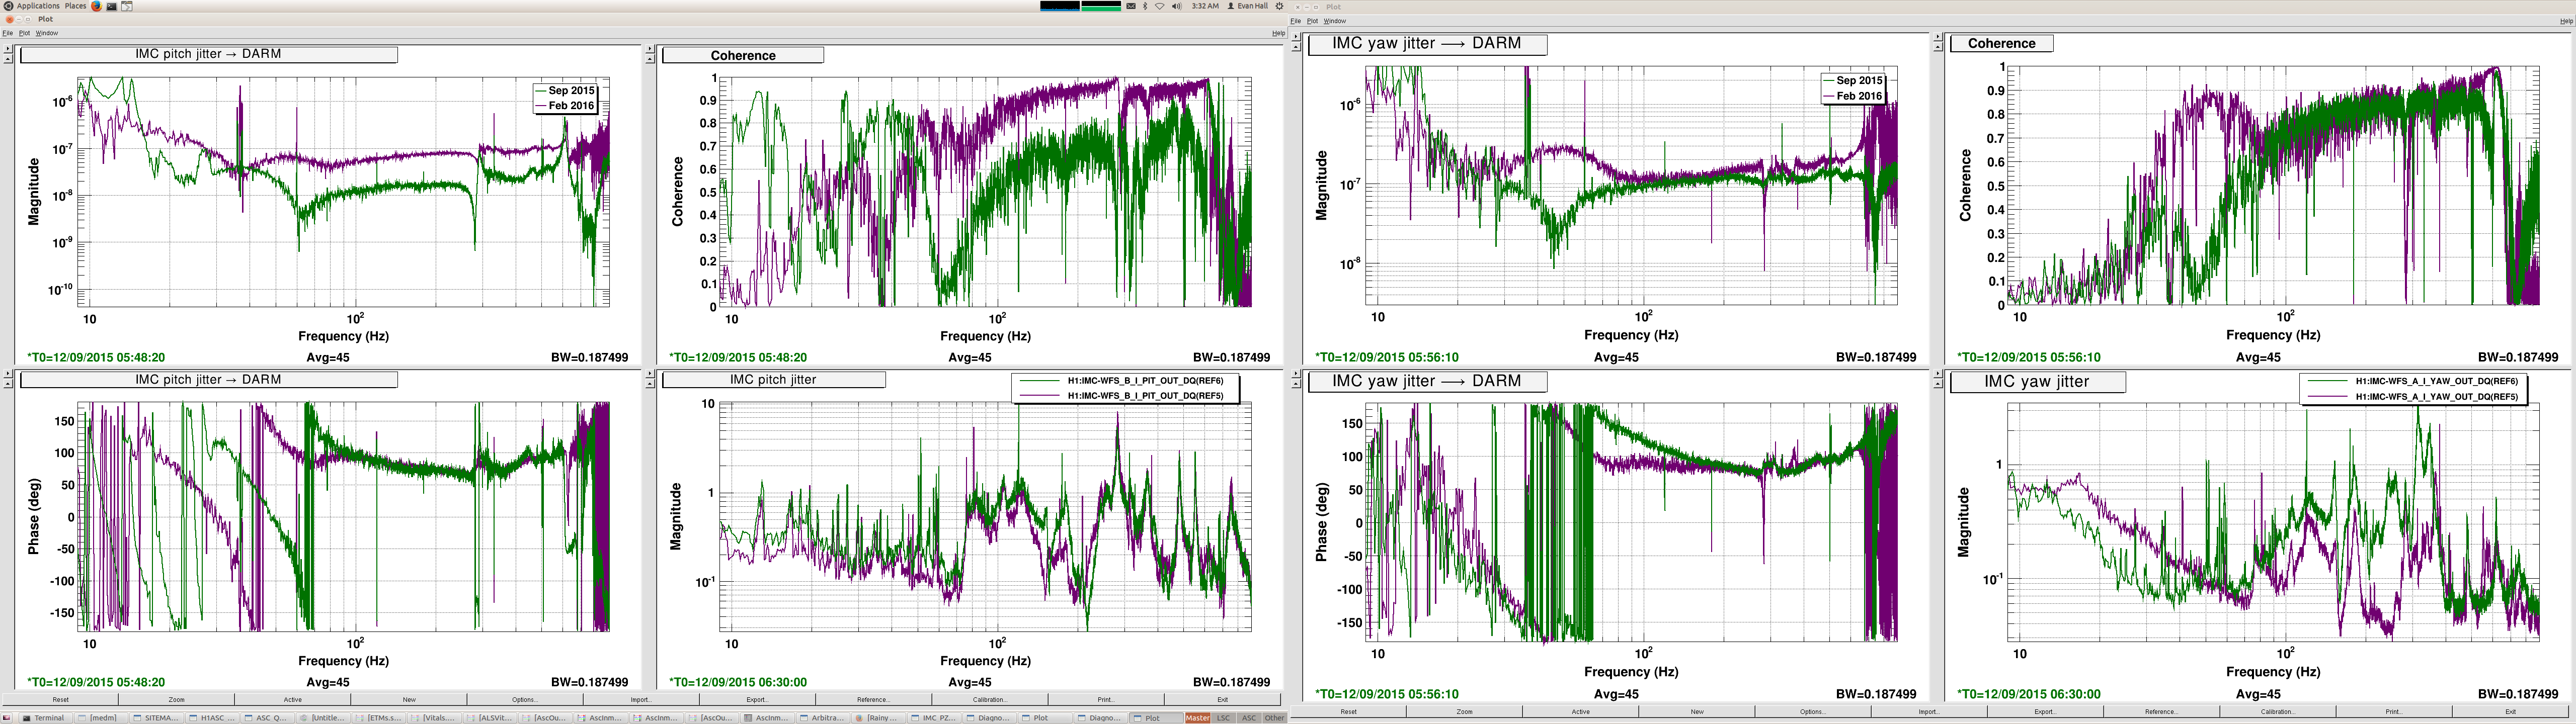
>> As noted previously, the input jitter coupling into DARM is worse than before, particularly in pitch. Den opened the SRM angular loops and moved SRM to minimize the coupling. However, this seemed to make the noise worse in other places. In particular, the region from 35 Hz to 70 Hz swas dominated by some kind of nonstationary excess (perhaps scattering in HAM6). Also, there appeared to be a slight excess frequency noise above 5 kHz.
>> We drove the ITM ring heaters (upper and lower) in common-mode in order to measure the voltage-to-displacement coupling in DARM. By driving a few lines at 250 mVpk between 80 and 160 Hz, we could see that the coupling goes like 1/f2. The levels at 160 Hz are as follows:
|
|
Upper (m/V) |
Lower (m/V) |
|
IX |
2.1×10⁻¹⁷ |
4.6×10⁻¹⁷ |
|
IY |
0.27×10⁻¹⁷ |
1.0×10⁻¹⁷ |
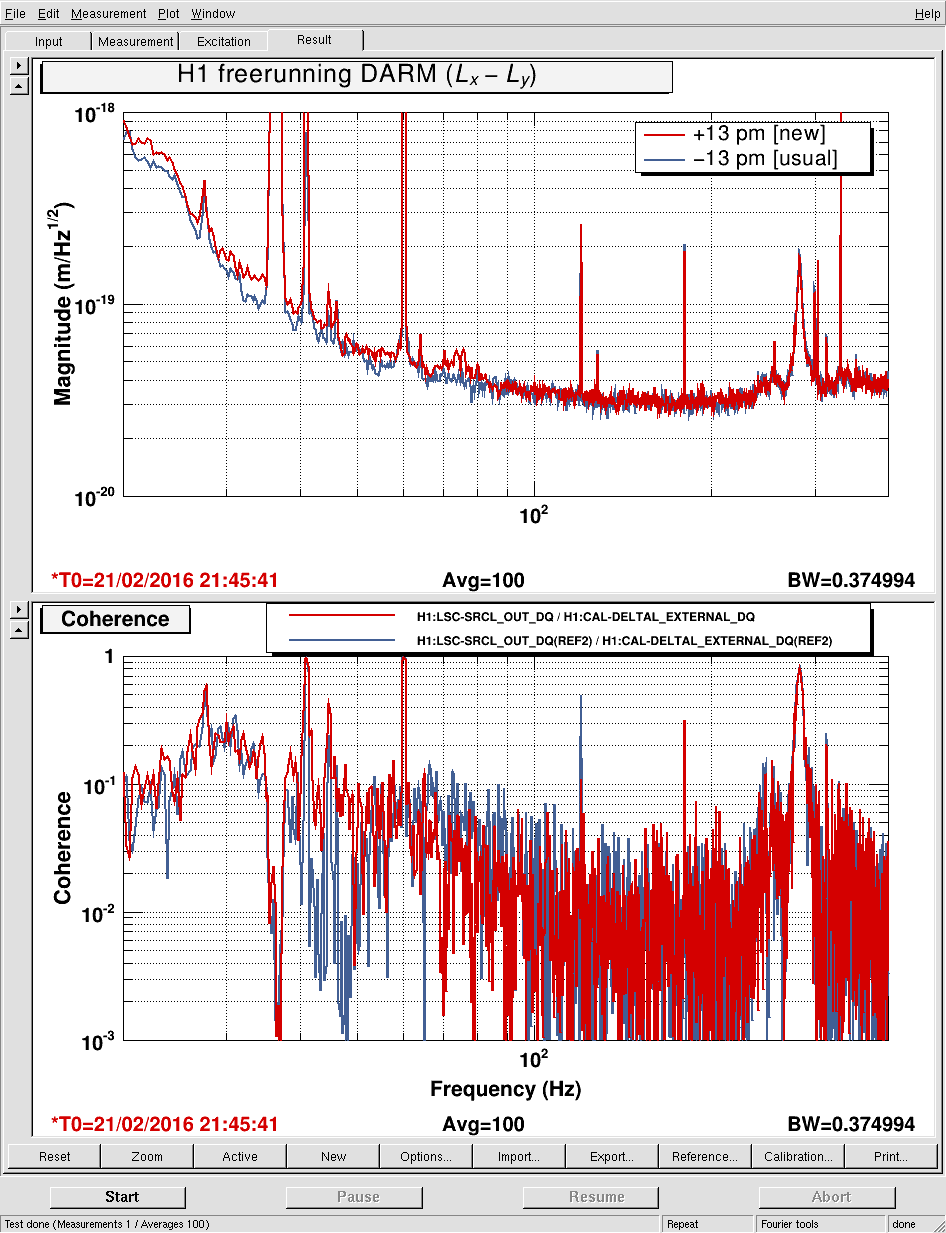
>> We flipped the sign of the DARM offset. Normally we run with the X arm shorter than the Y arm (i.e., a positive offset is applied at the DARM error point, and DARM is Lx − Ly); so here we are running with X arm longer than Y arm. This is achieved with the ISC_LOCK paramter lscparams.omc_sign that is applied at the appropriate points during the dc readout handoff. The sign of the SRCL feedforward also has to be flipped, and the SRCL FF filters that we normally use cause some 1 Hz instability that unlocks the interferometer. We installed a more aggressive AC coupling filter (FM8), and this solved the issue. DARM has a small amount of excess noise with this new offset, but the SRCL coherence does not seemed to have changed much after FF retuning. Good time to look at is 2016-02-21 21:44:40 (bruco).